. 2024 Nov 11;15(11):812.
doi: 10.1038/s41419-024-07220-5.

Single-cell landscape identified SERPINB9 as a key player contributing to stemness and metastasis in non-seminomas

Affiliations

Single-cell landscape identified SERPINB9 as a key player contributing to stemness and metastasis in non-seminomas

Zhouliang Bian et al. Cell Death Dis. .

Abstract

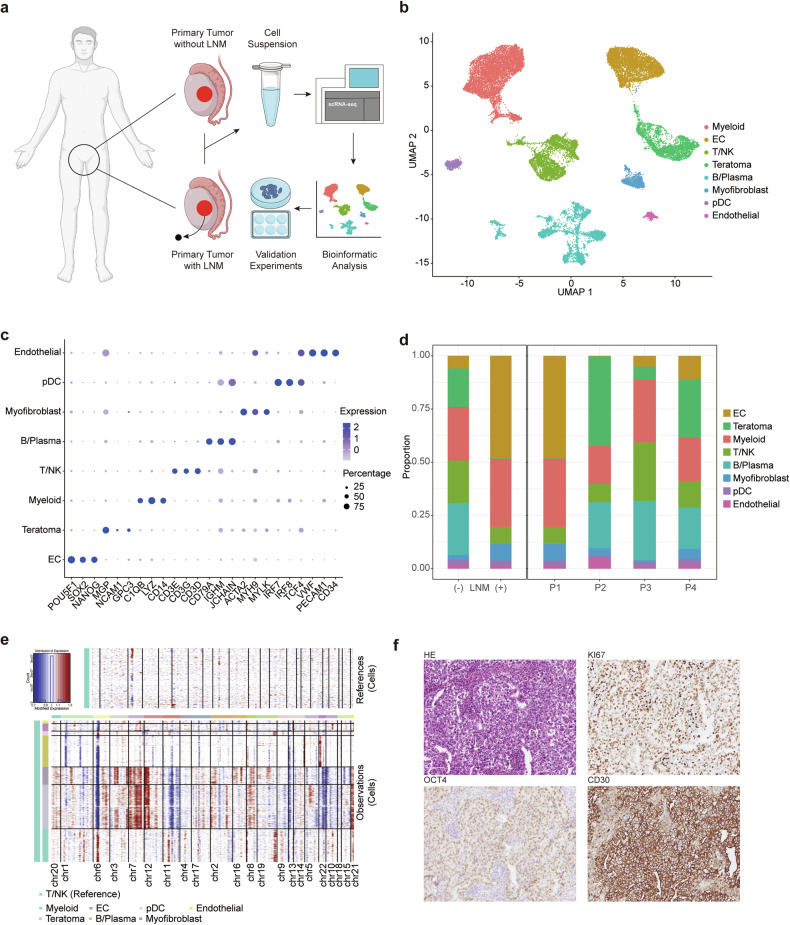
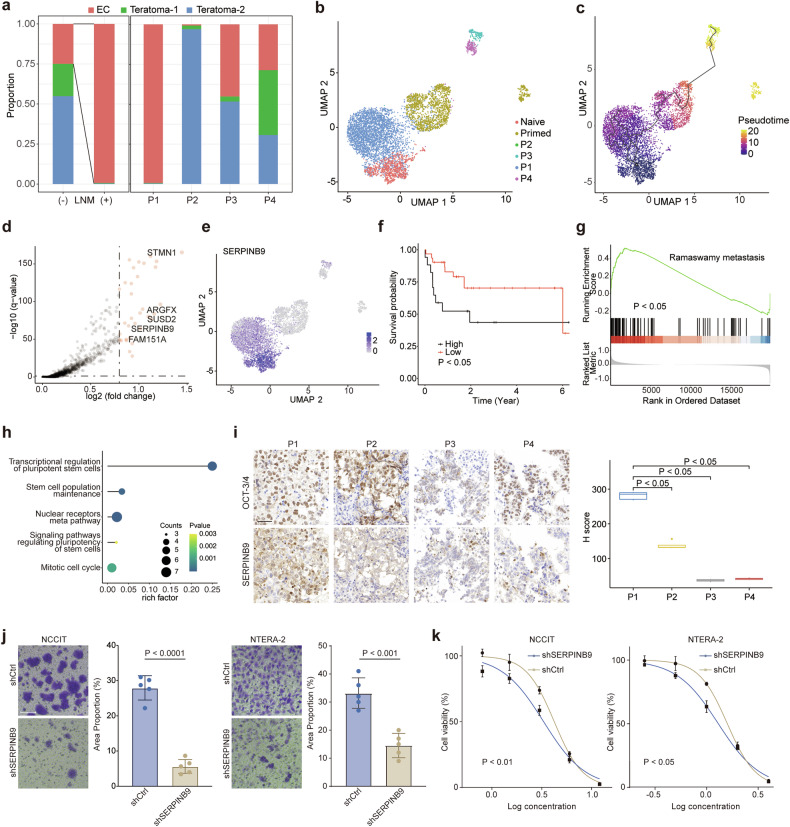
Embryonal carcinoma (EC), characterized by a high degree of stemness similar to that of embryonic stem cells, is the most malignant subtype within non-seminomatous testicular germ cell tumors (TGCTs). However, the mechanisms underlying its malignancy remain unknown. In this study, we employed single-cell RNA sequencing to analyze four non-seminoma samples. Our differential expression analysis revealed high expression of SERPINB9 in metastatic EC cells. We conducted in vitro experiments to further investigate SERPINB9's role in the progression of EC. Functionally, the knockdown of SERPINB9 in NCCIT and NTERA-2 leads to a diminished migratory capability and decreased cis-platin resistance, as demonstrated by Transwell migration assay and drug sensitivity assay. Moreover, embryoid bodies showed reduced size and lower OCT4 expression, alongside heightened expression of differentiation markers AFP, ACTA2, and CD57 in shSERPINB9 cells. In vivo, the role of SERPINB9 in maintaining cancer stemness was validated by the limiting dilution assay. Mechanistically, Bulk RNA-seq further showed downregulation of ERK1/2 signaling and WNT signaling pathways with concomitant upregulation of differentiation pathways subsequent to SERPINB9 knockdown. Additionally, the analysis indicated increased levels of cytokines linked to tertiary lymphoid structures (TLS), such as IL6, IL11, IL15, CCL2, CCL5, and CXCL13 in shSERPINB9 cells, which were further validated by ELISA. Our research indicates that SERPINB9 plays a key role in driving tumor progression by enhancing tumor stemness and suppressing TLS. This study stands as the first to elucidate the molecular signature of non-seminomas at a single-cell level, presenting a wealth of promising targets with substantial potential for informing the development of future therapeutic interventions.


Conflict of interest statement

Competing interests The authors declare no competing interests. Ethics approval and consent to participate The study was conducted in accordance with the Declaration of Helsinki. Ethics approval for human participants was provided by the Ethics Committee of Shanghai Ninth People’s Hospital affiliated with Shanghai Jiao Tong University School of Medicine (approval number: SH9H-2019-T279-3) and the Research Ethics Committee of Shanghai Cancer Center, Fudan University (approval number: 050432-4-2108*). All animal experimental procedures were conducted in accordance with protocols approved by the Animal Care and Use Committee of Shanghai Ninth People’s Hospital, Shanghai Jiao Tong University School of Medicine (approval number: SH9H-2019-A727-1). Informed consent was obtained from all subjects involved in the study. All methods were performed in accordance with the relevant guidelines and regulations.

Figures

Fig. 1
Fig. 1. Identification of cellular composition in non-seminomas.
a Schematic workflow describing the process of sample collection, analysis and validation. b UMAP plot of cells from non-seminoma samples colored by cell populations. c Dot plot of expression levels of canonical marker genes. d Bar plot summarizing the cellular proportion for four non-seminoma samples. e Heatmap showing copy number variation in malignant tumor cells from P4. f HE and IHC staining showing classical markers including OCT4 and CD30 of EC in P1 (scale bar: 100 µm).
Fig. 2
Fig. 2. Tumor heterogeneity captured by scRNA-seq.
a UMAP plot of malignant tumor cells colored by clusters. b RNA velocity analysis showing differentiation from EC to teratoma. c Monocle pseudotime trajectory of non-seminoma tumor cells. d Branched expression heatmap showing significantly changed genes identified by the BEAM function at the branch point. e Heatmap of transcription factor regulon activities estimated by SCENIC. f Genes with significant autocorrelation were grouped into 13 gene modules. g UMAP plots showing the representative gene module activities for three tumor subsets and dot plots showing pathway enrichment of genes in the gene modules.
Fig. 3
Fig. 3. SERPINB9 was identified to be associated with stemness in scRNA-seq dataset.
a Bar plot showing the cellular proportion of non-seminoma tumor cells in four samples. b UMAP plot of EC and hESC cells colored by cell types. c UMAP plot colored by pseudotime inferred by Monocle 3 showing the differentiation trajectory from hESC to EC. d Volcano plot showing higher expression level of SERPINB9, SUSD2 and ARFX in EC cells of primary tumor from metastatic patient. e Featureplot showing the expression pattern of SERPINB9 in hESC and EC cells. f Survival curves showing SERPINB9 expression associated with worse DFI in TCGA TGCT non-seminoma patients (n(high) = 17, n(low) = 31; P value: Gehan-Breslow-Wilcoxon test). g GSEA analysis showed enrichment of metastasis-associated pathway in samples with higher SERPINB9 expression from TCGA non-seminoma dataset. h Dot plot showing up-regulation of pathways associated with pluripotent stem cells in samples with higher SERPINB9 expression from TCGA non-seminoma dataset. i IHC staining showing stronger staining of SERPINB9 on EC cells expressing OCT4 in primary tumor from metastatic patient. Boxplot showing higher H-score of SERPINB9 for sample with metastasis (scale bar: 50 µm; P value: Wilcoxon test with Bonferroni’s correction). j Transwell migration assay showing decrease of migratory capability of NCCIT and NTERA-2 after knockdown of SERPINB9 (scale bar: 50 µm; P value: Welch’s t-test). k Drug sensitivity assay showing decrease of IC50 after the knockdown of SERPINB9 (IC50 for NCCIT: 4.213 µM vs 3.295 µM, IC50 for NTERA-2: 2.386 µM vs 1.950 µM; P value: Welch’s t-test).
Fig. 4
Fig. 4. Role of SERPINB9 in supporting stem cell maintenance as evidenced by in vitro and in vivo studies.
a Representative images for embryoid bodies from shCtrl and shSERPINB9 NCCIT cells (scale bar: 100 µm (upper panel), 50 µm (lower panel)). Bar plot showing the area of embryoid bodies (P value: Wilcoxon rank-sum test). b IF of embryoid bodies from shCtrl and shSERPINB9 NCCIT cells (scale bar: 50 µm). c Heatmap showing the up-regulation of differentiation-associated genes and down-regulation of pluripotency-associated genes after the knockdown of SERPINB9. d Dot plot showing up- and down-regulated signaling pathway after SERPINB9 knockdown. e Representative images of tumors from the limiting dilution assay. f CSC frequency analysis using ELDA software (1/stem cell frequency (95%CI): shCtrl: 4,158 (10,571 - 1,635); shSERPINB9: 74,214 (233,999 - 23,538)). g Tumor growth curves using tumor volumes from each group of the CDX models (P value: Wilcoxon test). h Representative images of F-IHC staining for SERPINB9, OCT4, AFP, ACTA2 and CD57 for the CDX tumor tissues (scale bar: 50 µm).
Fig. 5
Fig. 5. Immune and mesenchymal cell subsets presented in the tumor microenvironment of non-seminomas.
a Bar plot summarizing the cellular proportion of immune cells in non-seminomas. b Survival plot showing association of B/Plasma-associated gene signature with better PFI in TCGA TGCT non-seminoma patients (n(high) = 28, n(low) = 26; P value: Gehan-Breslow-Wilcoxon test). c UMAP plot showing the cell sub-populations in B/Plasma cells. d UMAP plot colored by pseudotime estimated by Monocle 3 showing the differentiation trajectory from memory B cell to plasma cells. e UMAP plot showing expression levels of key marker genes of B/Plasma cells. f UMAP plot of mesenchymal cells colored by sub-clusters. Bar plot summarizing the proportion of mesenchymal cell subsets. g UMAP plot of NK/T cells colored by sub-clusters. Bar plot summarizing the proportion of NK/T cell subsets. h UMAP plot of myeloid cells colored by sub-clusters. Bar plot summarizing the proportion of myeloid cell subsets. i Survival curves plot showing association of MMP12+ macrophage-associated gene signature with worse PFI (n(high) = 22, n(low) = 32; P value: Gehan-Breslow-Wilcoxon test). j Scatter plot showing inverse correlation between samples scored by gene signatures derived from IGF2+ myofibroblasts and B cells in TCGA TGCT non-seminoma dataset using Spearman’s correlation (P value and correlation coefficient: Spearman’s correlation test). k HE and IHC staining showing presence of TLS indicated by CD20 + B cells, CD3 + T cells and CD21 + FDC in primary tumors from non-metastatic patients. l The number of TLS structures in non-seminoma samples (P value: Welch’s t-test). m Up-regulation of cytokines after knockdown of SERPINB9 in RNA-seq dataset. n Up-regulation of cytokines after knockdown of SERPINB9 using ELISA (P value: Welch’s t-test). o Cell-cell communication among cell clusters in non-metastatic non-seminomas. p Schematic illustration of SERPINB9’s role in progression of non-seminomas.

Similar articles

Cited by

References

    1. Batool A, Karimi N, Wu XN, Chen SR, Liu YX. Testicular germ cell tumor: a comprehensive review. Cell Mol Life Sci. 2019;76:1713–27. - PMC - PubMed
    1. Bosl GJ, Motzer RJ. Testicular germ-cell cancer. N. Engl J Med. 1997;337:242–54. - PubMed
    1. Germà-Lluch JR, Garcia del Muro X, Maroto P, Paz-Ares L, Arranz JA, Gumà J, et al. Clinical Pattern and Therapeutic Results Achieved in 1490 Patients with Germ-Cell Tumours of the Testis: the Experience of the Spanish Germ-Cell Cancer Group (GG. Eur Urol. 2002;42:553–63. - PubMed
    1. Vergouwe Y, Steyerberg EW, Eijkemans MJC, Albers P, Habbema JDF. Predictors of occult metastasis in clinical stage I nonseminoma: A systematic review. J Clin Oncol. 2003;21:4092–9. - PubMed
    1. Hermans BP, Sweeney CJ, Foster RS, Einhorn LE, Donohue JP. RISK OF SYSTEMIC METASTASES IN CLINICAL STAGE I NONSEMINOMA GERM CELL TESTIS TUMOR MANAGED BY RETROPERITONEAL LYMPH NODE DISSECTION. J Urol. 2000;163:1721–4. - PubMed

MeSH terms

Supplementary concepts