. 2024 Nov 11;15(1):9743.
doi: 10.1038/s41467-024-53934-7.

Large-scale metagenomic analysis of oral microbiomes reveals markers for autism spectrum disorders

Affiliations

Large-scale metagenomic analysis of oral microbiomes reveals markers for autism spectrum disorders

Paolo Manghi et al. Nat Commun. .

Abstract

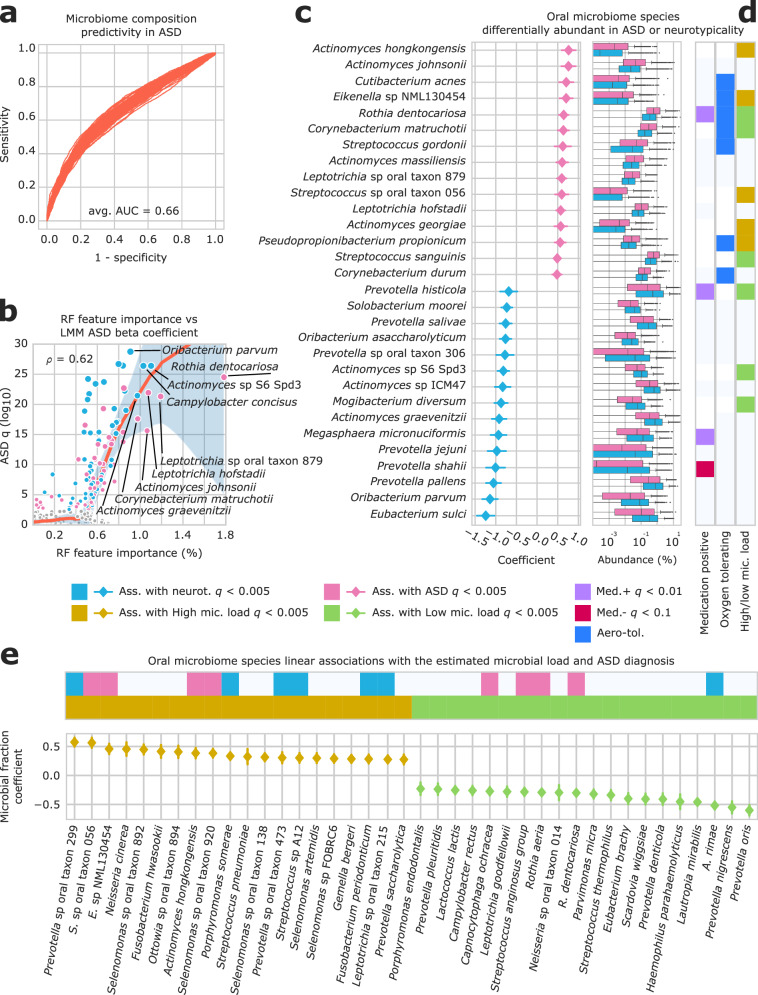
The link between the oral microbiome and neurodevelopmental disorders remains a compelling hypothesis, still requiring confirmation in large-scale datasets. Leveraging over 7000 whole-genome sequenced salivary samples from 2025 US families with children diagnosed with autism spectrum disorders (ASD), our cross-sectional study shows that the oral microbiome composition can discriminate ASD subjects from neurotypical siblings (NTs, AUC = 0.66), with 108 differentiating species (q < 0.005). The relative abundance of these species is highly correlated with cognitive impairment as measured by Full-Scale Intelligence Quotient (IQ). ASD children with IQ < 70 also exhibit lower microbiome strain sharing with parents (p < 10-6) with respect to NTs. A two-pronged functional enrichment analysis suggests the contribution of enzymes from the serotonin, GABA, and dopamine degradation pathways to the distinct microbial community compositions observed between ASD and NT samples. Although measures of restrictive eating diet and proxies of oral hygiene show relatively minor effects on the microbiome composition, the observed associations with ASD and IQ may still represent unaccounted-for underlying differences in lifestyle among groups. While causal relationships could not be established, our study provides substantial support to the investigation of oral microbiome biomarkers in ASD.


Conflict of interest statement

Competing interests The authors do not have any competing interests to declare.

Figures

Fig. 1
Fig. 1. The analysis of the oral microbiome in the SPARK-WGS study.
The SPARK-WGS cohort was established for the study of the genetic basis of ASD through deep whole genome sequencing, collecting salivary DNA from families with ASD subjects across diverse locations across the US, thus allowing analysis of human and microbial sequences (with an initial coverage of 42X in total and 105 M microbial reads on average per sample). curatedMetagenomicData 3 was used to compare the SPARK-WGS cohort with other oral microbiome datasets. Participants included fathers, mothers, NTs and ASD-diagnosed children. The analysed cohort included 7,812 subjects from 2,025 families, the largest portion of which are quartets (n = 1541) or triads (n = 353). Dietary information was included via ARFID score and Picky Factor for diet restrictiveness. Medication history was included in the analysis. Diagnostic scores (social communication questionnaires (SCQ)), developmental coordination disorder questionnaire (DCDQ), repetitive behaviours scale (revised) (RBS-R), and full-scale Intelligence quotient (IQ) (estimated via a machine learning algorithm, Methods) were also collected. The human genomic information was used to compute ASD Polygenic Risk Score (PRS), genetic ancestry principal components, and to estimate the microbial load as an indicator of oral hygiene. Metagenomic sequences were used for taxonomic and strain-level profiling via MetaPhlAn 3 and StrainPhlAn 3, and metabolic repertoire profiling with HUMAnN 3.0 followed by imputation of GBM (gut-brain modules) to assess the microbiome neuroactive potential.
Fig. 2
Fig. 2. Metagenomic analyses identify species-level differences in the oral microbiome of ASD children vs NTs.
a 100 Receiver operating characteristic curves (ROCs) each from a 10-fold, 10 times evaluated Random Forest (RF) classifier discriminating ASD children from NTs using species-level relative abundances (ASD = 2,154, NTs = 1646). Each set was obtained by random sampling at most one child per family and balanced for ASD diagnosis, sex, age, and sequencing depth. b Scatterplot of the per-species RF feature importance (computed only from training folds to avoid overfitting) vs minus the log-10 of the ASD-related q value from a linear mixed model linking ASD diagnosis with centered log-ratio transformed MetaPhlAn 3 species abundances adjusted for sex, age, genetic ancestry, sequencing depth, and blocked by family ID. Orange line marks a lowess regression, and light-blue shaded area its 95% confidence interval. ρ refers to Spearman’s correlations. c ASD diagnosis-related betas from the aforementioned model considering the top-15 ASD-associated (with beta > 0) and the top-15 NTs-associated (beta < 0) at q < 0.005. Horizontal lines mark the 95% confidence intervals. Relative abundances (right) are presented in log-10 scale and coloured by enrichment in diagnostic groups. d Vertical colour bars indicate whether the species is positively, negatively (at q < 0.1), or not associated with use of medications, whether the species is aerotolerant, and whether the species is associated at q < 0.005 with the overall degree of microbial load. e Results for a model including microbial load estimation instead of microbial read depth. Yellow diamonds mark a positive association with microbial load, green diamonds mark a negative association with microbial load. Top-20 species per group are shown.
Fig. 3
Fig. 3. Analysis of dietary habits related scores and IQ in a subgroup of 291 ASD children.
a correlation plot of the betas from the model on the full cohort (ASD = 2154, controls = 1646) vs the betas from an identical model considering the subset of 291 ASD children with available dietary habits data and 241 NTs. b correlation plots of the betas from the differential abundance model considering the above subset and the betas from case-only models assessing the relationship between oral microbiome composition and ARFID score, Picky Factor, and full-scale IQ, within the 291 children with available dietary habits data. ρ refers to Spearman’s correlations. c The top-15 ASD associated and the top-15 NTs associated species from the full cohort differential abundance model are shown for the different models run within the subset. The fifth model refers to the association between IQ and oral microbiome composition adjusted for Picky Factor. Colours for the significant (q < 0.2) associations are reported in the legend. Grey refers to q > 0.2. d Variable importance assessed via permutation test in constraints ordination (Ordistep) on Aitchison pairwise distances among 291 ASD individuals reveals importance of Picky Factor and predominance of IQ over Picky Factor in determining oral microbiome dispersion. Variables are the same as Ext.DataFig. b With the exclusion of family ID and ASD diagnosis. (right) Picky Factor is excluded (non-significant) by the stepwise model selection when IQ is included.
Fig. 4
Fig. 4. Strain sharing analysis reveals differences between ASD children and NTs that are linked to IQ.
a person-to-person strain sharing (left: with father, right: with mother) coloured by diagnosis (pink = ASD, blue = NTs, n = 1,525 and 1,525). b between sibling strain sharing rates for 111 species evaluated at the strain level divided by IQ category (≤70, >70 & ≤85, >85) (each dot represents a sample average rate of strain sharing, n = 1525). c father-child strain sharing. ASD children (n = 1525) are divided by IQ category (≤70, >70 & ≤85, >85). NTs are reported in blue. Red line represents the median of the ≤70 IQ group. d mother-child strain sharing. ASD children (n = 1525) are divided by IQ category (≤70, >70 & ≤85, >85). NTs are reported in blue. Red line represents the median of the ≤70 IQ group. Numbers refer to Post-hoc Dunn-test q values; ns (non-significant) refers to q > 0.05. ‘d’ stands for Cohen’s d (standardized mean difference).
Fig. 5
Fig. 5. Differential abundance of salivary microbiome-derived MetaCyc pathways between ASD children (N = 2139) and controls (N = 1646).
a the top-15 ASD associated and the top-15 control associated (q < 10−7) MetaCyc pathways from a linear mixed model of ASD diagnosis adjusted for sex, age, genetic ancestry, sequencing depth, and alpha-diversity, and blocked by family ID. The beta from the same pathways is reported for an identical model on 291 ASD children with available diet information and 241 NTs, and linear models assessing the relationship between MetaCyc pathway and ARFID score, Picky Factor, and full-scale IQ on 291 ASD children. b (left) ASD-associated species contributing to EC numbers that are in the MetaCyc serotonin degradation pathway are reported, with the mean difference in enzyme coverage between ASD and NTs, and the number of ASD samples in which the contribution is observed. (right) the serotonin degradation MetaCyc pathway is reported. The three enzymes identified in microbial reads are highlighted.
Fig. 6
Fig. 6. Differential abundance of microbiome-derived gut-brain (GB) modules between ASD children (N = 2139) and controls (N = 1646).
a (left) 19 associated (q < 0.005) GB modules from a linear mixed model of ASD diagnosis in 3,785 salivary microbiome samples, adjusted for sex, age, genetic ancestry, sequencing depth, and alpha-diversity, and blocked by family ID. b reactions related to dopamine degradation in the MetaCyc biogenic amine degradation pathway pathway. c (top) reactions related to GABA degradation to ammonium and butyrate in the MetaCyc GABA degradation pathway; (bottom) ASD-associated species contributing to EC numbers that are in the MetaCyc GABA degradation pathway are reported, with the mean difference in enzyme coverage between ASD and NTs, and the number of ASD samples in which the contribution is observed.

References

    1. Lord, C. et al. Autism spectrum disorder. Nat. Rev. Dis. Prim.6, 5 (2020). - PMC - PubMed
    1. Posar, A., Resca, F. & Visconti, P. Autism according to diagnostic and statistical manual of mental disorders 5(th) edition: the need for further improvements. J. Pediatr. Neurosci.10, 146–148 (2015). - PMC - PubMed
    1. Lai, M.-C., Lombardo, M. V. & Baron-Cohen, S. Autism. Lancet383, 896–910 (2014). - PubMed
    1. Feliciano, P. et al. Exome sequencing of 457 autism families recruited online provides evidence for autism risk genes. NPJ Genom. Med.4, 19 (2019). - PMC - PubMed
    1. Markram, K. & Markram, H. The intense world theory – a unifying theory of the neurobiology of Autism. Front. Hum. Neurosci.4, 224 (2010). - PMC - PubMed

Publication types

Associated data