

Perception of smallholder farmers about climate change and its impacts on crop production across agroecological zones of the Gassera District, Southeastern Ethiopia
- PMID: 39528616
- PMCID: PMC11555119
- DOI: 10.1038/s41598-024-75778-3
Perception of smallholder farmers about climate change and its impacts on crop production across agroecological zones of the Gassera District, Southeastern Ethiopia
Abstract
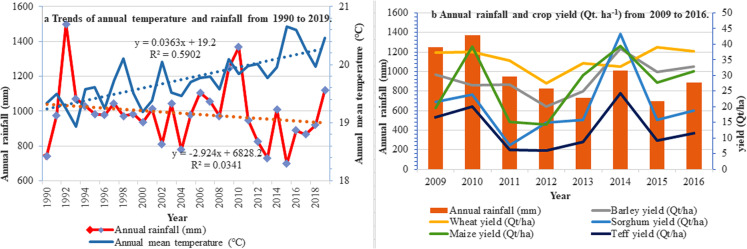
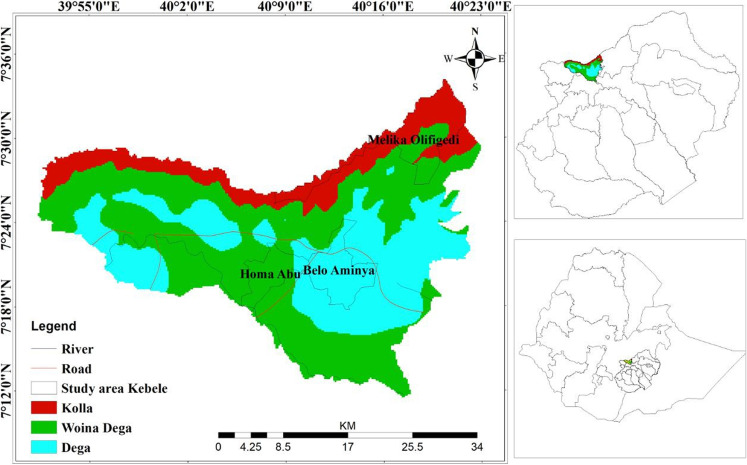
Climate change and variability have threatened rainfed agriculture by affecting the livelihoods of rural communities in Ethiopia. The study area, Gassera District, is among the high-potential crop production areas of the Bale Zone and is severely impacted by recurrent droughts resulting from climate change. This study evaluated smallholder farmers' perceptions of significant climate change and its effects on food crop production across the agroecological zones of the Gassera District. A cross-sectional survey design was employed to collect data from 444 farm households via multistage random sampling techniques. Multiple linear regression (MLR) models were used for the data analysis. The results revealed that 98.5% of the interviewed farmers were aware of climate variability and that 51.6% understood its impact to a reasonable extent. However, over half of the farmers did not perceive climate change as the greatest threat to their livelihood. Most farmers experienced rain becoming more erratic, starting late, and ending early as medium climatic factors (60.4%, 68.1%, and 66.2%, respectively), affecting their crop production. The results revealed that rainfall had a negative and insignificant decreasing trend (2.92 mm/year). The annual mean temperature exhibited a positive and statistically significant increasing trend (Ρ < 0.01). Crop production is positively and linearly correlated with the amount of annual rainfall at the Ρ ≤ 0.05 level of significance. The findings revealed that the greatest crop yield loss was associated with lowland agroecology. The MLR results revealed that farmer agroecology, age, sex, and chemical use had substantial impacts on crop yield loss. We urge farmers to understand the long-term effects of climate change on their livelihoods.
Keywords: Climate change; Climate variability; Farmers’ perceptions; Impact on crops; Vulnerability.
© 2024. The Author(s).
Conflict of interest statement
Figures

Similar articles
-
Trends of climate variability and its association with farmers' perceptions of climate change in Gassera district, southeastern Ethiopia.Sci Rep. 2025 Feb 5;15(1):4399. doi: 10.1038/s41598-025-89017-w. Sci Rep. 2025. PMID: 39910327 Free PMC article.
-
Adapting to climate variability and change: experiences from cereal-based farming in the central rift and Kobo Valleys, Ethiopia.Environ Manage. 2013 Nov;52(5):1115-31. doi: 10.1007/s00267-013-0145-2. Epub 2013 Aug 14. Environ Manage. 2013. PMID: 23943096
-
Factors Influencing Smallholder Farmers' Climate Change Perceptions: A Study from Farmers in Ethiopia.Environ Manage. 2016 Aug;58(2):343-58. doi: 10.1007/s00267-016-0708-0. Epub 2016 May 14. Environ Manage. 2016. PMID: 27179801
-
A Global Review of the Impacts of Climate Change and Variability on Agricultural Productivity and Farmers' Adaptation Strategies.Food Sci Nutr. 2025 May 14;13(5):e70260. doi: 10.1002/fsn3.70260. eCollection 2025 May. Food Sci Nutr. 2025. PMID: 40370417 Free PMC article. Review.
-
Smallholder farmers' climate change adaptation in Ghana: A systematic literature review and future directions.J Environ Manage. 2025 Jun;384:125598. doi: 10.1016/j.jenvman.2025.125598. Epub 2025 May 5. J Environ Manage. 2025. PMID: 40319697 Review.
Cited by
-
Impacts of climate variability and adaptation strategies on staple crop productivity in Sidama, Ethiopia.Sci Rep. 2025 Jul 28;15(1):27461. doi: 10.1038/s41598-025-11880-4. Sci Rep. 2025. PMID: 40721719 Free PMC article.
References
-
- Castro, P., Azul, M., Leal, W., Ulisses, F. & Azeiteiro Editors, M. Climate Change Management Climate Change-Resilient Agriculture and Agroforestry Ecosystem Services and Sustainability. Ecosystem Services and Sustainability (Springer Nature Switzerland, 2019).
-
- Alvi, S., Jamil, F., Roson, R. & Sartori, M. Do farmers adapt to climate change? A macro perspective. Agric. 10, 1–12 (2020).
-
- Mekonnen, A., Tessema, A., Ganewo, Z. & Haile, A. Climate change impacts on household food security and adaptation strategies in southern Ethiopia. Food Energy Secur.10, 1–14 (2021).
-
- Chukwuone, N. Analysis of the Impact of Climate Change on Growth and Yield of Yam and Cassava and Adaptation Strategies by Farmers in Southern Nigeria (2015).
-
- Vulnerability, U. S. A. I. D. Impacts, and Adaptation Assessment in the East Africa Region. in Vulnerability, Impacts and Adaptation Assessment in the East Africa Region. (eds. Galu, G., Omondi, P., Okumu, M. & Odingo, P.) 1–92 (Camco Advisory Services (K) Ltd, (2017).
MeSH terms
LinkOut - more resources
Full Text Sources
Medical
