. 2025 Jan;5(1):48-64.
doi: 10.1038/s43587-024-00743-8. Epub 2024 Nov 11.

Chronic social stress induces p16-mediated senescent cell accumulation in mice

Affiliations

Chronic social stress induces p16-mediated senescent cell accumulation in mice

Carey E Lyons et al. Nat Aging. 2025 Jan.

Abstract

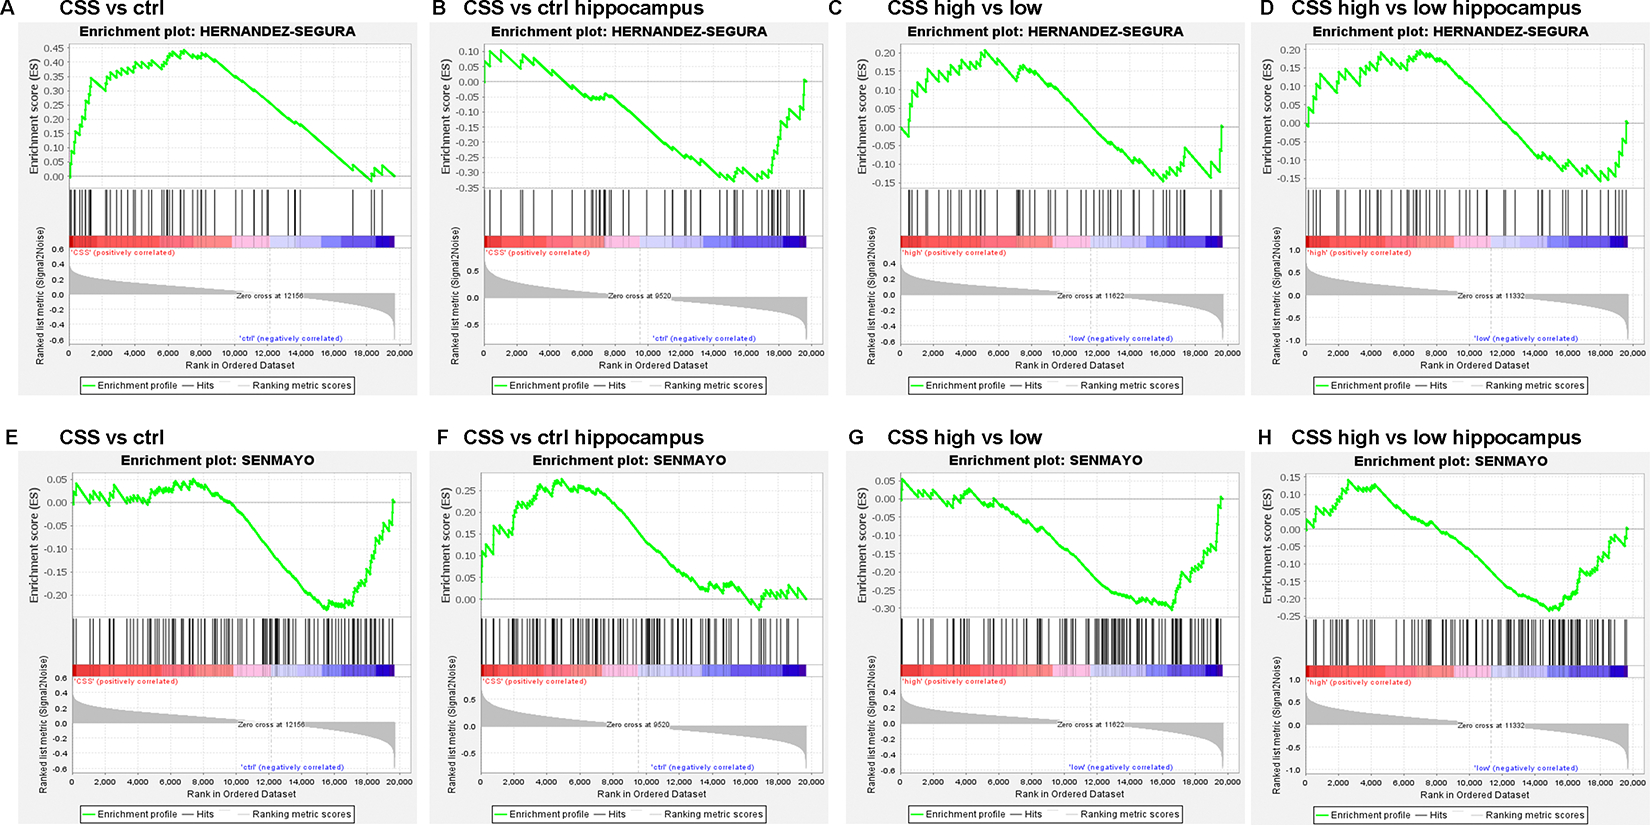
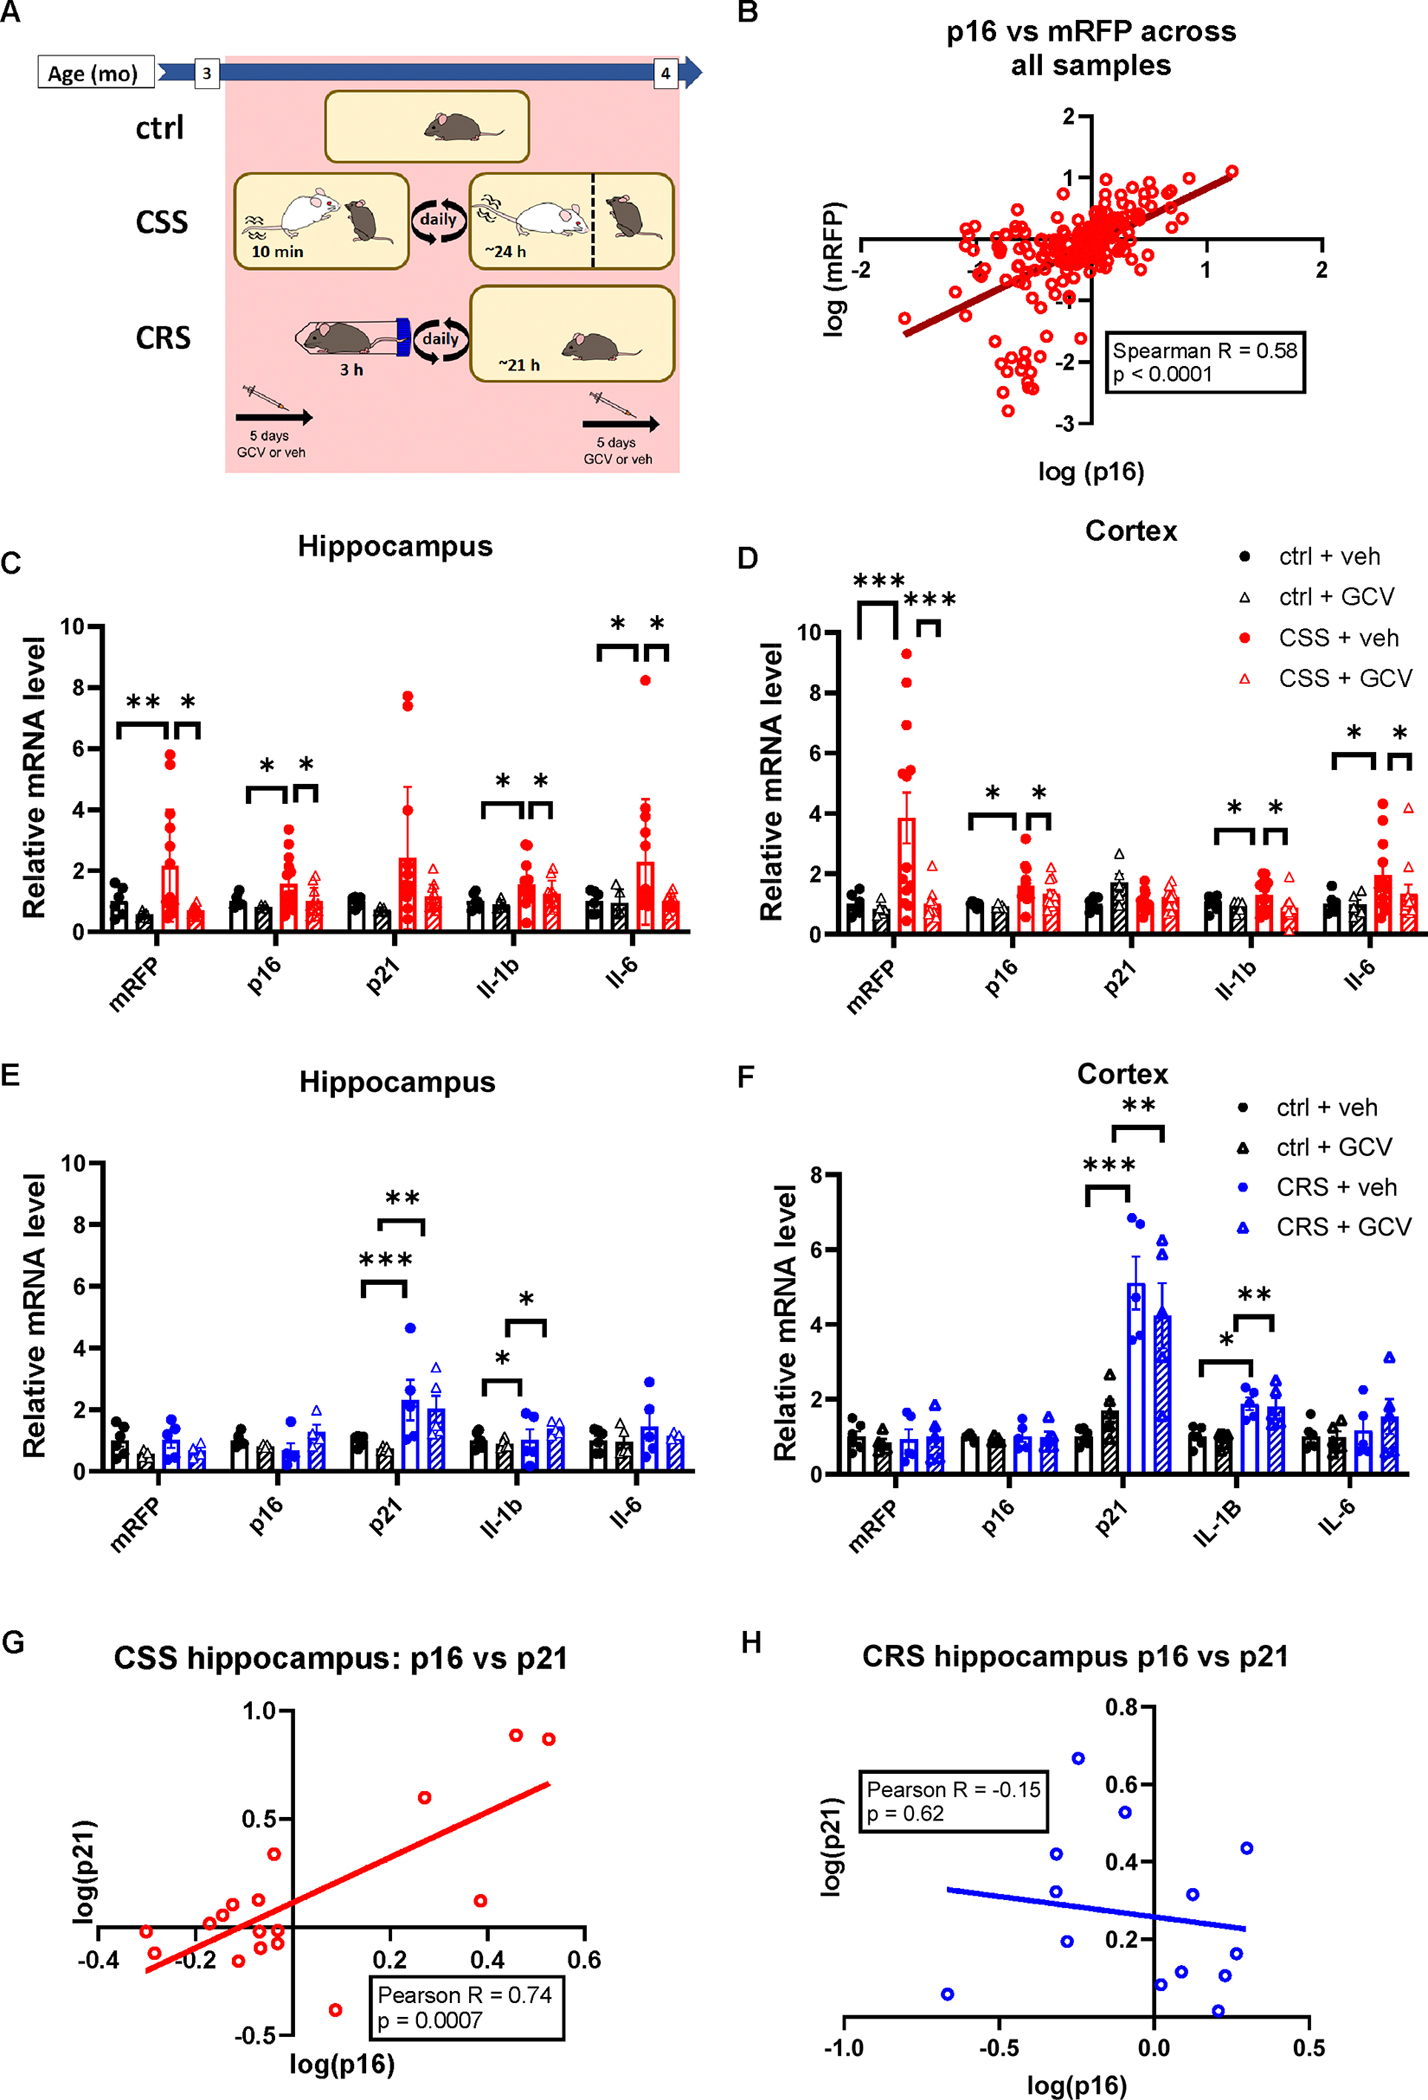
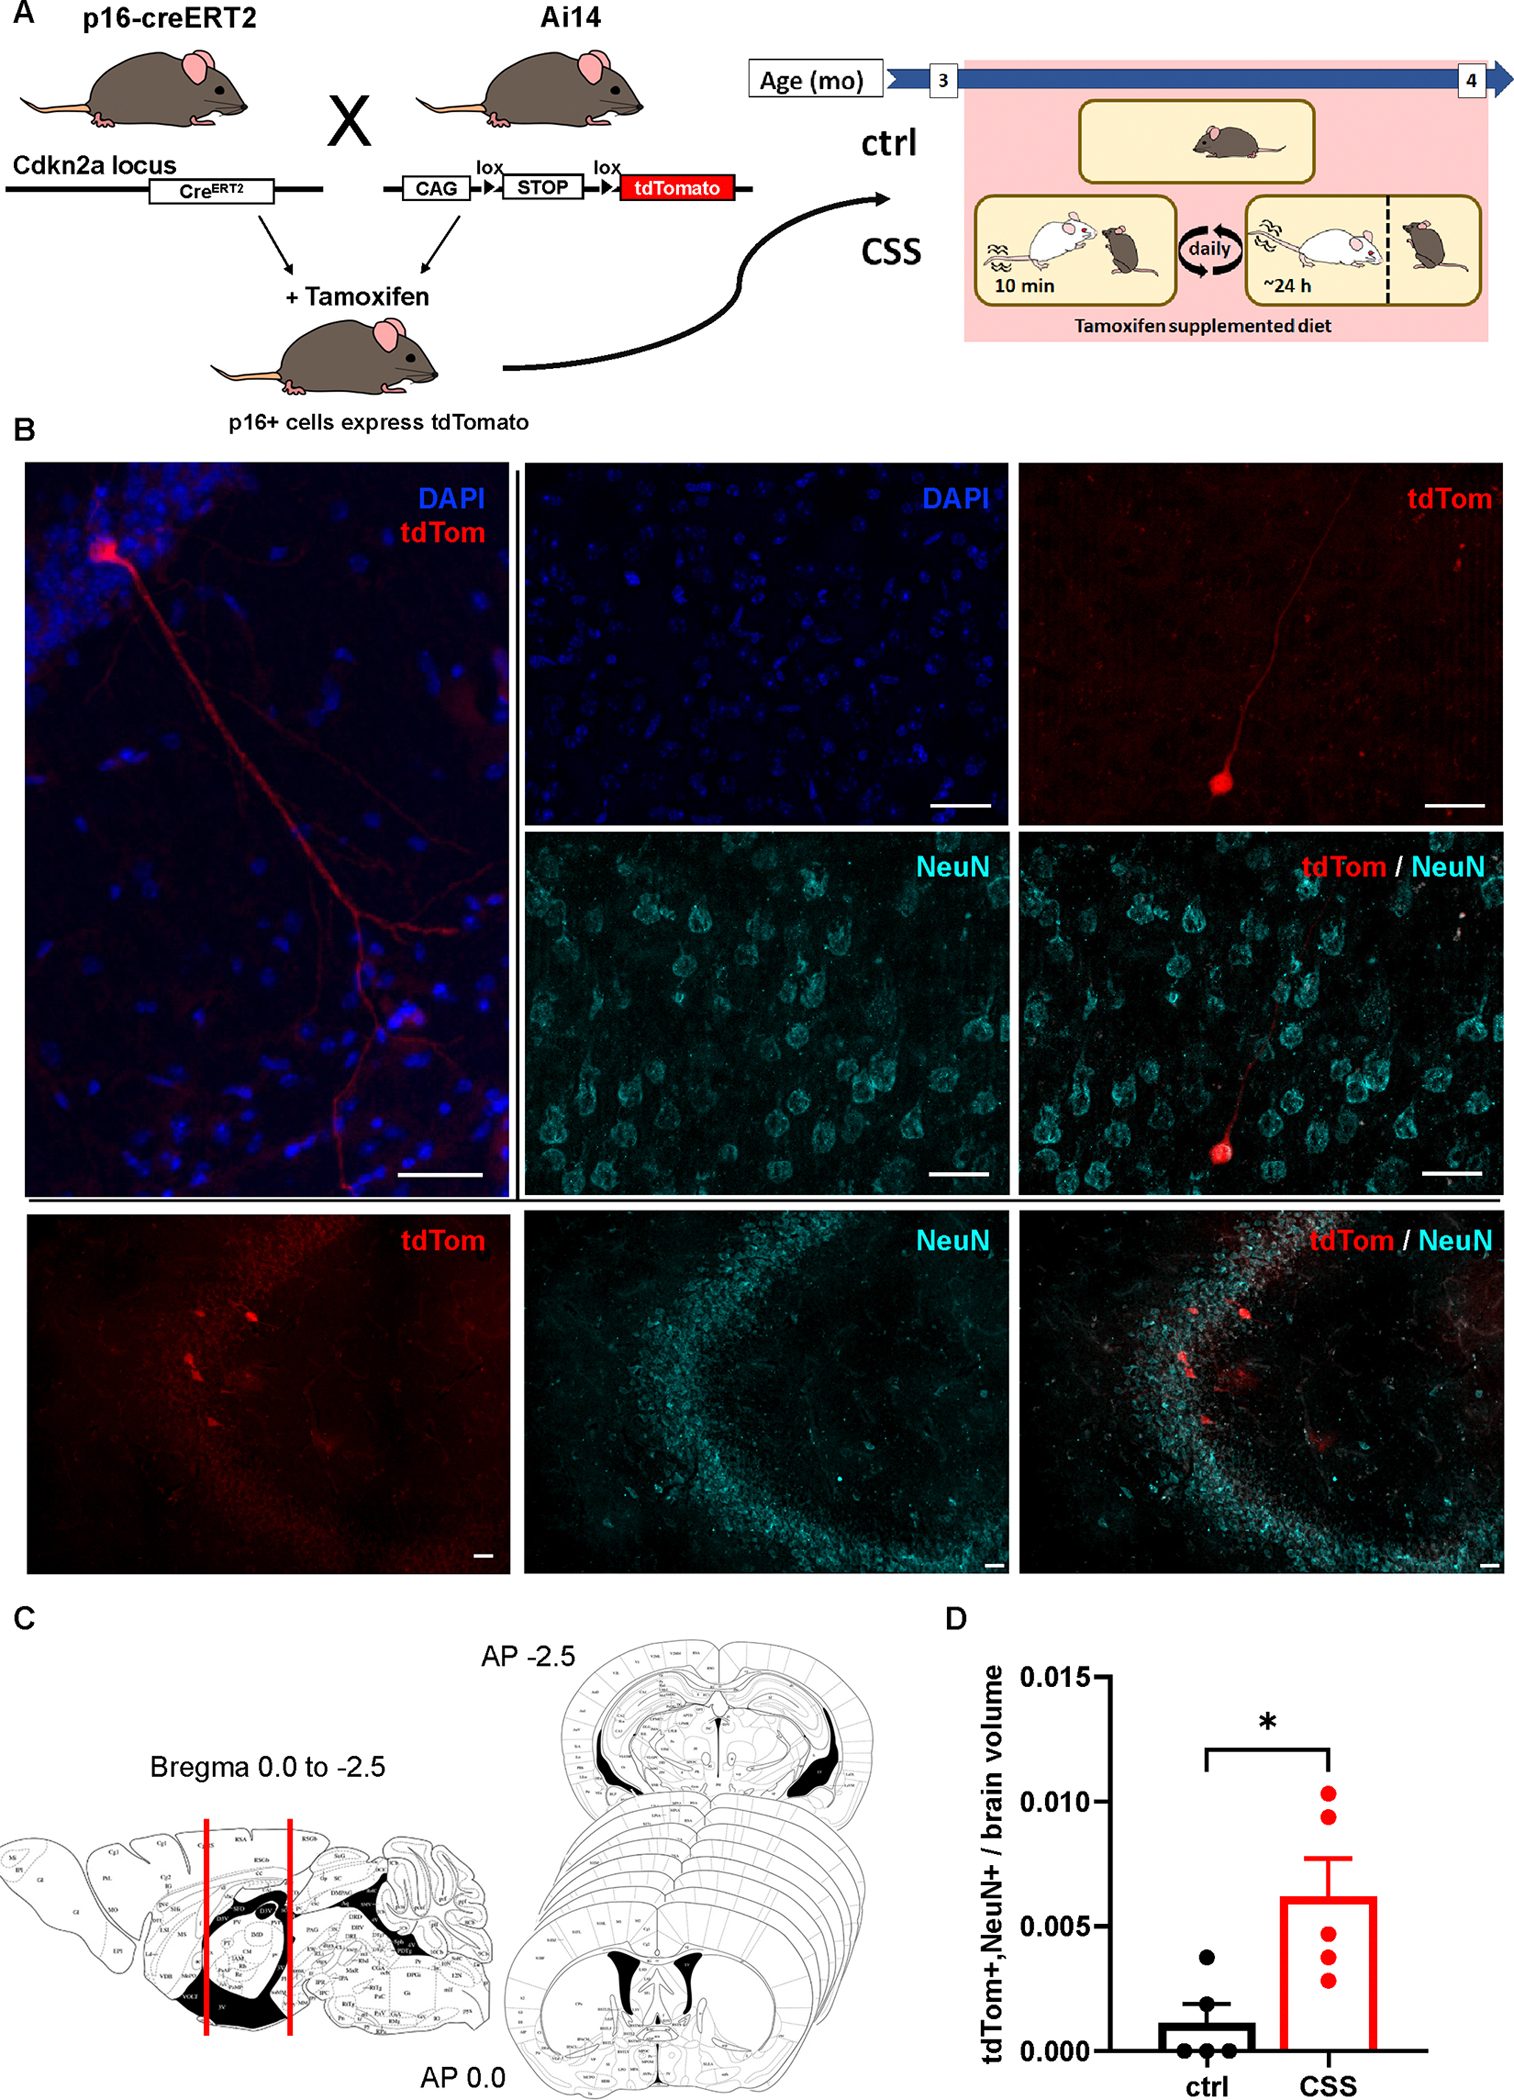
Life stress can shorten lifespan and increase risk for aging-related diseases, but the biology underlying this phenomenon remains unclear. Here we assessed the effect of chronic stress on cellular senescence-a hallmark of aging. Exposure to restraint stress, a psychological non-social stress model, increased p21Cip1 exclusively in the brains of male, but not female mice, and in a p16Ink4a-independent manner. Conversely, exposure to chronic subordination stress (only males were tested) increased key senescent cell markers in peripheral blood mononuclear cells, adipose tissue and brain, in a p16Ink4a-dependent manner. p16Ink4a-positive cells in the brain of chronic subordination stress-exposed mice were primarily hippocampal and cortical neurons with evidence of DNA damage that could be reduced by p16Ink4a cell clearance. Clearance of p16Ink4a-positive cells was not sufficient to ameliorate the adverse effects of social stress on measured metrics of healthspan. Overall, our findings indicate that social stress induces an organ-specific and p16Ink4a-dependent accumulation of senescent cells, illuminating a fundamental way by which the social environment can contribute to aging.


Conflict of interest statement

Competing interests: D.J.B. and J.M.v.D. have a potential financial interest related to this research. J.M.v.D. is a cofounder of Unity Biotechnology, D.J.B. and J.M.v.D. are co-inventors on patents held by Mayo Clinic and patent applications licensed to or filed by Unity Biotechnology, and D.J.B. and J.M.v.D. are Unity shareholders. Research in the Baker laboratory has been reviewed by the Mayo Clinic Conflict of Interest Review Board and is being conducted in compliance with Mayo Clinic Conflict of Interest policies. The other authors declare no conflicts of interest.

Figures

Extended data figure 1.
Extended data figure 1.. Flow cytometry gating scheme.
Flow cytometry gating scheme used to identify major immune cell subsets (CD45+) in peripheral blood; including neutrophils (Ly6G+ CD11b+), Ly6C+ classical monocytes (Ly6C+ CD115+ CD11b+ Ly6G−), Ly6C− nonclassical monocytes (Ly6C− CD115+ CD11b+ Ly6G−), B cells (CD19+ Ly6G− CD115−), CD4 T cells (CD4+ TCRb+ Ly6G− CD115−), and CD8 T cells (CD4+ TCRb+ Ly6G− CD115−).
Extended data figure 2.
Extended data figure 2.. Senescence-associated β-galactosidase (SA β-gal).
A-D) Representative gross images of subcutaneous white adipose tissue (scWAT), Liver, Kidney, Hippocampus, and Cortex of control (ctrl) and Chronic Subordination Stress (CSS) mice following senescence-associated β-galactosidase staining. A-C) CSS mice have significantly more SA β-gal positive cells in the scWAT than control mice (p=0.001). Unpaired, two-sided t test. Ctrl N=3; CSS N=4. A-D) No significant difference between control and CSS mice in SA β-gal staining in the liver, kidney, liver, hippocampus or cortex. Unpaired, two-sided t test. Ctrl N=3; CSS N=4 * indicates p<0.05. Scale bars represent 50μm unless otherwise specified. Histogram bars represent group mean. Error bars represent standard error of the mean (SEM). Scale bars represent 1mm.
Extended data figure 3.
Extended data figure 3.. RNAscope representative images in animals exposed to Chronic Subordination Stress (CSS).
A) 10x DAPI stitched images of entire sagittal sections showing boxed regions of interest at various medial-lateral positions in which they appear. B) 60x fields of view captured from regions of high p16/p21 expression (CA3 – hippocampus and somatosensory cortex) and regions with negligible p16/p21 expression (BST – bed nucleus of stria terminalis | PVN – paraventricular nucleus | LC – locus coeruleus | MEA – medial amygdala nucleus) showing DAPI, Rbfox3 (neurons), p21, and p16. Scale bars represent 50μM. Experiment was repeated twice with similar results; second pass was to have a cohort large enough for valid statistical analysis.
Extended data figure 4.
Extended data figure 4.. Effect of Chronic Subordination Stress (CSS) or Chronic Restraint Stress (CRS) on gene expression.
A-D) Senescence/senescence associated secretory phenotype (SASP)-related gene expression in the CSS exposed mice. E-F) Senescence/SASP-related gene expression in the lung and liver in animals exposed to CRS. Control + vehicle (Ctrl+veh) N=6; ctrl + ganciclovir (GCV) N=5; CSS+veh N=14; CSS+GCV N=11; CRS+veh N=9; CRS+GCV N=5; G) CSS + GCV group had significantly higher expression of IL1B than ctrl (p=0.046). G-H) Senescence/SASP-related gene expression in the hippocampus and cortex of CRS exposed female mice. Ctrl+veh N=5; ctrl+GCV N=4; CRS+veh N=6; CRS+GCV N=5. 2-way ANOVA, Tukey post hoc. * indicates p<0.05. Histogram bars represent group mean. Shaded bars represent GCV treatment groups. Error bars represent standard error of the mean (SEM).
Extended data figure 5.
Extended data figure 5.. Histological analysis of p16CreERT2;Ai14 mice.
A) Tamoxifen (Tam) is required for tdTomato (TdTom) expression in p16CreERT2;Ai14 mice. Control (Ctrl) Tam− N=5, ctrl Tam+ N=5 (p=0.017). Two-sided, unpaired t-test. Histogram bars represent group mean. Error bars represent standard error. B) Representative images of tdTom+ cells co-stained with NeuN (neurons), and GFAP+ (astrocytes), Iba1+ (microglia), and NG2+ (oligodendrocytes precursors, OPCs) cells which were all negative for TdTom; multi-staining repeated twice with consistent results. Scale bars represent 30μm. **p<0.01.
Extended data figure 6.
Extended data figure 6.. Gene set enrichment analysis (GSEA).
GSEA for the Hernandez-Segura et al. gene set (genes represented in Hernandez-Segura’s list = 52) in mouse whole brain (A-C) or hippocampus (B-D). GSEA mRNA expression levels using the SenMayo gene set (genes represented in SenMayo’s list = 118) in mouse whole brain (E-F) or hippocampus (G-H). X axis represents: (A-B and E-F) chronic subordination stress (CSS)/control level; (C-D and G-H) CSS high p16 expressing/CSS low p16 expressing. Y axis represents the enrichment score of these mRNAs.
Extended data figure 7.
Extended data figure 7.. Gene expression analysis.
A-F) Select genes in the NLRP3 inflammasome pathway and G-L) select genes in the RAF:RAS pathway in the hippocampus or cortex of male mice. Control (Ctrl)=4; Chronic Subordination Stress (CSS)=5. Unpaired, two-sided t test (A: p=0.0169; B: p<0.0001). Bars represent group mean and error bars represent standard error of the mean (SEM). * p<0.05, ****p<0.0001.
Extended data figure 8.
Extended data figure 8.. Behavioral and physiological characterization of mice exposed to Chronic Subordination Stress (CSS) or Chronic Restraint Stress (CRS).
A) Diagram of the experimental protocol. B) CSS increases body weight gain irrespective of GCV treatment. Ctrl+veh vs CSS+veh p=0.0091. ctrl+veh vs CSS+GCV p=0.0412. ctrl+GCV vs CSS+veh p = 0.0007. ctrl+GCV vs CSS+GCV p=0.0030. 2-way ANOVA, Tukey post hoc. Ctrl+veh N=15, Ctrl+GCV N=7, CSS+veh N=28, CSS+GCV N=14. C) CSS increases body weight gain irrespective of GCV treatment. Ctrl+veh vs CSS+veh p=0.0010. Ctrl+veh vs CSS+GCV p=0.0178. ctrl+GCV vs CSS+veh p=0.0036. ctrl+GCV vs CSS+GCV p=0.0229. 2-way ANOVA, Tukey post hoc. Ctrl+veh N=15, Ctrl+GCV N=7, CSS+veh N=28, CSS+GCV N=14.D) CSS affects expression of select Hypothalamus Pituitary Adrenocortical (HPA)-axis related genes in the hypothalamus, cortex or hippocampus irrespective of GCV treatment. 1-way ANOVA. CRH= Corticotropin-releasing hormone, GR=glucocorticoids receptor. Ctrl+veh=3–4, CSS+veh=4–5, CSS+GCV=6. E-F) CRS decreases body weight in male mice irrespective of GCV treatment. Ctrl+veh vs CSS+veh p<0.0001. ctrl+veh vs CSS+GCV p<0.0001 ctrl+GCV vs CSS+veh p<0.0001. ctrl+GCV vs CSS+GCV p<0.0001. 2-way ANOVA. Tukey post hoc. Ctrl+veh=15, Ctrl+GCV=7, CRS+veh=15, CRS+GCV=9. G-H) CRS exerts no effect in female mice. Ganciclovir (GCV) decreases body weight gain in control but not CRS treated mice. Ctrl+veh vs ctrl+GCV p=0.0246. 2-way ANOVA. Tukey post hoc. Ctrl+veh=5, Ctrl+GCV=5, CRS+veh=6, CRS+GCV=5. * indicates p<0.05, ** indicates p<0.01; *** indicates p<0.001; **** indicates p<0.0001. Shaded bars indicate GCV treatment groups. Histograms represent group mean and error bars represents standard error of the mean (SEM).
Extended data figure 9.
Extended data figure 9.. Behavioral and physiological characterization of mice exposed to lifelong Chronic Subordination Stress (CSS) up to 17 months of age.
A) Diagram of the experimental protocol. B) while treatment group didn’t affect body weight (age: F(1.66, 94.73)=391.1, p<0.0001; group: F(3,63)=0.24, p=0.86; age x group: F(12, 228)=1.12, p=0.35), CSS causes hyperphagia. C) (age: F(2.74, 150.7)=11.1, p<0.0001; group: F(3,63)=10.72, p<0.0001; age x group: F(12, 220)=2.51, p=0.0042) and increases clinical frailty index (CFI). D) (age: F(2, 110)=149.6, p<0.0001; group: F(3,63)=2.39, p=0.076; age x group: F(6, 110)=2.05, p=0.06) – including loss of fur color). E) (age: F(1.71, 94.03)=46.76, p<0.0001; group: F(3,63)=6.14, p=0.001; age x group: F(6, 110)=4.17, p=0.0008) irrespective of Ganciclovir (GCV) treatment. Ctrl+veh=14, Ctrl+GCV=15, CSS+veh=14–19 (range due to animal death during the experiment), CSS+GCV=9–19 (range due to animal death during the experiment). * indicates p<0.05, ** indicates p<0.01; *** indicates p<0.001; **** indicates p<0.0001. 2-way ANOVA, Tukey post hoc. Data are represented as group means and error bars represent standard error of the mean (SEM).
Extended data figure 10.
Extended data figure 10.. RNAscope representative images validating mRFP expression, and colocalization with p16 and p21.
Representative RNAscope Fluorescent In Situ Hybridization images showing probes for mRFP, p21, and p16 expression in Hippocampus-CA3 (A) and somatosensory cortex (B) in vehicle (Veh) treated control animals (Ctrl), veh treated chronic Subordination Stress (CSS) animals, and Ganciclovir (GCV) treated CSS animals. The results here were consistent across two repeated experiments, with the second pass having a more substantial n per group. The mRFP signal that is observed is not due to autofluorescence (any autofluorescent signal gets quenched due to the protease reagents in FISH protocol), but rather RNAscope mRFP probes detecting mRFP transcripts and that signal then being amplified. The inserts in the p16 panels show the merge of the 3 signals on one representative nucleus. Scale bars represent 30μm.
Figure 1.
Figure 1.. Effect of Chronic Subordination Stress (CSS) or Chronic Restraint Stress (CRS) on senescent cells (SNCs) markers and senescence associated secretory phenotype (SASP) in peripheral blood mononuclear cells (PBMCs) and peripheral organs.
A) Experimental design/timeline. B) Relative p16Ink4a mRNA transcript abundance over time. CSS-exposed mice have a significant increase in p16Ink4a expression over the course of the stress experiment. 2-way repeated measures mixed effects model (REML). Group: p=0.035, Time: p=0.093, Group x Time: p=0.845 Tukey post hoc. Main effect of group p=0.035. control (ctrl) N=6; CSS N=11; CRS N=6 C) Relative p16Ink4a transcript abundance in PBMCs) at 20 months of age. CSS-exposed mice have significantly higher p16Ink4a expression relative to singly housed controls (p<0.0001). Unpaired 2-sided t test. Ctrl N=12; CSS N=15 D) Relative p16Ink4a transcript abundance in PBMCs at 26 months of age. CSS-exposed mice have significantly higher p16Ink4a expression relative to singly housed controls (p<0.0001). Unpaired 2-sided t test. Ctrl N=8; CSS N= 4. E) PBMC p16Ink4a expression in mice surviving to 26 months of age. CSS-exposed mice have a significant increase in p16Ink4a expression in this time frame (p<0.0001) while control mice do not. 2-way repeated measures ANOVA Group: p<0.0001, Time: p=0.0002, Group x Time: p=0.0003. Sidak’s multiple comparisons test. Ctrl N=8; CSS N=4. Data points represent group mean. Error bars represent standard error of the mean (SEM).
Figure 2.
Figure 2.. Effect of Chronic Subordination Stress (CSS) or Chronic Restraint Stress (CRS) on senescent cells (SNCs) markers and senescence associated secretory phenotype (SASP) in the hippocampus and cortex.
A) Illustration of experimental design. B) There is a significant correlation between p16Ink4a and mRFP expression across all samples and tissues analyzed. Spearman correlation coefficient r=0.68, p<0.0001. C) Expression of senescence and SASP genes in the hippocampus of control and CSS-exposed mice in the presence or absence of ganciclovir (GCV). D) Expression of senescence and SASP genes in the hippocampus of control and CRS-exposed mice in the presence or absence of ganciclovir (GCV). E) Expression of senescence and SASP genes in the cortex of control and CSS-exposed mice in the presence or absence of ganciclovir (GCV). F) Expression of senescence and SASP genes in the cortex of control and restraint-exposed mice in the presence or absence of ganciclovir (GCV). For statistical details C-F, see Supplementary Table 2. G) There is a significant correlation between p16Ink4a and p21Cip1 expression in the hippocampus of CSS-exposed mice. Pearson’s correlation coefficient R=0.74, p<0.0001). H) There is not a significant correlation between p16Ink4a and p21Cip1 transcript levels in the hippocampus of CRS exposed mice. Pearson’s correlation coefficient R=−0.62. p= 0.3979. Ctrl+veh N=6; ctrl+GCV N=5; CSS+veh N=14; CSS+GCV N=11; CRS+veh N=9; CRS+GCV N=5. * indicates p<0.05, ** indicates p<0.01 *** indicates p<0.001. Histogram bars and X/Y data points represent group mean. Shaded areas represent GCV treatment groups. Error bars represent standard error of the mean (SEM).
Figure 3.
Figure 3.. Quantitative and qualitative identification of p16/p21 positive cells using in situ hybridization.
A) Number of p16 positive cells / total cells in the hippocampus. B) Number of p21 positive cells / total cells in the hippocampus. C) Number of p16/p21 double positive cells / total cells in the hippocampus. D) Number of p16 positive cells / total cells in the cortex. E) Number of p21 positive cells / total cells in the cortex. F) Number of p16/p21 double positive cells / total cells in the cortex. A-F: ctrl+veh N=3; CSS+veh N=4; CSS+GCV N=4 per group. 10000–15000 total cells were observed per mouse (7000–11000 cells in hippocampus; 2500–3500 cells in cortex). A-F were analyzed with 1-way ANOVA followed by Tukey multiple comparisons test. * indicates p<0.05, ** indicates p<0.01. Histogram bars represent group mean. Error bars represent standard error. G) Representative images of fluorescent in situ hybridization labeling of p16, p21, Rbfox3, Aldh1l1, Tmem119, and Cspg4. Scale bars represent 50μm. Representative images of fluorescent in situ hybridization labeling mRFP colocalized with p16, and p21 are presented in Extended Data Figure 10. This experiment was repeated twice with similar results. I) Number of p16 positive cells of each cell type/total number of cells in those images in the hippocampus. J) Number of p21 positive cells of each cell type/total number of cells in those images in the hippocampus. K) Number of p16 and p21 double positive cells of each cell type/total number of cells in those images in the hippocampus. L) Number of p16 positive cells of each cell type/total number of cells in those images in the cortex. G) Percentage breakdown of p21 positive cell types across all those images in the cortex. M) Number of p21 positive cells of each cell type/total number of cells in those images in the cortex. N) Number of p16 and p21 double positive cells of each cell type/total number of cells in those images in the cortex. 10000–15000 total cells were observed per mouse (7000–11000 cells in hippocampus; 2500–3500 cells in cortex). I-N: N=2 per group. Shaded bars represent GCV treatment. Error bars represent standard error of the mean (SEM). Scale bars represent 50μm.
Figure 4.
Figure 4.. Chronic Subordination Stress (CSS) increases the accumulation of p16-positive neurons in the brain.
A) Illustration of generation of p16CreERT2;Ai14 mouse line and experimental design. B) Representative images of tdTomato/NeuN positive cells, in which the staining was repeated three times with consistent results. C) Illustration of sampling method used to quantify abundance of tdTomato positive cells D) CSS-exposed mice have significantly more tdTomato/NeuN positive cells in the brain than control mice; Two-tailed, unpaired t test, p=0.0178. ctrl N=5; CSS N=5. * indicates p<0.05. Histogram bars represent group mean. Error bars represent standard error of the mean (SEM). Scale bars represent 30μm.
Figure 5.
Figure 5.. Transcriptomic profiling of Chronic Subordination Stress (CSS)-induced SNCs and their microenvironment.
A) Representative image of p16 transcript labeling and AOI selection for spatial transcriptomic profiling. B) Representative image showing area of interest (AOI) selection and p16 expression in ctrl and CSS p16 high and p16 low AOIs. Scale bars represent 50μm unless otherwise specified. C) Successful separation between p16 low and p16 high AOIs. CSS-exposed mice had significantly more p16+ cells in p16 high AOIs than ctrl p=0.0366. No significant differences between ctrl and CSS mice in p16 low AOIs p=0.9160. 2-way ANOVA. p16 status: p<0.0001. Group: p=0.1575. Interaction: p=0.0538. Tukey post hoc. No significant interaction (p=0.0538. Histogram bars represent group mean. Error bars represent standard error. Ctrl N=4; CSS N=6; 8 AOIs per mouse. Data points represent individual AOIs. D) Venn diagram illustrating overlapping differential gene expression in the hippocampus between p16 high regions in CSS mice, and with CSS in p16 high AOIs. Yellow and blue sectors illustrate the groups being compared on each set of the Venn diagram. 2-sided unpaired t tests; permutation q corrected. Statistical cutoff p<0.01. E) Venn diagram illustrating overlapping differential gene expression in the hippocampus between p16 high regions in CSS mice, and with CSS in p16 high AOIs. Yellow and blue sectors illustrate the groups being compared on each set of the Venn diagram. 2-sided unpaired t tests; permutation q corrected. Statistical cutoff p<0.01. F) Venn diagram showing pathways up/downregulated with p16 high and CSS conditions. G) Heat map showing significantly enriched senescence/SASP-related pathways associated with both CSS and p16 high. Gene set enrichment analysis (GSEA). p<0.01. Ctrl N=4; CSS N=6. Permutation q multiple testing correction. * indicates p<0.05. Histogram bars represent group mean. Shaded bars represent GCV treatment. Error bars represent standard error of the mean (SEM). Scale bars represent 1mm.
Figure 6.
Figure 6.. Chronic Subordination Stress (CSS) induces DNA damage in the hippocampus and cortex.
A) Representative images showing γH2AX (red), NeuN (green), and DAPI (grey). Two-tailed, unpaired t-tests showed that CSS caused a significant increase in γH2AX staining in the hippocampus (CA3, t=7.311, df=8, p<0.0001) and somatosensory cortex (t=4.028, df=8, p=0.004). Only NeuN+ neurons but no other cell types shown in DAPI are stained with γH2AX. Ctrl, N=4. CSS, N=6, B) CSS increased DNA damage as indicated by tail and olive moment in the comet assay in the somatosensory cortex (ssCTX), and was normalized by ganciclovir (GCV) treatment. Tail moment, F (2,9) = 11.53, P=0.0033; Olive moment, F (2,9) = 10.28, P=0.0047. N=4 per group. * indicates p<0.05, ** indicates p<0.01, *** indicates p<0.0001. Histogram bars represent group mean. Error bars represent standard error of the mean (SEM). Scale bars represent 30μm.

References

    1. Yuede CM et al. Interactions between stress and physical activity on Alzheimer’s disease pathology. Neurobiology of Stress 8, 158–171 (2018). - PMC - PubMed
    1. Hemmerle AM, Herman JP & Seroogy KB Stress, depression and Parkinson’s disease. Experimental Neurology 233, 79–86 (2012). - PMC - PubMed
    1. Gu HF, Tang CK & Yang YZ Psychological stress, immune response, and atherosclerosis. Atherosclerosis 223, 69–77 (2012). - PubMed
    1. Harris ML et al. Stress increases the risk of type 2 diabetes onset in women: A 12-year longitudinal study using causal modelling. PLoS ONE 12, (2017). - PMC - PubMed
    1. Kivimäki M, Bartolomucci A & Kawachi I The multiple roles of life stress in metabolic disorders. Nature Reviews Endocrinology 2022 19:1 19, 10–27 (2022). - PMC - PubMed

Publication types

Substances