. 2024 Dec;43(24):6679-6704.
doi: 10.1038/s44318-024-00284-1. Epub 2024 Nov 11.

Glutamylation imbalance impairs the molecular architecture of the photoreceptor cilium

Affiliations

Glutamylation imbalance impairs the molecular architecture of the photoreceptor cilium

Olivier Mercey et al. EMBO J. 2024 Dec.

Abstract

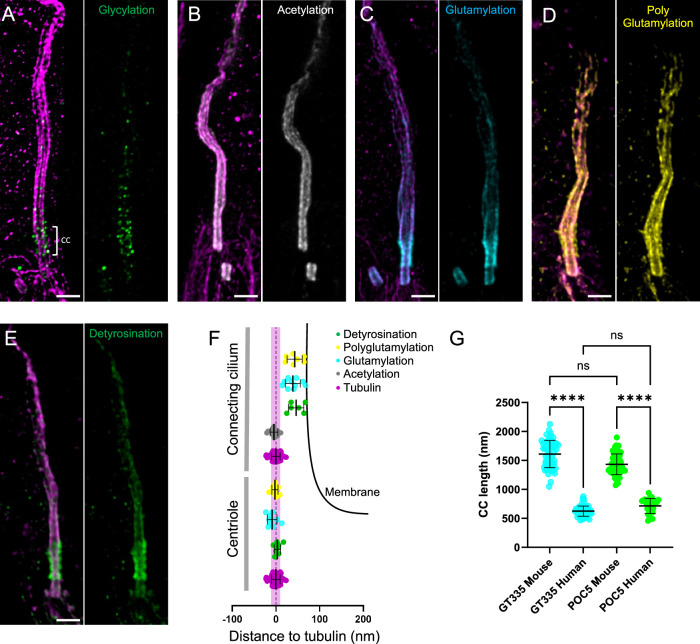
Microtubules, composed of conserved α/β-tubulin dimers, undergo complex post-translational modifications (PTMs) that fine-tune their properties and interactions with other proteins. Cilia exhibit several tubulin PTMs, such as polyglutamylation, polyglycylation, detyrosination, and acetylation, with functions that are not fully understood. Mutations in AGBL5, which encodes the deglutamylating enzyme CCP5, have been linked to retinitis pigmentosa, suggesting that altered polyglutamylation may cause photoreceptor cell degeneration, though the underlying mechanisms are unclear. Using super-resolution ultrastructure expansion microscopy (U-ExM) in mouse and human photoreceptor cells, we observed that most tubulin PTMs accumulate at the connecting cilium that links outer and inner photoreceptor segments. Mouse models with increased glutamylation (Ccp5-/- and Ccp1-/-) or loss of tubulin acetylation (Atat1-/-) showed that aberrant glutamylation, but not acetylation loss, disrupts outer segment architecture. This disruption includes exacerbation of the connecting cilium, loss of the bulge region, and destabilization of the distal axoneme. Additionally, we found significant impairment in tubulin glycylation, as well as reduced levels of intraflagellar transport proteins and of retinitis pigmentosa-associated protein RPGR. Our findings indicate that proper glutamylation levels are crucial for maintaining the molecular architecture of the photoreceptor cilium.

Keywords: Expansion Microscopy; Glutamylation; Photoreceptor Cell Cilium; Post-translational Modifications; Retinitis Pigmentosa.


Conflict of interest statement

Disclosure and competing interests statement. The authors declare no competing interests.

Figures

Figure 1
Figure 1. Molecular mapping of tubulin PTMs in mouse photoreceptor cells.
(AE) Confocal images of expanded mouse photoreceptor cells stained with tubulin and (A) glycylation (TAP952, green), (B) acetylation Tubulin (gray), (C) glutamylation (GT335, cyan), (D) polyglutamylation (PolyE, yellow) or (E) detyrosination (green). Scale bar: 500 nm. Transversal section images corresponding to different regions of the OS (centriole, connecting cilium and bulge depicted by the dashed lines and numbers on longitudinal images) are represented on the right side. Scale bar: 200 nm. (F) Schematic representation of the outer segment centriole and connecting cilium on which measured distances to tubulin of different proteins are represented. Membrane is depicted as a black line. Width of a microtubule (20 nm) is depicted in magenta as a reference. Glutamylation (centriole): −1.21 nm +/− 18.61 (n = 33; N = 3 animals); polyglutamylation (centriole): 5.66 nm +/− 10.91 (n = 10; N = 1 animal); detyrosination (centriole): 4.92 nm +/− 14.07 (n = 33; N = 2 animals); glycylation (CC): −0.57 nm +/− 12.45 (n = 50; N = 3 animals); acetylation (CC): −0.93 nm +/− 12.30 (n = 37; N = 2 animals); glutamylation (CC): 56.42 nm +/− 18.90 (n = 47; N = 3 animals); polyglutamylation (CC): 63.5 nm +/− 39.01 (n = 35; N = 3 animals); detyrosination (CC): 51.98 nm +/− 26.94 (n = 27; N = 2 animals) (mean +/− SD). Tubulin is used as a reference: 0 nm +/− 12 (n = 304; N > 10 animals). (G) Developing photoreceptor OS at P10, P14 and P22 stained for glutamylation (GT335, cyan) and tubulin (magenta). Insets represent the regions where GT335 and tubulin signal width were highlighted in (H) and quantified in (I). White arrow indicates a gap of glutamylation between the centriole and the CC. Scale bar: 500 nm. (H) zoom in images from (G) highlighting the increase of glutamylation width at the CC between P10 and P22. Scale bar: 200 nm. (I) Quantification of GT335 signal width during OS development (P10 to P22) and normalized to tubulin width. P10: 1.09 + /− 0.17 (n = 51; N = 2 animals); P14: 1.20 + /− 0.13 (n = 37; N = 2 animals); 1.36 + /− 0.11 (n = 43; N = 2 animals) (mean +/− SD). Test: Kruskal–Wallis with Dunn’s multiple comparison. P10 vs. P14: ns (adjusted P value: 0.0535); P14 vs. P22: ****(adjusted P value: <0.0001). P10 vs. P22: ****(adjusted P value: <0.0001). Each animal corresponds to one experimental replicate. Source data are available online for this figure.
Figure 2
Figure 2. Molecular mapping of tubulin PTMs in human photoreceptor cells.
(AE) Confocal images of expanded photoreceptor cells stained for tubulin (magenta) and (A) glycylation (TAP952, green), (B) acetylation (gray), (C) glutamylation (GT335, cyan), (D) polyglutamylation (PolyE, yellow) or (E) detyrosination tubulin (green). Scale bar: 500 nm. (F) Schematic representation of the outer segment centriole and connecting cilium on which measured distances to tubulin of different proteins are represented. Detyrosination (centriole): 3.73 nm +/− 7.29 (n = 8); glutamylation (centriole): −8.60 nm +/− 11.16 (n = 9); polyglutamylation (centriole): −2.03 nm +/− 7.12 (n = 10); acetylation (CC): −4.41 nm +/− 9.03 (n = 12); detyrosination (CC): 47.15 nm +/− 17.70 (n = 6); glutamylation (CC): 39.25 nm +/− 17.44 (n = 10); polyglutamylation (CC): 43.78 nm +/− 17.68 (n = 7) (mean +/− SD). Tubulin is used as a reference: 0 nm +/− 9.76 (n = 62) (mean +/− SD). Membrane is depicted as a black line. Width of a microtubule (20 nm) is depicted in magenta as a reference. (G) Comparison of mouse and human CC length using GT335 and POC5 as markers. GT335 (mouse): 1610 nm +/− 235 (n = 57; N = 3 animals); GT335 (human): 623 nm +/− 87 (n = 60); POC5 (mouse): 1433 nm +/− 179 (n = 55; N = 3 animals); POC5 (human): 714 nm +/− 130 (n = 28) (mean +/− SD). Test: Kruskal–Wallis with Dunn’s multiple comparison. GT335 mouse vs. GT335 human: ****(adjusted P value: <0.0001); GT335 mouse vs. POC5 mouse: ns (adjusted P value: 0.0810); POC5 mouse vs. POC5 human: ****(adjusted P value: <0.0001); GT335 human vs. POC5 human: ns (adjusted P value: 0.6299). Human sample replicate: N = 1. Each animal corresponds to one experimental replicate. Source data are available online for this figure.
Figure 3
Figure 3. Deglutamylase mutants lead to retinal degeneration with photoreceptor axonemal disorganization.
(AD) Expanded retina at low magnification stained for tubulin (magenta) and rhodopsin (green) in WT (A), Ccp5−/− (B), Ccp1/− (C) or Atat1−/− (D) mice. On the right, the rhodopsin channel alone highlights the presence of the mislocalized signal in the ONL in the degenerating retina (white arrows and insets). The thickness of the Outer Nuclear Layer (ONL) is depicted with white double arrows. Scale bar: 20 µm. (E) Measurements of the ONL thickness in the different conditions, corrected by the expansion factor. WT: 58.47 nm +/− 9.15 (n = 21; N = 3 animals); Ccp1−/: 21.36 nm +/− 2.76 (n = 12; N = 2 animals); Ccp5−/: 11.65 nm +/− 3.27 (n = 12; N = 2 animals); Atat1−/−: 52.31 nm +/− 10.54 (n = 21; N = 3 animals) (mean +/− SD). Test: Kruskal–Wallis with Dunn’s multiple comparison. WT vs. Atat1−/−: ns (adjusted P value: 0.9684); WT vs. Ccp1-/-: ****(adjusted P value: <0.0001); WT vs. Ccp5−/−: ****(adjusted P value: <0.0001). (FI) Expanded photoreceptor cells stained with tubulin (magenta) highlighting the axonemal structure in WT (F), Ccp5−/− (G), Ccp1−/ (H) or Atat1−/− (I). Scale bar: 5 µm. Insets depicted with dashed lines are represented on the right. Scale bar: 500 nm. (J) EM micrograph of a 10-month-old Ccp5−/− photoreceptor outer segment revealing mostly intact CC, whereas the distal part of the cilium is highly impaired. Scale bar: 500 nm. (K) Percentage of individual photoreceptor cells with normal or abnormal axonemal structures. WT: normal: 98.89%, abnormal: 1.11% (n = 180; N = 6 animals); Ccp5−/−: normal: 9.84%, abnormal: 90.16% (n = 53; N = 2 animals); Ccp1−/−: normal: 15.1%, abnormal: 84.9% (n = 61; N = 2 animals); Atat1−/−: normal: 95.5%, abnormal: 4.5% (n = 89; N = 2 animals) CC: Connecting Cilium; B: Bulge; OM: Open microtubules. White arrowheads show open microtubules in low magnification images. Each animal corresponds to one experimental replicate. Source data are available online for this figure.
Figure 4
Figure 4. Deglutamylase mutants cause imbalance in PTMs paralleled with defects in outer segment structure and transport.
(AF) Expanded photoreceptor outer segments observed in WT, Ccp5/−, Ccp1/− or Atat1/− and stained with GT335 (cyan) (A), Acetylated tubulin (orange) (B), TAP952 (green) (C), POC5 (yellow) (D), LCA5 (gray) (E), and IFT88 (gray) (F). White double arrows depict the length of the signal measured in (G, H, J). Rectangles with dashed lines show the area where intensity measurements were picked in (K) and (L). White arrowheads show the dual localization of IFT at the bulge and at the cilium entry. Scale bar: 500 nm. (G) GT335 intense signal length corrected by the EF. WT: 1546 nm +/− 212.8 (n = 30; N = 2 animals); Ccp5/−: 5209 nm +/− 2260 (n = 24; N = 2 animals); Ccp1−/−: 2378 nm +/− 814.2 (n = 31; N = 2 animals); Atat1-/-: 1594 nm +/− 166.1 (n = 37; N = 2 animals), (mean +/−SD). Test: Kruskal–Wallis with Dunn’s multiple comparison. WT vs. Ccp5/−: ****(adjusted P value: <0.0001); WT vs. Ccp1/−: ****(adjusted P value: <0.0001); WT vs. Atat1-/-: ns (Adjusted P value: >0.9999). (H). Acetylated tubulin signal length in the outer segment corrected by the EF. WT: 2795 nm +/− 729.4 (n = 43; N = 2 animals); Ccp5−/−: 6337 nm +/− 1645 (n = 18; N = 2 animals); Ccp1-/-: 3365 nm +/− 1463 (n = 15; N = 1 animal), (mean +/−SD). Test: Kruskal–Wallis with Dunn’s multiple comparison. WT vs. Ccp5/−: ****(adjusted P value: <0.0001); WT vs. Ccp1−/−: ns (adjusted P value: 0.1085). (I) Intensity measurement of TAP952 signal along the outer segment CC normalized on background. WT: 3.16 nm +/− 1.03 (n = 47; N = 3 animals); Ccp5/: 1.30 + /- 0.29 (n = 34; N = 3 animals); Ccp1−/: 2.54 + /− 1.01 (n = 16; 2 animals); Atat1−/−: 1.90 + /− 0.53 (n = 37; 2 animals), (mean +/−SD). Test: Kruskal–Wallis with Dunn’s multiple comparison. WT vs. Ccp5−/−: ****(adjusted P value: <0.0001); WT vs. Ccp1−/−: ns (adjusted P value: 0.2646); WT vs. Atat1−/−: ****(adjusted P value: <0.0001). (J) CC length measured with POC5 and corrected by the EF. WT: 1433 nm +/− 179 (n = 55; N = 3 animals); Ccp5−/−: 2864 nm +/− 1164 (n = 36; N = 2 animals); Ccp1−/−: 1458 nm +/− 498 (n = 59; N = 2 animals); Atat1/: 1512 nm +/− 167 (n = 56; N = 3 animals), (mean +/−SD). Test: Kruskal–Wallis with Dunn’s multiple comparison. WT vs. Ccp5/−: ****(adjusted P value: <0.0001); WT vs. Ccp1/−: ns (adjusted P value: 0.5965); WT vs. Atat1/−: ns (Adjusted P value: 0.2385). WT measurements are identical to Fig. 2G. (K) LCA5 intensity at the bulge normalized on background. WT: 1.53 + /− 0.27 (n = 35; N = 3 animals); Ccp5−/−: 1.17 + /− 0.21 (n = 20; N = 2 animals); Ccp1−/−: 1.11 + /− 0.13 (n = 31; N = 2 animals); Atat1−/−: 1.69 + /− 0.66 (n = 33; N = 3 animals), (mean +/−SD). Test: Kruskal–Wallis with Dunn’s multiple comparison. WT vs. Ccp5−/−: ****(adjusted P value: <0.0001); WT vs. Ccp1−/−: ****(adjusted P value: <0.0001); WT vs. Atat1−/−: ns (adjusted P value: >0.9999). (L) IFT88 intensity at the cilium base normalized on background. WT: 1.79 + /− 0.36 (n = 46; N = 3 animals); Ccp5-/-: 1.18 + /− 0.15 (n = 25; N = 2 animals); Ccp1−/−: 1.44 + /− 0.48 (n = 25; N = 2 animals); Atat1−/−: 1.70 + /− 0.36 (n = 32; N = 2 animals), (mean +/− SD). Test: Kruskal–Wallis with Dunn’s multiple comparison. WT vs. Ccp5−/−: ****(adjusted P value: <0.0001); WT vs. Ccp1−/: ****(adjusted P value: <0.0001); WT vs. Atat1−/−: ns (adjusted P value: 0.5772). Each animal corresponds to one experimental replicate. Source data are available online for this figure.
Figure 5
Figure 5. Dynamic of photoreceptor cell degeneration in CCP5−/− mice.
(AD) Overview of photoreceptor cell progressive loss in expanded retina of 3 months- (A), 7 months- (B), 10 months- (C), 12 months- (D) old Ccp5−/− mice stained with rhodopsin (green) and tubulin (magenta). Scale bar: 10 µm. For each time point, a representative image of the rhodopsin channel alone is shown in the middle with an inset and a single photoreceptor cell is depicted on the right. White double arrows reveal the thickness of the ONL measured in (E). White arrows show the rhodopsin signal at the level of the nuclei. White arrowheads show floating rhodopsin signal outside of the outer segment. Scale bar: 500 nm. CC: connecting cilium, B: Bulge. (E) ONL thickness measurement and compared to WT (gray line). Ccp5−/− 3 M: 49.0 nm +/− 1.1 (n = 3; N = 1); Ccp5−/− 7 M: 29.4 nm +/− 3.3 (n = 18; N = 2 animals); Ccp5−/− 10 M: 16.2 nm +/− 3.9 (n = 18; N = 2 animals); Ccp5−/− 12 M: 14.1 nm +/− 4.5 (n = 18; N = 2 animals) (mean +/− SD). Test: Kruskal–Wallis with Dunn’s multiple comparison. WT vs. 3 M: ns (adjusted P value: >0.9999); WT vs. 7 M: **(adjusted P value: <0.0099); WT vs. 10 M: ****(adjusted P value: <0.0001); WT vs. 12 M: ****(adjusted P value: <0.0001). (F, G) Single cell expanded photoreceptor cells of 3 months-, 7 months-, 10 months-, 12 months-old Ccp5−/− mice revealing progressive defects of the outer segment using TAP952 (green) (F), GT335 (cyan) (G) staining. White double arrows depict the length of the signal measured for GT335. Red and white arrowheads point to curled and broken axonemes, respectively. Scale bar: 500 nm. (H) Intensity measurement of TAP952 signal along the outer segment CC normalized on background. Ccp5−/ 3 M: 1.66 + /− 0.63 (n = 36; N = 2 animals); Ccp5−/− 7 M: 1.58 + /− 0.43 (n = 34; N = 2 animals); Ccp5−/− 10 M: 1.38 + /− 0.30 (n = 27; N = 1 animal); Ccp5−/− 12 M: 1.30 + /− 0.29 (n = 34; N = 2 animals) (mean +/−SD). For each measurement, WT baseline is depicted with a gray line. Measurements were compared to WT values obtained in Fig. 4, and 12-month-old measurements are the same as in Fig. 4. Test: Kruskal–Wallis with Dunn’s multiple comparison. WT vs. 3 M: ****(adjusted P value: <0.0001); WT vs. 7 M: ****(adjusted P value: <0.0001); WT vs. 10 M: ****(adjusted P value: <0.0001); WT vs. 12 M: ****(adjusted P value: <0.0001). (I) GT335 intense signal length corrected by the EF. Ccp5−/ 3 M: 2206 nm +/− 374 (n = 41; N = 2 animals); Ccp5−/− 7 M: 4355 nm +/− 1990 (n = 28; N = 2 animals); Ccp5−/− 10 M: 4678 nm +/− 903 (n = 20; N = 2 animals); Ccp5−/− 12 M: 4640 nm +/− 1357 (n = 16; N = 2 animals) (mean +/− SD). For each measurement, WT baseline is depicted with a gray line. Measurements were compared to WT values obtained in Fig. 4, and 12-month-old measurements are the same as in Fig. 4. Test: Kruskal–Wallis with Dunn’s multiple comparison. WT vs. 3 M: **(adjusted P value: 0.0011); WT vs. 7 M: ****(adjusted P value: <0.0001); WT vs. 10 M: ****(adjusted P value: <0.0001); WT vs. 12 M: ****(adjusted P value: <0.0001). (J, K) 18-month-old WT (J) or 12-month-old Ccp5/− (K) expanded photoreceptor cell stained for glutamylation (GT335, cyan) and tubulin (magenta). White rectangles with dashed lines depict the representative regions used for GT335 intensity measurement in the distal cilium displayed in (L). Red rectangles with dashed lines show the localization of GT335 signal width measurements highlighted in (M) and quantified in (N) Scale bar: 500 nm. (L) Intensity measurement of GT335 in the distal cilium between 18-month-old WT and 12-month-old Ccp5−/− mice normalized on background. WT: 2.70 + /− 1.33 (n = 34; N = 3); Ccp5−/−: 4.16 + /− 1.90 (n = 36; N = 2) (mean +/− SD). Test: Two-tailed Mann–Whitney test. WT vs. Ccp5−/−: ***(adjusted P value: 0.0003). (M) Representative images of GT335 (cyan) signal width at the level of the CC compared to tubulin (magenta). Scale bar: 200 nm. (N). Quantification of GT335 signal width at the CC in 18-month-old WT and 12-month-old Ccp5−/− mice photoreceptor cells normalized on tubulin width. WT: 1.25 + /− 0.11 (n = 29; N = 2 animals); Ccp5/−: 1.01 + /− 0.15 (n = 39; N = 2 animals) (mean +/−SD). Test: Two-tailed Mann–Whitney test. WT vs. Ccp5/−: ****(adjusted P value: <0.0001). (O, P) 18-month-old WT (O) or 12-month-old Ccp5/− (P) expanded photoreceptor cells stained for RPGR (green) and tubulin (magenta). Scale bar: 500 nm. (Q) Quantification of RPGR intensity in adult WT, 7- or 12-month-old Ccp5−/− photoreceptor CC. WT: 1.63 + /− 0.37 (n = 49; N = 3 animals); Ccp5/− 7 months: 1.51 + /− 0.26 (n = 41; N = 2 animals); Ccp5−/− 12 months: 1.40 + /− 0.36 (n = 34; N = 2 animals) (mean +/− SD). Test: Kruskal–Wallis with Dunn’s multiple comparison. WT vs. Ccp5−/− 7 months: ns (adjusted P value: 0.4386); WT vs. Ccp5/− 12 months: *(adjusted P value: 0.0124). (R) Expanded human photoreceptor cell stained for RPGR (green) and tubulin (magenta). Scale bar: 500 nm. (S) Quantification of GT335 and RPGR signal distances to tubulin in human photoreceptor CC. GT335: 39.25 nm +/− 17.44 (n = 10; N = 1); RPGR: 25.37 nm +/− 5.97 (n = 15; N = 1) (mean +/− SD). Each animal corresponds to one experimental replicate. Source data are available online for this figure.
Figure 6
Figure 6. Connecting cilium exacerbation and IFT transport defects in CCP5 −/− mice.
(A, B) Single cell expanded photoreceptor cells of 3 months, 7 months-, 10 months-, 12 months-old Ccp5−/− mice highlighting CC (POC5, yellow) (A), and IFT (IFT88, white) defects. White double arrows depict the length of the signal measured for POC5. Red and white arrowheads point to curled and broken axonemes, respectively. Rectangles with dashed lines show the area where intensity measurements were picked with IFT88 signal. Scale bar: 500 nm. (C) CC length measured with POC5 and corrected by the EF. Ccp5−/− 3 M: 1446.0 nm +/− 241 (n = 61; N = 2 animals); Ccp5−/ 7 M: 2100 nm +/− 609 (n = 38; N = 1 animal); Ccp5−/− 10 M: 2779 nm +/− 1076 (n = 31; N = 1 animal); Ccp5/− 12 M: 2864 nm +/− 1164 (n = 36; N = 2 animals) (mean +/−SD). Test: Kruskal–Wallis with Dunn’s multiple comparison. WT vs. 3 M: ns (adjusted P value: >0.9999); WT vs. 7 M: ****(adjusted P value: <0.0001); WT vs. 10 M: ****(adjusted P value: <0.0001); WT vs. 12 M: ****(adjusted P value: <0.0001). For each measurement, WT baseline is depicted with a gray line. Measurements were compared to WT values obtained in Fig. 4, and 12 month-old measurements are the same as in Fig. 4. (D) IFT88 intensity at the ciliary base normalized on background. Ccp5-/- 3 M: 1.80 + /− 0.42 (n = 44; N = 2 animals); Ccp5−/− 7 M: 1.36 + /− 0.24 (n = 22; N = 2 animals); Ccp5-/- 10 M: 1.17 + /− 0.23 (n = 12; N = 1 animal); Ccp5−/ 12 M: 1.18 + /− 0.15 (n = 25; N = 2 animals) (mean +/−SD). Test: Kruskal–Wallis with Dunn’s multiple comparison. WT vs. 3 M: ns (adjusted P value: >0.9999); WT vs. 7 M: ***(adjusted P value: 0.0004); WT vs. 10 M: ****(adjusted P value: <0.0001); WT vs. 12 M: ****(adjusted P value: <0.0001). For each measurement, WT baseline is depicted with a gray line. Measurements were compared to WT values obtained in Fig. 4, and 12 month-old measurements are the same as in Fig. 4. (E) 18-month-old WT or 12-month-old Ccp5/ expanded photoreceptor cell stained for CEP290 (green) and tubulin (magenta). Scale bar: 500 nm. (F) CEP290 signal length in 18-month-old WT or 12-month-old Ccp5−/− photoreceptor cell OS corrected by the EF. WT: 1534 nm +/− 230 (n = 46; N = 2 animals); Ccp5/−: 2334 nm +/− 792 (n = 41; N = 2 animals) (mean +/− SD). Test: Two-tailed Mann–Whitney test. WT vs. Ccp5−/−: ****(adjusted P value: <0.0001). (G) EM micrographs representing transverse sections of the CC in 7-month-old WT or Ccp5−/ photoreceptor cells. Blue and orange arrowheads show the presence of Y-links, the inner scaffold, respectively. The two micrographs are also represented in the gallery in Fig. EV4. Scale bar: 200 nm. (H) On the left, EM image showing a longitudinal view of a 10-month-old Ccp5-/- photoreceptor outer segment. Black double arrow shows the length between the beginning of the CC and the last Y-link structure observed. An inset of the rectangle with dashed lines is represented on the right to highlight the presence and the periodicity of the Y-links. Average distance between consecutive Y-links is 36,9 nm. Scale bar: 500 nm. (I) 18-month-old WT or 12-month-old Ccp5−/ expanded photoreceptor cell stained for MAP9 (green) and tubulin (magenta). Scale bar: 500 nm. (J) MAP9 signal length in 18-month-old WT or 12-month-old Ccp5/− photoreceptor cell OS corrected by the EF. WT: 1407 nm +/− 235 (n = 68; N = 3 animals); Ccp5/: 2221 nm +/− 956 (n = 49; N = 2 animals) (mean +/− SD). Test: Two-tailed Mann–Whitney test. WT vs. Ccp5−/−: ****(adjusted P value: <0.0001). (K, L) EM micrograph of 7-month-old WT (K) or Ccp5/− (L) outer segment. An inset highlighting the difference of the axonemes is depicted on the upper right of the image. Blue or orange arrowheads show the presence of Y-links or the inner scaffold, respectively. Note the unstructured organization of the membrane discs in the mutant compared to the WT. Scale bar: 500 nm. (M) Model summarizing the defects observed in a Ccp5−/− photoreceptor cell outer segment compared to WT. Loss of CCP5 leads to hyperglutamylation (cyan) that propagates towards the distal part of the cilium. This is accompanied by the loss of RPGR (orange), the bulge region delineated by LCA5 (gray), the elongation of the CC marked with POC5 (yellow) and Y-links (magenta), and IFT defects (green). Consequently, the distal part of the axoneme is disorganized. Each animal corresponds to one experimental replicate. Source data are available online for this figure.
Figure EV1
Figure EV1. Architecture of the photoreceptor outer segment.
(A) Expanded photoreceptor cell layer of a WT mouse retina stained for tubulin (magenta) and rhodopsin (green). On the right, inset of a single photoreceptor cell outer segment stained for tubulin, revealing the different regions of the cilium. Scale bars: left: 10 µm; right: 500 nm. (B) Quantification of the expansion factor (EF) used for the whole study. EF = 4.248 + /− 0.588 (mean +/− SD) (n = 55; N > 5 animals). (C) Model explaining the tubulin code and highlighting the PTMs analyzed in this study. (D) 18-month-old WT expanded photoreceptor cell stained for glutamylation (GT335, cyan) and tubulin (magenta) highlighting differences in GT335 staining along the OS. Scale bar: 500 nm. (E) Zoom in on the 3 different OS subregions of GT335 staining analyzed (Centriole, CC, Bulge). Scale bar: 200 nm. (F) Quantification of GT335 signal intensity in the centriole, the CC and the bulge region, normalized on background. Centriole: 5.55 + /− 3.61 (n = 38); CC: 15.12 + /− 12.67 (n = 39); Bulge: 8.08 + /− 6.00 (n = 39) (N = 3 animals) (mean +/− SD). Test: Kruskal–Wallis with Dunn’s multiple comparison. centriole vs. CC: ****(adjusted P value: <0.0001); centriole vs. bulge: ns (adjusted P value: 0.3331); CC vs. bulge: *(adjusted P value: 0.0272). Each animal corresponds to one experimental replicate.
Figure EV2
Figure EV2. Global morphology of WT and Ccp5−/− retinas.
(A) Expanded WT mouse retina stained for tubulin (magenta) and DAPI (cyan). Note that ONL thickness can be measured only with tubulin staining, where nuclei position is clearly visible. Scale bar: 50 µm. (B) EM micrographs of 7-month-old WT or Ccp5−/− retinas at low magnification to highlight defects in the organization of the membrane discs together with an important decrease in the number of cells (quantified on the top right). Scale bar: 5 µm. (C) 12-month-old WT (left) and Ccp5−/− (right) retinas during dissection. Note that Ccp5−/− retina is thinner and pigmented, reflecting a strong degeneration, a feature that we already observed previously (Faber et al, 2023). Scale bar: 1 mm.
Figure EV3
Figure EV3. Glutamylation level observed in several PTM mutants.
Large field of view of WT, Atat1−/−, Ccp1−/− and Ccp5−/− expanded photoreceptor cell stained with GT335 (cyan) and tubulin (magenta). Note the intense glutamylation signal inside photoreceptor cell bodies in Ccp5−/− retina. Scale bar: 5 µm.
Figure EV4
Figure EV4. EM gallery of 7-month-old WT and Ccp5−/− photoreceptor CC.
EM micrographs of 7-month-old WT and Ccp5−/− photoreceptor CC observed in transverse sections. White arrowheads highlight open B-tubules. Asterix depicts missing MTD. Cyan and orange arrowheads show Y-links and inner scaffold, respectively. The two images with black border are the ones used in the Fig. 6. Scale bar: 200 nm.
Figure EV5
Figure EV5. Hyperglutamylation of the OS in Lca5gt/gt photoreceptor cells.
Expanded P18 Lca5−/− photoreceptor cells stained for glutamylation (GT335, cyan) and tubulin (magenta). Scale bar: 500 nm.

References

    1. Aljammal R, Saravanan T, Guan T, Rhodes S, Robichaux MA, Ramamurthy V (2024) Excessive tubulin glutamylation leads to progressive cone-rod dystrophy and loss of outer segment integrity. Hum Mol Genet 33:802–817 - PubMed
    1. Astuti GDN, Arno G, Hull S, Pierrache L, Venselaar H, Carss K, Raymond FL, Collin RWJ, Faradz SMH, van den Born LI et al (2016) Mutations in AGBL5, encoding α-tubulin deglutamylase, are associated with autosomal recessive retinitis pigmentosa. Invest Ophthalmol Vis Sci 57:6180–6187 - PubMed
    1. Bachmann-Gagescu R, Neuhauss SC (2019) The photoreceptor cilium and its diseases. Curr Opin Genet Dev 56:22–33 - PubMed
    1. Bodakuntla S, Yuan X, Genova M, Gadadhar S, Leboucher S, Birling M, Klein D, Martini R, Janke C, Magiera MM (2021) Distinct roles of α‐ and β‐tubulin polyglutamylation in controlling axonal transport and in neurodegeneration. EMBO J 40:e108498 - PMC - PubMed
    1. Branham K, Matsui H, Biswas P, Guru AA, Hicks M, Suk JJ, Li H, Jakubosky D, Long T, Telenti A et al (2016) Establishing the involvement of the novel gene AGBL5 in retinitis pigmentosa by whole genome sequencing. Physiol Genomics 48:922–927 - PMC - PubMed

LinkOut - more resources