

Integrated multiomics analysis identified comprehensive crosstalk between diverse programmed cell death patterns and novel molecular subtypes in Hepatocellular Carcinoma
- PMID: 39528670
- PMCID: PMC11555373
- DOI: 10.1038/s41598-024-78911-4
Integrated multiomics analysis identified comprehensive crosstalk between diverse programmed cell death patterns and novel molecular subtypes in Hepatocellular Carcinoma
Abstract
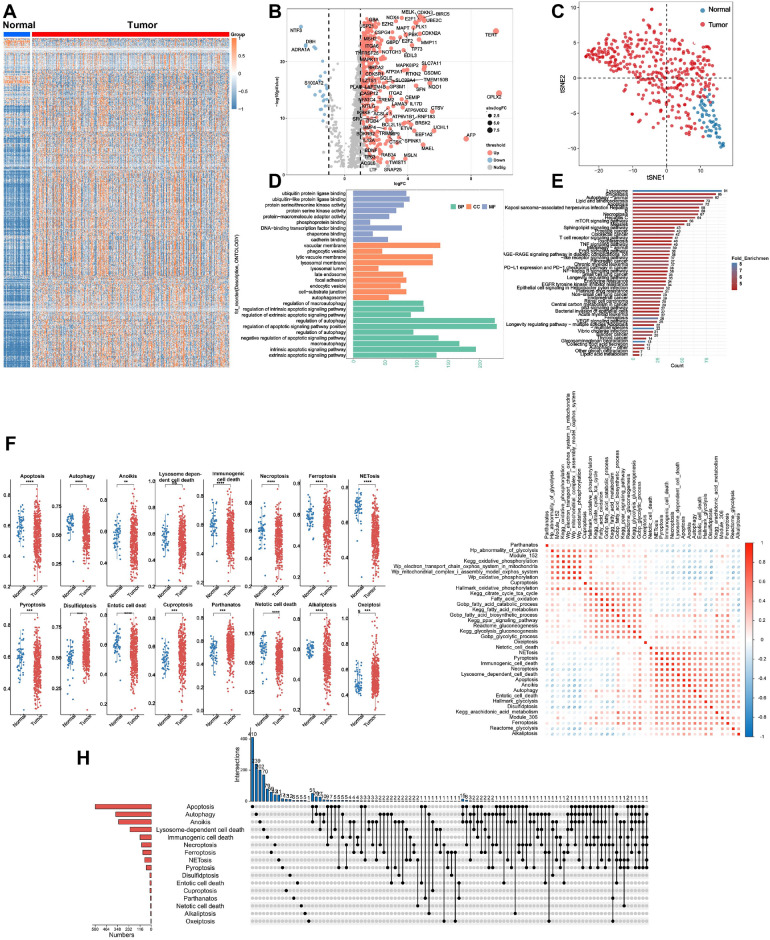
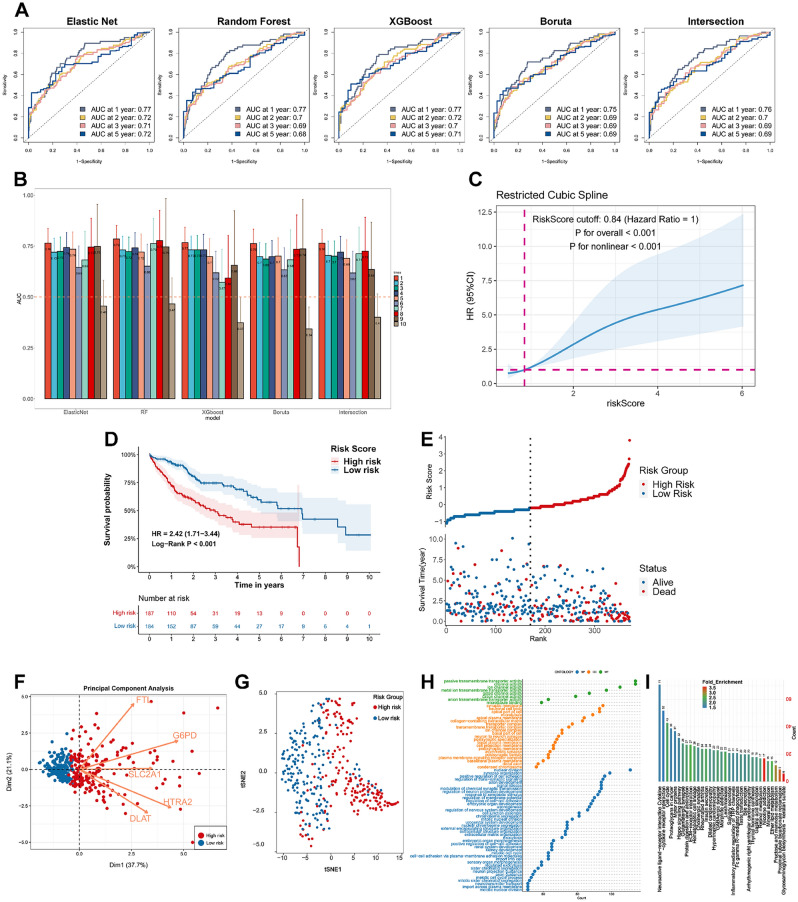
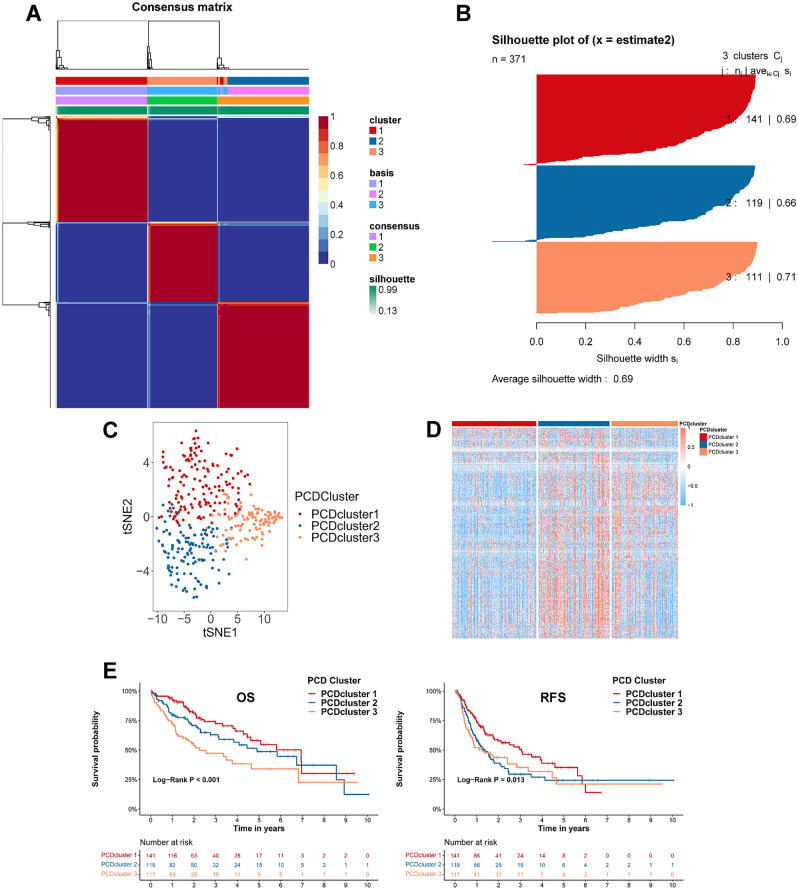
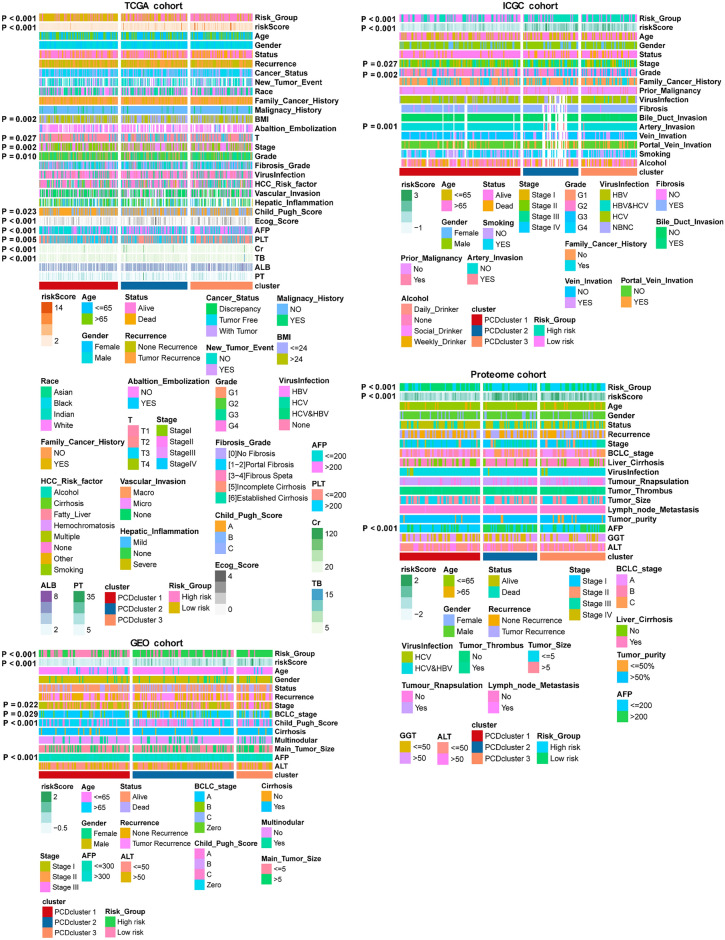
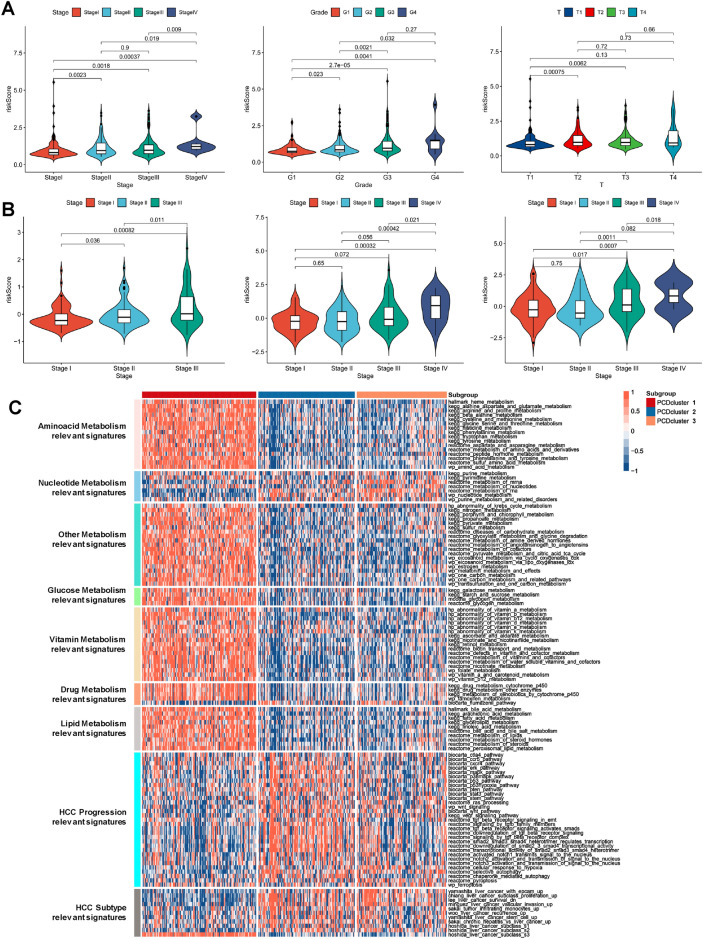
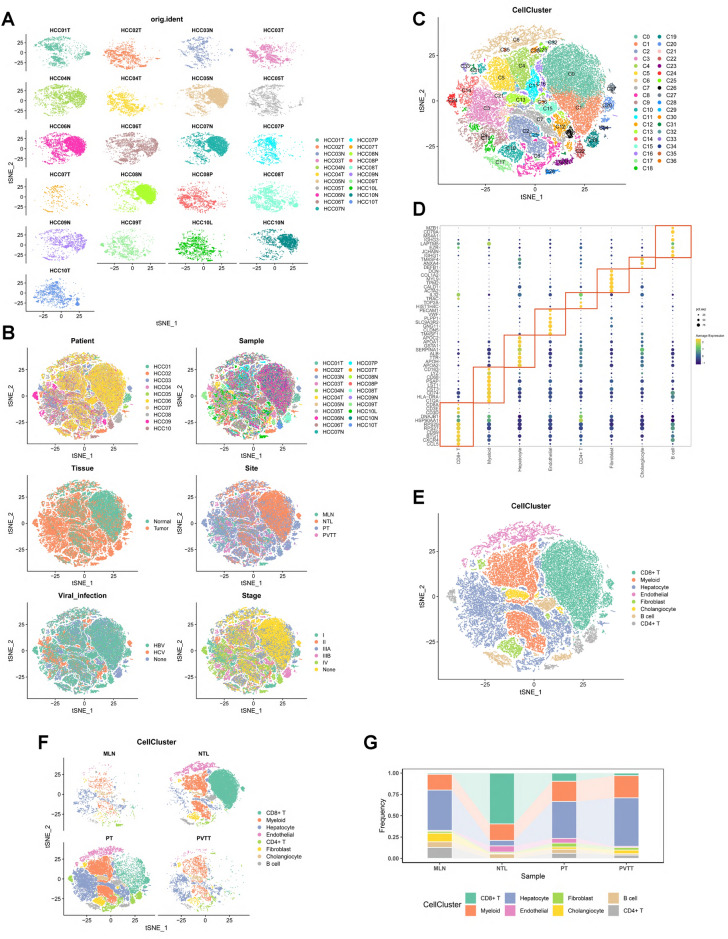
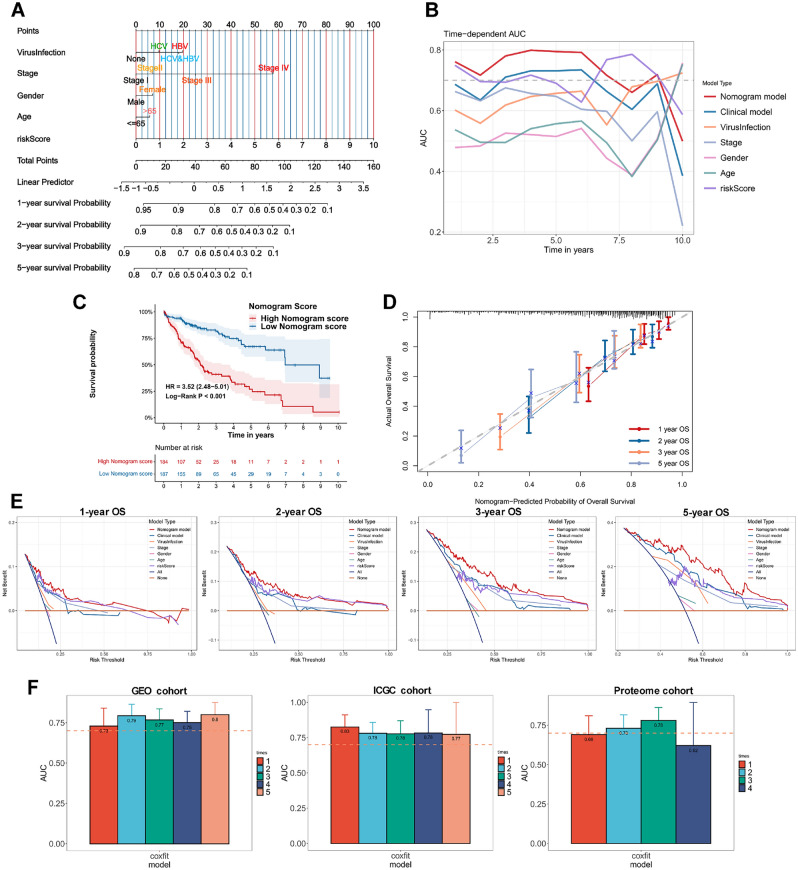
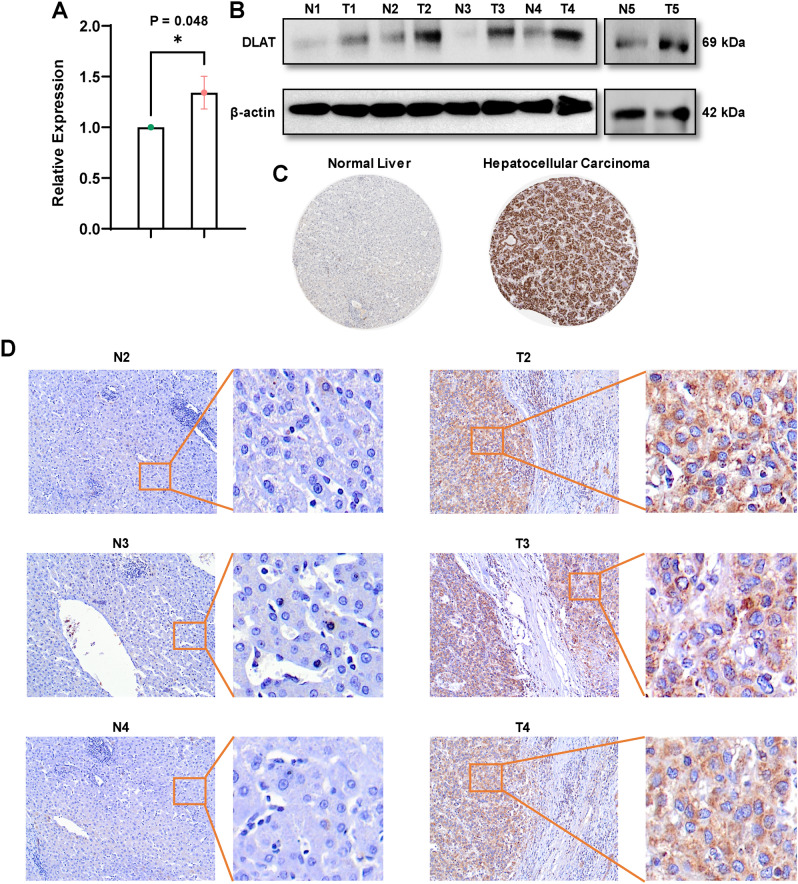
Hepatocellular carcinoma (HCC) is a highly aggressive malignancy with increasing global prevalence and is one of the leading causes of cancer-related mortality in the human population. Developing robust clinical prediction models and prognostic stratification strategies is crucial for developing individualized treatment plans. A range of novel forms of programmed cell death (PCD) plays a role in the pathological progression and advancement of HCC, and in-depth study of PCD is expected to further improve the prognosis of HCC patients. Sixteen patterns (apoptosis, autophagy, anoikis, lysosome-dependent cell death, immunogenic cell death, necroptosis, ferroptosis, netosis, pyroptosis, disulfidptosis, entotic cell death, cuproptosis, parthanatos, netotic cell death, alkaliptosis, and oxeiptosis) related to PCD were collected from the literatures and used for subsequent analysis. Supervised (Elastic net, Random Forest, XgBoost, and Boruta) and unsupervised (Nonnegative Matrix Factorization, NMF) clustering algorithms were applied to develop and validate a novel classifier for the individualized management of HCC patients at the transcriptomic, proteomic and single-cell levels. Multiple machine learning algorithms developed a programmed cell death index (PCDI) comprising five robust signatures (FTL, G6PD, SLC2A1, HTRA2, and DLAT) in four independent HCC cohorts, and a higher PCDI was predictive of higher pathological grades and worse prognoses. Furthermore, a higher PCDI was found to be correlated with the presence of a repressive tumor immune microenvironment (TME), as determined through an integrated examination of bulk and single-cell transcriptome data. In addition, patients with TP53 mutation had higher PCDI in comparison with TP53 WT patients. Three HCC subtypes were identified through unsupervised clustering (NMF), exhibiting distinct prognoses and significant biological processes, among the three subtypes, PCDcluster 3 was of particular interest as it contained a large proportion of patients with high risk and low metabolic activity. Construction and evaluation of the Nomogram model was drawn based on the multivariate logistic regression analysis, and highlighted the robustness of the Nomogram model in other independent HCC cohorts. Finally, to explore the prognostic value, we also validated the frequent upregulation of DLAT in a real-world cohort of human HCC specimens by qPCR, western blot, and immunohistochemical staining (IHC). Together, our work herein comprehensively emphasized PCD-related patterns and key regulators, such as DLAT, contributed to the evolution and prognosis of tumor foci in HCC patients, and strengthened our understanding of PCD characteristics and promoted more effective risk stratification strategies.
Keywords: Hepatocellular carcinoma; Integrated multi-omics analysis; Machine learning model; Molecular subtype; Programmed cell death.
© 2024. The Author(s).
Conflict of interest statement
Figures


Similar articles
-
Prediction of clinical prognosis and drug sensitivity in hepatocellular carcinoma through the combination of multiple cell death pathways.Cell Biol Int. 2024 Dec;48(12):1816-1835. doi: 10.1002/cbin.12235. Epub 2024 Aug 27. Cell Biol Int. 2024. PMID: 39192561
-
A predictive model based on program cell death genes for prognosis and therapeutic response in early stage hepatocellular carcinoma.Sci Rep. 2025 Apr 22;15(1):13937. doi: 10.1038/s41598-025-98634-4. Sci Rep. 2025. PMID: 40263559 Free PMC article.
-
Integrative multi-omics analysis reveals a novel subtype of hepatocellular carcinoma with biological and clinical relevance.Front Immunol. 2024 Dec 6;15:1517312. doi: 10.3389/fimmu.2024.1517312. eCollection 2024. Front Immunol. 2024. PMID: 39712016 Free PMC article.
-
Navigating the complexities of cell death: Insights into accidental and programmed cell death.Tissue Cell. 2024 Dec;91:102586. doi: 10.1016/j.tice.2024.102586. Epub 2024 Oct 16. Tissue Cell. 2024. PMID: 39426124 Review.
-
Understanding the relationship between cuproptosis and the development of hepatocellular carcinoma: implications for targeted therapies.Front Immunol. 2025 Mar 12;16:1557223. doi: 10.3389/fimmu.2025.1557223. eCollection 2025. Front Immunol. 2025. PMID: 40145101 Free PMC article. Review.
Cited by
-
Bibliometric analysis of programmed cell death and immunogenic cell death in hepatocellular carcinoma immunotherapy: global trends and future directions.Discov Oncol. 2025 Jul 1;16(1):1208. doi: 10.1007/s12672-025-02278-9. Discov Oncol. 2025. PMID: 40591134 Free PMC article.
-
From Omics to Multi-Omics: A Review of Advantages and Tradeoffs.Genes (Basel). 2024 Nov 29;15(12):1551. doi: 10.3390/genes15121551. Genes (Basel). 2024. PMID: 39766818 Free PMC article. Review.
-
Anoikis resistance in gastric cancer: a comprehensive review.Cell Death Dis. 2025 Jul 15;16(1):528. doi: 10.1038/s41419-025-07860-1. Cell Death Dis. 2025. PMID: 40664635 Free PMC article. Review.
-
A novel programmed cell death signature predicts clinical outcomes in clear cell renal cell carcinoma and identifies PLK1 as a therapeutic target.Apoptosis. 2025 Aug;30(7-8):1797-1825. doi: 10.1007/s10495-025-02126-9. Epub 2025 Jun 9. Apoptosis. 2025. PMID: 40488834
References
-
- Yang, C. et al. Evolving therapeutic landscape of advanced Hepatocellular Carcinoma. Nat. Rev. Gastroenterol. Hepatol.20, 203–222 (2023). - PubMed
-
- Llovet, J. M. et al. Nonalcoholic steatohepatitis-related Hepatocellular Carcinoma: Pathogenesis and treatment. Nat. Rev. Gastroenterol. Hepatol.20, 487–503 (2023). - PubMed
-
- Zhang, X., Wang, K. & Cheng, S. Surveillance for early-stage hepatocellular carcinoma by ultrasound plus alpha-fetoprotein measurement: More details more significance. Gastroenterology155, 1274–1275 (2018). - PubMed
MeSH terms
Substances
Grants and funding
LinkOut - more resources
Full Text Sources
Medical
Research Materials
Miscellaneous
