. 2024 Dec;27(12):2417-2429.
doi: 10.1038/s41593-024-01777-2. Epub 2024 Nov 11.

TYK2 regulates tau levels, phosphorylation and aggregation in a tauopathy mouse model

Affiliations

TYK2 regulates tau levels, phosphorylation and aggregation in a tauopathy mouse model

Jiyoen Kim et al. Nat Neurosci. 2024 Dec.

Abstract

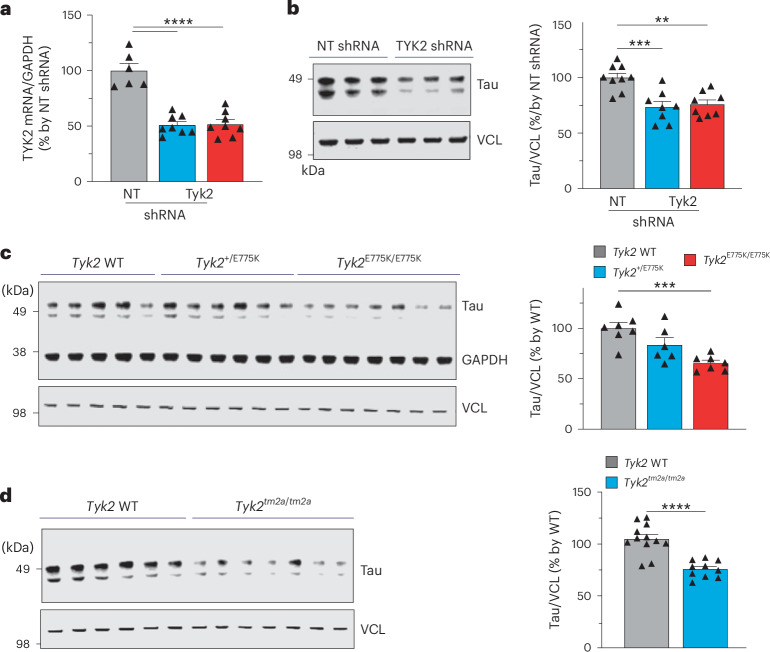
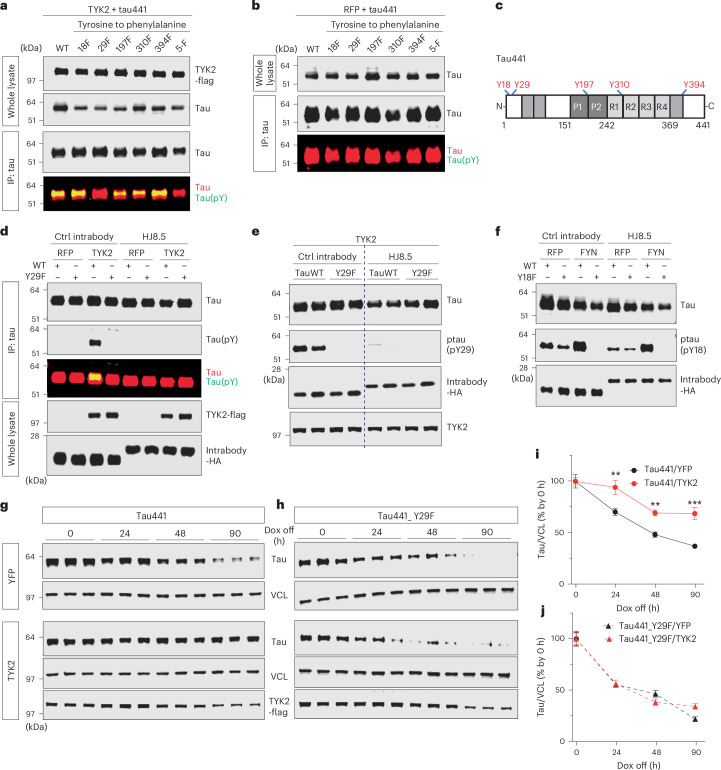
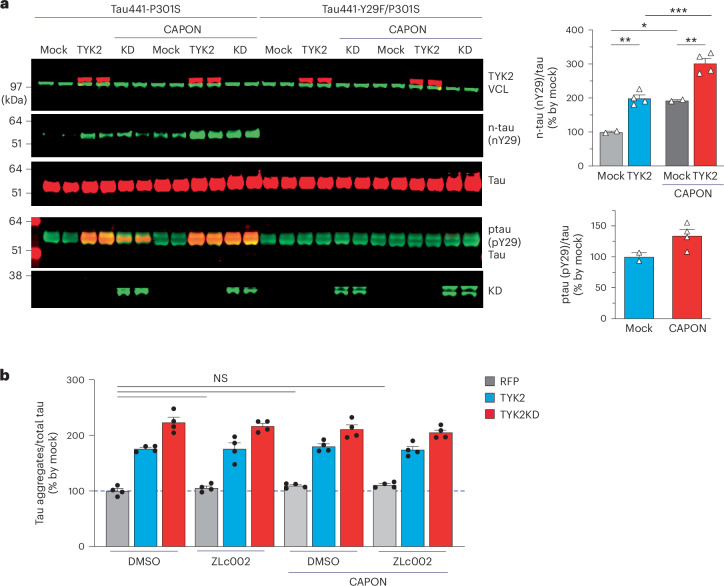
Alzheimer's disease is one of at least 26 diseases characterized by tau-positive accumulation in neurons, glia or both. However, it is still unclear what modifications cause soluble tau to transform into insoluble aggregates. We previously performed genetic screens that identified tyrosine kinase 2 (TYK2) as a candidate regulator of tau levels. Here we verified this finding and found that TYK2 phosphorylates tau at tyrosine 29 (Tyr29) leading to its stabilization and promoting its aggregation in human cells. We discovered that TYK2-mediated Tyr29 phosphorylation interferes with autophagic clearance of tau. We also show that TYK2-mediated phosphorylation of Tyr29 facilitates pathological tau accumulation in P301S tau-transgenic mice. Furthermore, knockdown of Tyk2 reduced total tau and pathogenic tau levels and rescued gliosis in a tauopathy mouse model. Collectively, these data suggest that partial inhibition of TYK2 could thus be a strategy to reduce tau levels and toxicity.


Conflict of interest statement

Competing interests: H.Y.Z. cofounded Cajal Neuroscience, is a director of the Regeneron Pharmaceuticals board and is on the scientific advisory board of Cajal Neuroscience, Lyterian and the Column Group. D.M.H. cofounded and is on the scientific advisory board of C2N Diagnostics. D.M.H. is on the scientific advisory board of Denali, Cajal Neuroscience and Genentech, consults for Asteroid Therapeutics, is an inventor of and has a patent on antitau antibodies that was licensed by Washington University to C2N Diagnostics. B.H. owns stock in Novartis; he serves on the scientific advisory board of Dewpoint and has an option for stock. He serves on a scientific advisory board or is a consultant for AbbVie, Alexion, Ambagon, Aprinoia Therapeutics, Arvinas, Avrobio, AstraZeneca, Biogen, BMS, Cure Alz Fund, Cell Signaling Technology, Dewpoint, Latus, Novartis, Pfizer, Sanofi, Sofinnova, Vigil, Violet, Voyager and WaveBreak. His laboratory is supported by research grants from the NIH, Cure Alzheimer’s Fund, Tau Consortium and the JPB Foundation, as well as a sponsored research agreement from Abbvie. The other authors declare no competing interests.

Figures

Fig. 1
Fig. 1. Genetically decreasing Tyk2 in mice reduces tau levels.
a, The level of Tyk2 mRNA in mouse brain determined by qPCR at 3 weeks after ICV injection of AAV8 harboring Tyk2 shRNA (n = 8) or NT shRNA (n = 6; one-way ANOVA, Bonferroni post hoc tests, P < 0.0001). b, IB image and quantification of tau levels showing that TYK2 knockdown by shRNA reduced endogenous tau levels in the mouse brain at 3 weeks of age (n = 8–9; one-way ANOVA, Bonferroni post hoc tests, P(NT versus Tyk2shRNA1) = 0.0004, P(NT versus Tyk2shRNA2) = 0.0011). c, IB image and quantification of endogenous tau protein in the brain from mice containing heterozygous or homozygous mutant Tyk2 E775K, or WT littermates at 1 month old (n = 7; one-way ANOVA, Bonferroni post hoc tests, P(WT versus Tyk2_E2775K/+) = 0.0853, P(WT versus Tyk2_E2775K/E2775K) = 0.0004). d, IB image and quantification of endogenous tau protein in the brain from homozygous Cre-inducible Tyk2 KO mice (Tyk2tm2a/tm2a) at 1 month after P0-ICV injection of AAV8-Cre (n = 10–12; unpaired t test/two-tailed, P = 0.000018). ‘n’ is the number of mice. Data are represented as mean ± s.e.m., **P < 0.01, ***P < 0.0005 and ****P < 0.0001. VCL, vinculin. Source data
Fig. 2
Fig. 2. TYK2 phosphorylates tau at Tyr29 residue and thus stabilizes tau protein.
a,b, IB image of the phosphorylation of tau at Tyr residues in the presence (a) or absence (b) of TYK2 in HEK293T cells. Tau protein was collected by IP and detected by pan-phospho-Tyr antibody. p-Tyr was observed only in the presence of TYK2 and was lost in the phosphorylation disabling mutation at Tyr29 (tau441-Y29F) indicated by loss of p-Tyr signal despite the addition of TYK2. c, Schematic diagram of Tyr residues of tau441 protein. d, IB image of p-Tyr signal detected in neither tau441-Y29F nor tau treated with tau intrabody masking Tyr29 on tau protein in HEK293T cells. Either tau441 or tau441-Y29F was co-expressed with TYK2 in HEK293T cells that stably expressed either tau intrabody (clone HJ8.5, targeting tau amino acid residues 25–30) or control intrabody (clone HJ15.4). e,f, IB image of ptau detected by our ptau (pY29) antibody (e) or ptau (pY18) antibody (f) in the indicated samples in the presence or absence of tau intrabody. gj, IB images and quantification of tau showing the turnover rate of tau441 (g and i) and tau441-Y29F (h and j; n = 6, n is the number of biological repeats). Mouse primary cultured cortical neurons were virally infected with genes encoding tau441 WT or tau441-Y29F under a TTA-inducible promoter. Tau protein was expressed by DOX treatment for 24 h, after which DOX was removed and cells were collected at indicated time points. The blots are representative of three independent experiments. **P < 0.005, ***P < 0.0005 versus vector-expressing control. Data presented as mean ± s.e.m., two-way ANOVA/Dunnett’s test. 5-F, tau with all five Tyr converted to Phe. Source data
Fig. 3
Fig. 3. TYK2-mediated Tyr29 phosphorylation stabilizes tau by inhibiting autophagy-mediated tau degradation.
a, IB image showing the changes in ubiquitination of tau441 and tau441-Y29F by TYK2 or TYK2KD. b, IB image of the K48-linked or K63-linked Ub-tau in the presence of TYK2 showing that TYK2 enhances K63-linked ubiquitination of tau protein. c, IB images showing the changes in tau ubiquitination by TYK2 in HEK293T cells treated with either proteasome inhibitor (MG132, 10 μM, 6 h) or autophagy inhibitor (CQ, 40 μM, 6 h). To enhance tau ubiquitination, CHIP and GSK3β were transiently expressed. d, IB image and quantification of tau protein level in SHSY-5Y cells treated with TYK2 inhibitor for 48 h in the presence or absence of either proteasome inhibitor (MG132, 100 nM) or autophagy inhibitor (CQ, 20 μM; n = 6–11, n is the number of biological repeats; one-way ANOVA/Dunnett’s multiple comparison test, P(DMSO–DMSO versus DMSO–TYK2 inhibitor) = 0.0003, P(MG132–DMSO versus MG132–TYK2 inhibitor) < 0.0001, P(CQ–DMSO versus CQ–TYK2 inhibitor) > 0.9999). Data are represented as mean ± s.e.m., ***P < 0.0005 and ****P < 0.0001. ac, the representative images of three independent experiments. CQ, chloroquine; CHIP, C-terminus of Hsc70-interacting protein; NS, not significant. Source data
Fig. 4
Fig. 4. The fragment of TYK2 correlates with pathological phospho-tau in human AD brain samples.
a,b, IB image (a) and quantification (b) of TYK2 and PHF1 tau (ptau(pS396/pS404)) in human patients with AD and control participants showing TYK2 is reduced in patients with AD compared to control participants (n = 12 for control and n = 17 for AD, n is the number of individuals; unpaired t test/two-tailed, P = 0.0011). c, Graph of individual values (black dots) and trendline (red line) of the level of TYK2 versus the level of PHF1 in AD samples, showing their correlation (slope = 1.06, P value = 0.06, R2 = 0.34). d, IB image of the activated TYK2 and PHF1 tau (ptau(pS396/pS404)) in human patients with AD and control participants. Two AD samples with the cleaved TYK2 (red asterisk) had high levels of PHF1 tau. e, Representative IB image (four independent repeats) of total tau and PHF1 tau from detergent-soluble or detergent-insoluble fractions from HEK293T cells expressing tau441-P301S or tau441-Y29F/P301S, showing the rise in tau aggregates upon tau seeding in the presence of TYK2 but not when tau441-P301S/Y29F was expressed. Data are represented as mean ± s.e.m., **P < 0.01. Source data
Fig. 5
Fig. 5. TYK2 promotes tau aggregation upon proteopathic tau seeding in human cells.
a, Representative image of total tau-YFP (top) and the remaining tau-YFP aggregates (bottom) after extraction of soluble tau protein by the given detergent without or with tau seed transduction, respectively, in HEK293T cells that stably express tau441-P301S-YFP. Scale bar, 0.1 mm. b, Representative image of scanned tau-YFP aggregates of indicated samples after 48 h of tau seed transduction. Cells transiently expressed either RFP, TYK2 or FYN (the sample images are from the experiment using DMSO). Entire 24-well plates were scanned to detect total tau protein and then scanned again after extraction of soluble proteins to detect aggregated tau. Scale bar, 1 mm. c, Quantification of tau aggregation level from tau441-P301S-YFP and tau441-Y29F/P301S-YFP cells treated with either DMSO or deucravacitinib (TYK2 inhibitor, 100 nM) followed by transfection of either RFP, TYK2 or FYN. TYK2 promoted tau aggregation but not in tau441-Y29F/P301S. This increase was abolished by TYK2 inhibitor, whereas FYN promoted tau aggregation regardless (n = 8–12: respective experiments; n = 6–10; two-way ANOVA/Tukey’s multiple comparison test, P(tau441-P301S:RFP–DMSO versus TYK2–DMSO) < 0.0001, P(tau441-P301S:RFP–DMSO versus FYN–DMSO) < 0.0001, P(tau441-P301S:RFP–TYK2 inhibitor versus TYK2–TYK2 inhibitor) > 0.9999, P(tau441-P301S:RFP–TYK2 inhibitor versus FYN–TYK2 inhibitor) < 0.0001, P(tau441-Y29F/P301S:RFP–DMSO versus TYK2–DMSO) = 0.99951, P(tau441-Y29F/P301S:RFP–DMSO versus FYN–DMSO) < 0.0001, P(tau441-Y29F/P301S:RFP–TYK2 inhibitor versus TYK2–TYK2 inhibitor) = 0.9997, P(tau441-Y29F/P301S:RFP–TYK2 inhibitor versus FYN–TYK2 inhibitor) < 0.0001). d, Quantification of tau aggregation level from tau biosensor cell line stably expressing tau441-P301S or tau441-Y29F/P301S with either RFP or TYK2 after proteopathic tau seed transduction (n = 4; one-way ANOVA/Tukey’s multiple comparison test, P(P301S–RFP versus P301S–TYK2) < 0.0001, P(Y29F/P301S–RFP versus Y29F/P301S–TYK2) = 0.9811, P(P301S–RFP versus Y29F/P301S–RFP) = 0.5897). eg, The spontaneous tau aggregation in tau RD P301S FRET biosensor cells after infection with tau441-P301S or tau441-Y29F/P301S. e, IB image showing comparable total tau level between tau441-P301S and tau441-Y29F/P301S in the same infection MOI. Representative images (f) and quantification graph (g) showing the spontaneous tau aggregation after 6 days of tau infection (n = 4; two-way ANOVA/Sidak’s multiple comparisons, P(tau441-P301S–10 MOI versus tau441-Y29F/P301S–10 MOI) < 0.0001, P(tau441-P301S–10 MOI versus tau441-P301S–5 MOI) = 0.0001). Scale bar, 1 mm. n is the number of biological repeats. Data are represented as mean ± s.e.m., ****P < 0.0001. Source data
Fig. 6
Fig. 6. TYK2-mediated tau phosphorylation at Tyr29 augments tau nitration at Tyr29 in HEK293T cells.
a, IB image and quantification of tau phosphorylation and nitration at Tyr29 residue of WT tau441 in the presence of TYK2 or/and CAPON in HEK293T cells. Tau nitration at Tyr29 residue is increased by phosphorylation at the same residue by TYK2 regardless of CAPON expression (n = 4; top-right, one-way ANOVA/Tukey’s multiple comparison, P(Mock versus TYK2) = 0.00334, P(CAPON–Mock versus CAPON–TYK2) = 0.001830, P(Mock versus CAPON–Mock) = 0.011628; bottom-right, unpaired t test/two-tailed, P(Mock versus CAPON) = 0.0921). b, Quantitative graph of tau aggregation from cells treated with DMSO or Zlc002 (CAPON inhibitor, 1 mM), followed by transfection (RFP, TYK2, TYK2KD or/and CAPON) and tau seed transduction (n = 4; two-way ANOVA/Tukey’s multiple comparison test, P(DMSO versus ZLc002) > 0.9999, P(DMSO versus CAPON–DMSO) > 0.9999, P(DMSO versus CAPON–ZLc002) = 0.9999, P(CAPON–DMSO versus CAPON–ZLc002) = 0.9998). Tau aggregation was increased by TYK2 but was not changed by either the CAPON or Zlc002 (n = 4). n is the number of biological repeats. Data are represented as mean ± s.e.m., *P < 0.05, **P < 0.01 and ***P < 0.0005. Source data
Fig. 7
Fig. 7. Preventing Tyr29 phosphorylation attenuates tau pathology, but TYK2 expression aggravates pathology in P301S mice.
a, Experimental design showing transgenic mice that express P301S tau with or without phosphorylation-disable mutation tau (Y29F). Mice were co-injected at P0 with YFP or TYK2KD, and brain tissue was collected for biochemistry at 1 month (d) or 2 months (e and f) after birth. b, Representative IB image (three independent repeats) showing the phosphorylation of either tau441, tau441-Y29F or tau441 with nonphosphorylatable mutation at all five Tyr residues (tau5Y-F) by either TYK2 or TYK2KD. TYK2KD phosphorylated mostly Tyr29 indicated by the depletion of pan-phospho-antibody signal. c, Relative expression of exogenous (exo) human P301S tau compared to the endogenous (endo) mouse tau from the virus-injected mice or P301S tau-transgenic mice (PS19 line; n = 4–10; one-way ANOVA/Tukey’s multiple comparison test, P(P301S versus Y29F/P301S) = 0.6720, P(P301S versus P301S–TYK2KD) = 0.9996, P(P301S versus PS19) = 0.1767). d, IB image and quantification graph of total tau and a pathological PHF1 tau from the injected virus (n = 4–9; one-way ANOVA/Tukey’s multiple comparison test, P(P301S versus Y29F/P301S) = 0.00008, P(P301S versus P301S–TYK2KD) = 0.0609). e, Representative IB image of total tau, a PHF1 tau and nitrate tau at Tyr29 from mouse brains 1 month after birth (three independent repeats). f, Representative IB image of the total, sarkosyl-insoluble or sarkosyl-insoluble HW P301S, indicating that TYK2 enhanced detergent-insoluble tau441-P301S but not tau441-Y29F/P301S in mouse brains 2 months after birth (n = 6, two independent repeats). n is the number of mice. Data are represented as mean ± s.e.m., ****P < 0.0001. HW, high-molecular-weighted. Source data
Fig. 8
Fig. 8. TYK2 knockdown reduces total and pathogenic tau species and attenuates gliosis in P301S tau-transgenic mice (PS19 line).
a, mRNA level of Tyk2 from 9-month-old mice ICV-injected with either NT shRNA or Tyk2 shRNA (n = 8; unpaired t test/two-tailed, P < 0.000001). b, In vitro tau aggregation assay to examine proteopathic tau seeding activities. Quantitative graph and representative bivariate plots of tau FRET signal from tau RD P301S FRET biosensor cells after seed transduction with brain lysate from WT and PS19 mice (9 months old). Graph shows the number of FRET-positive cells (n = 18–20; unpaired t test/two-tailed, P < 0.0001). c,d, IB image (c) and quantification (d) of total tau (c_i, P = 0.0049), ptau (pS396/S404) (c_ii, P < 0.0001), oligomeric tau (c_iii, P = 0.0001) and ptau (pT205) (c_iv, P = 0.0147) in PS19 mice after knockdown of Tyk2 at 9 months of age. Each data point in the bar graphs represents an individual animal (n = 15–45; one-way ANOVA/Dunnett’s multiple comparison test). e, Representative images of microglia (IBA1) and astrocyte (GFAP) markers in hippocampal CA1 region of 9-month-old PS19/NT and PS19/Tyk2 knockdown mice. f, Quantification of IBA1 intensity (n = 6–10; P(cortex–NT versus cortex–Tyk2sh) = 0.000418, P(CA1–NT versus CA1–Tyk2sh) = 0.000147, P(DG–NT versus DG–Tyk2sh) = 0.000044) and GFAP intensity (n = 6–10; P(cortex–NT versus cortex–Tyk2sh) = 0.022869, P(CA1–NT versus CA1–Tyk2sh) = 0.010256, P(DG–NT versus DG–Tyk2sh) = 0.006338) in several brain regions of PS19/NT PS19/Tyk2 knockdown (one-way ANOVA/Sidak’s multiple comparison test) mice. Each data point represents an individual animal, and each animal has an average of two to three sections (n = 6–10). n is the number of mice. Data are represented as mean ± s.e.m., *P < 0.05, **P < 0.01, ***P < 0.0005 and ****P < 0.0001. Source data
Extended Data Fig. 1
Extended Data Fig. 1. TYK2 regulates tau concentrations in cells.
ac, Immunoblotting (IB) image and quantitative graph showing reduction of tau levels upon either TYK2 knockdown using shRNA (n = 6, one-way ANOVA, Dunnett’s multiple comparison test, P(NT-TYK2 shRNA1) = 0.0087, P(NT-TYK2 shRNA2) = 0.0045; a) or TYK2 catalytic inhibition using a small molecule (deucravacitinib, BMS986165; n = 6, one-way ANOVA, Dunnett’s multiple comparison test, P(DMSO-TYK2 inhibitor, 50 nM) = 0.0058, P(DMSO-TYK2 inhibitor, 100 nM) = 0.0007; b). In contrast, TYK2 overexpression increases endogenous tau levels in a neuroblastoma cell line (n = 8, unpaired t test, two-tailed, P = 0.0001; c). n is the number of biological replicates. Data are represented as mean ± SEM (**p < 0.01, ***p < 0.0005). Source data
Extended Data Fig. 2
Extended Data Fig. 2. TYK2 binds to and phosphorylates tau protein.
a, Representative co-immunoprecipitation (IP) image (3 repeats) showing an interaction between tau and TYK2-flag in HEK293T cells. b, Schematic diagram of the truncated tau proteins. c, Representative Co-IP of the individual truncated tau proteins after IP of TYK2-flag in HEK293T cells (2 repeats). All tau fragments except truncated MTBR (red dotted box) bind to TYK2. d, Representative tau-IP image (4 repeats) showing phosphorylation of tau at Tyr residue(s) in the presence of TYK2, detected by total tau antibody and pan-phospho-Tyr antibody. e, IB image and quantification graphs showing degradation of WT tau or tau with all its Tyr residues mutated after knockdown of Tyk2 in mouse primary cultured neurons (n = 4, n is the number of individual treatments). Lentivirus containing genes encoding given proteins under a TTA-inducible promoter was used to transduce cells. Tau protein expression was induced by DOX treatment for 24 hours, after which DOX was removed and cells were collected at indicated time points. The cell lysates were subjected to IB analysis. NT, N-terminal region of tau (amino acids 1–151), P1P2, proline-rich region (amino acids 152–242), CT, C-terminal region of tau (amino acid 370–441), MTBR, microtubule-binding repeats (amino acids 243–400). n is the number of biological replicates. Data are represented as mean ± SEM (**p < 0.01, ***p < 0.0005). Source data
Extended Data Fig. 3
Extended Data Fig. 3. Validation of our newly generated tau-pY29 antibody for identification of a phosphatase that dephosphorylates tau at Tyr29.
a, IB image showing that our newly created phospho-tau (pY29) antibody (two independent bleedings) selectively detects TYK2-dependent phosphorylation on tau, but not on RFP control protein or tau441_Y29F. b, Representative immunocytochemistry image of HEK293T cells with TYK2 overexpression, showing TYK2 (detected by flag antibody, left) co-localizes with pTyr29 by the new phospho-tau (pY29) antibody (left and right; 12 individual images from 3 independent experiments). c, IB image of TYK2-mediated phospho-tau (pY29, left) and its quantification in 293T cells treated as indicated (n = 4, n is the number of biological replicates, one-way ANOVA, Sidak’s multiple comparison test, P(DMSO-Na4VO4) = 0.000103, P(DMSO-PTPN11 inhibitor) = 0.40018, P(DMSO-DUSP1shRNA) = 0.002961). d, Representative IB image of FYN-mediated Tyr18 in HEK293T cell treated as indicated (2 independent experiments). Na3VO4, general inhibitor of tyrosine kinase; batoprotafib, PTPN11 inhibitor (TNO155, 100 nM, for 48 h). Data are represented as mean ± SEM (**p < 0.01, ***p < 0.0005). Source data
Extended Data Fig. 4
Extended Data Fig. 4. Tau phosphorylation by FYN, TYK2 or/and GSK3β.
Representative IB image of the overexpressed total tau and phosphorylated tau at Tyr29, or Ser396 by FYN, TYK2, GSK3β, TYK2/GSK3β or TYK2/FYN, respectively (3 independent experiments). The kinases were transiently transfected and expressed for 48 h in HEK293T cells which stably expressed tau441 WT. Source data

References

    1. Williams, D. R. Tauopathies: classification and clinical update on neurodegenerative diseases associated with microtubule-associated protein tau. Intern. Med. J.36, 652–660 (2006). - PubMed
    1. Alquezar, C., Arya, S. & Kao, A. W. Tau post-translational modifications: dynamic transformers of tau function, degradation, and aggregation. Front. Neurol.11, 595532 (2020). - PMC - PubMed
    1. Wesseling, H. et al. Tau PTM profiles identify patient heterogeneity and stages of Alzheimer’s disease. Cell183, 1699–1713 (2020). - PMC - PubMed
    1. Kametani, F. et al. Comparison of common and disease-specific post-translational modifications of pathological tau associated with a wide range of tauopathies. Front. Neurosci.14, 581936 (2020). - PMC - PubMed
    1. Ercan-Herbst, E. et al. A post-translational modification signature defines changes in soluble tau correlating with oligomerization in early stage Alzheimer’s disease brain. Acta Neuropathol. Commun.7, 192 (2019). - PMC - PubMed

LinkOut - more resources