. 2024 Dec;27(12):2384-2400.
doi: 10.1038/s41593-024-01791-4. Epub 2024 Nov 11.

Astrocyte transcriptomic changes along the spatiotemporal progression of Alzheimer's disease

Affiliations

Astrocyte transcriptomic changes along the spatiotemporal progression of Alzheimer's disease

Alberto Serrano-Pozo et al. Nat Neurosci. 2024 Dec.

Abstract

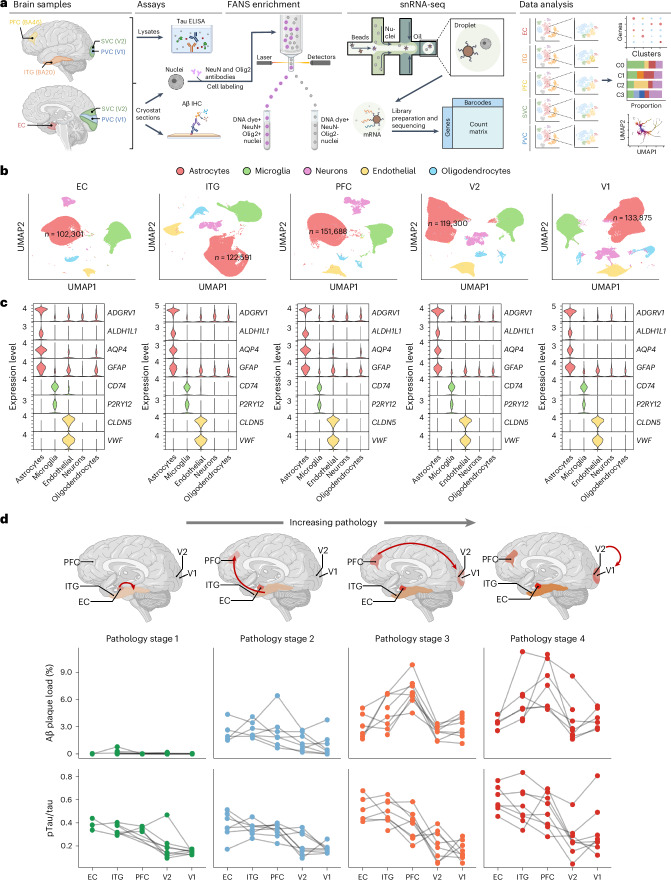
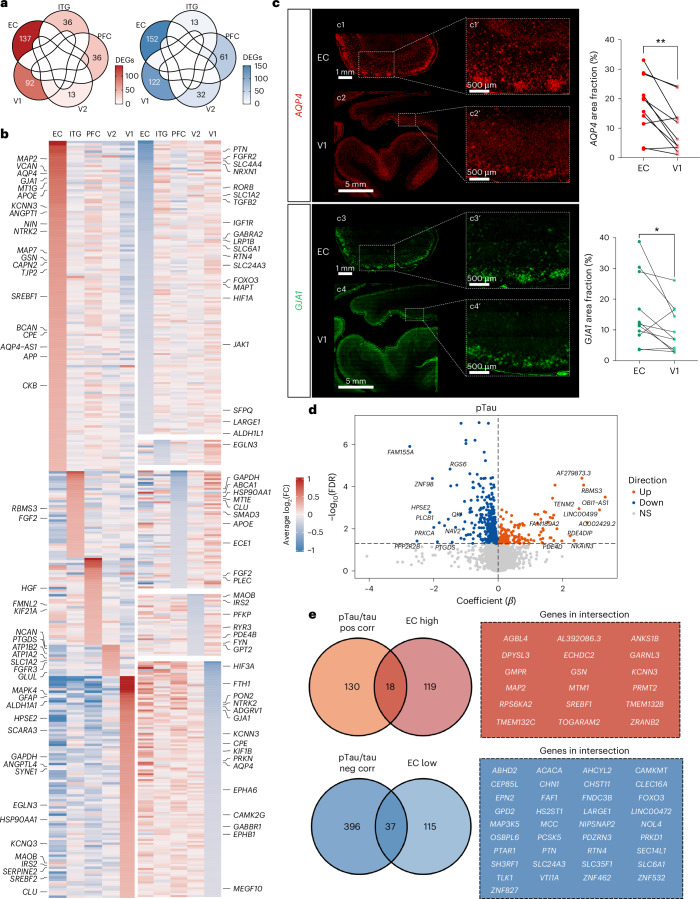
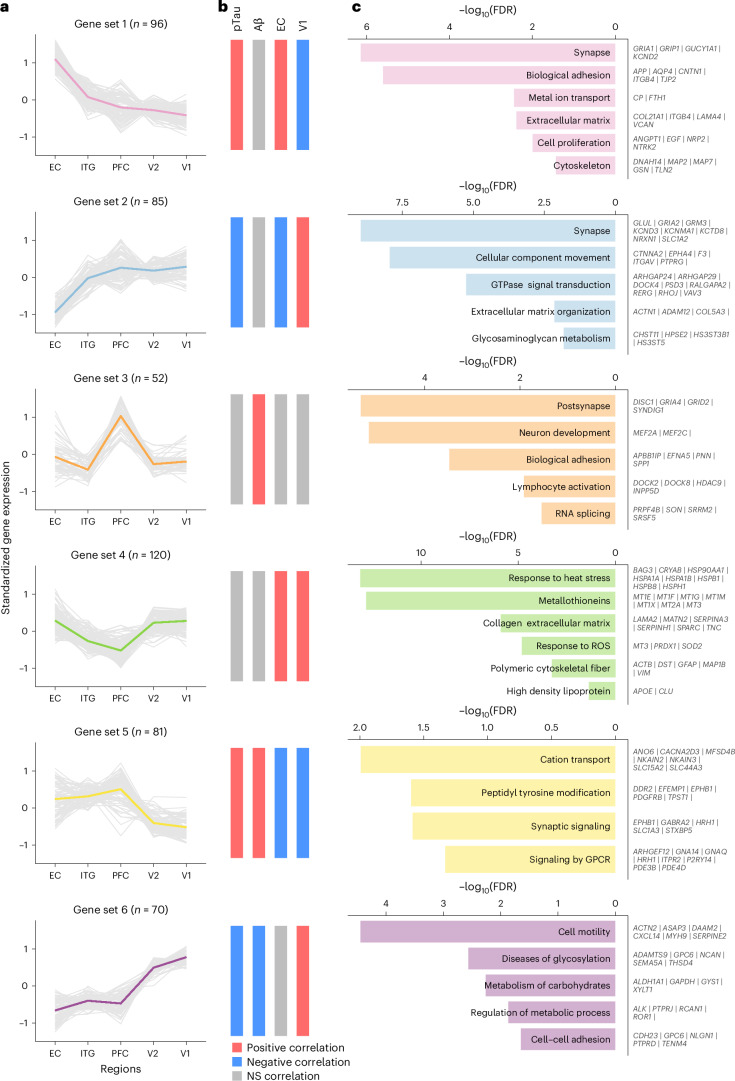
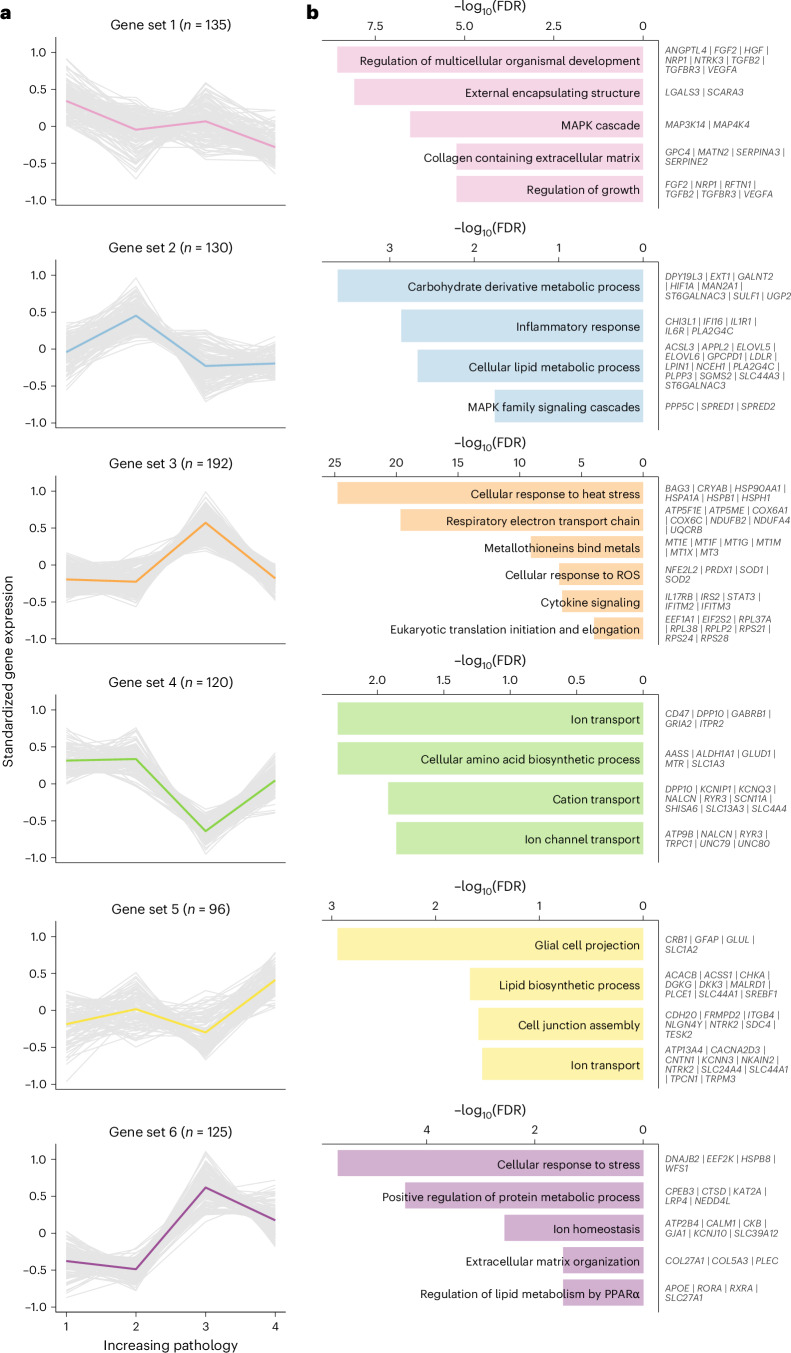
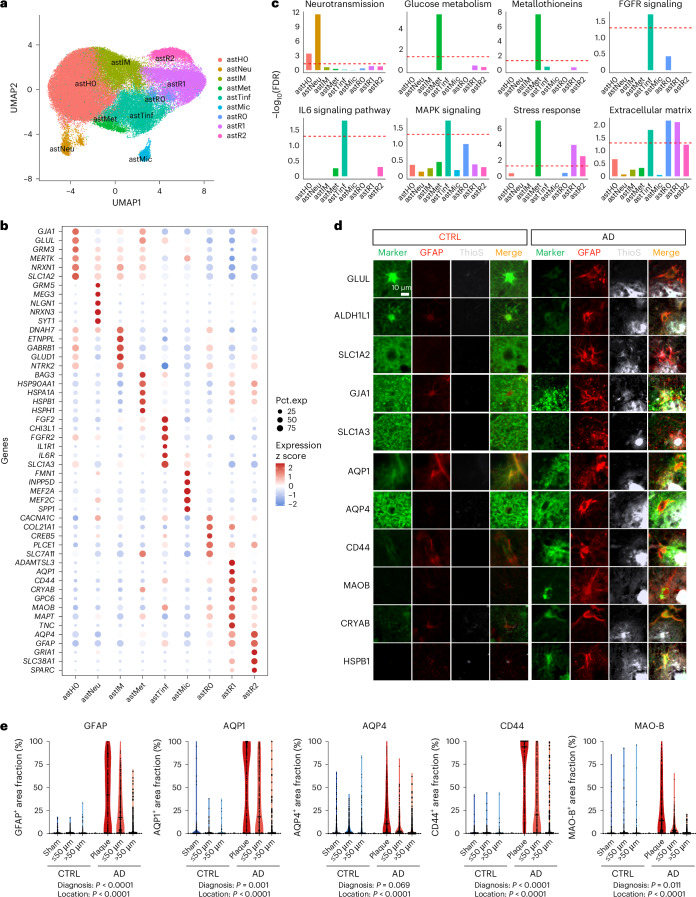
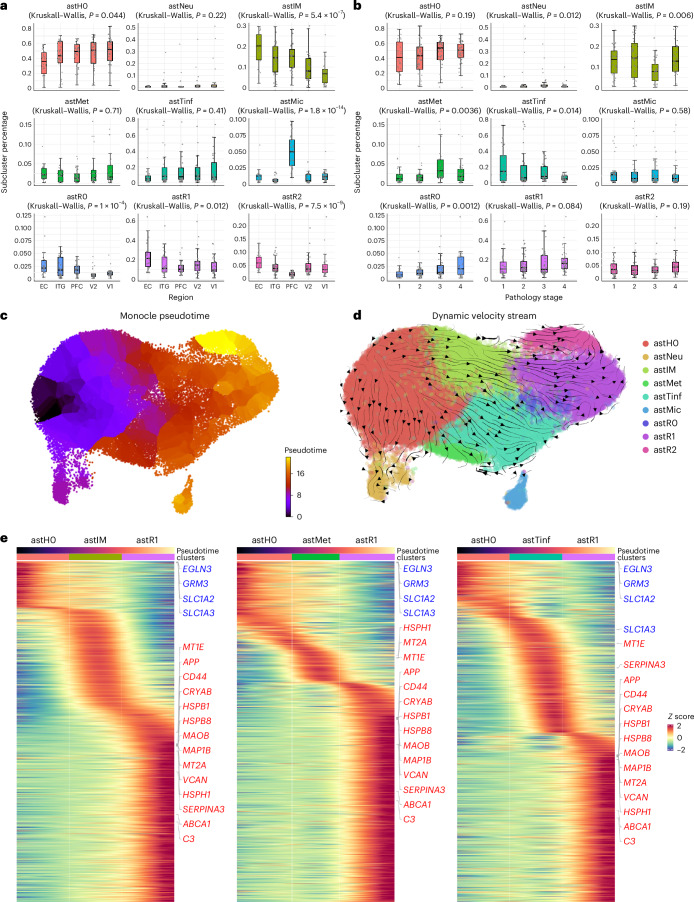
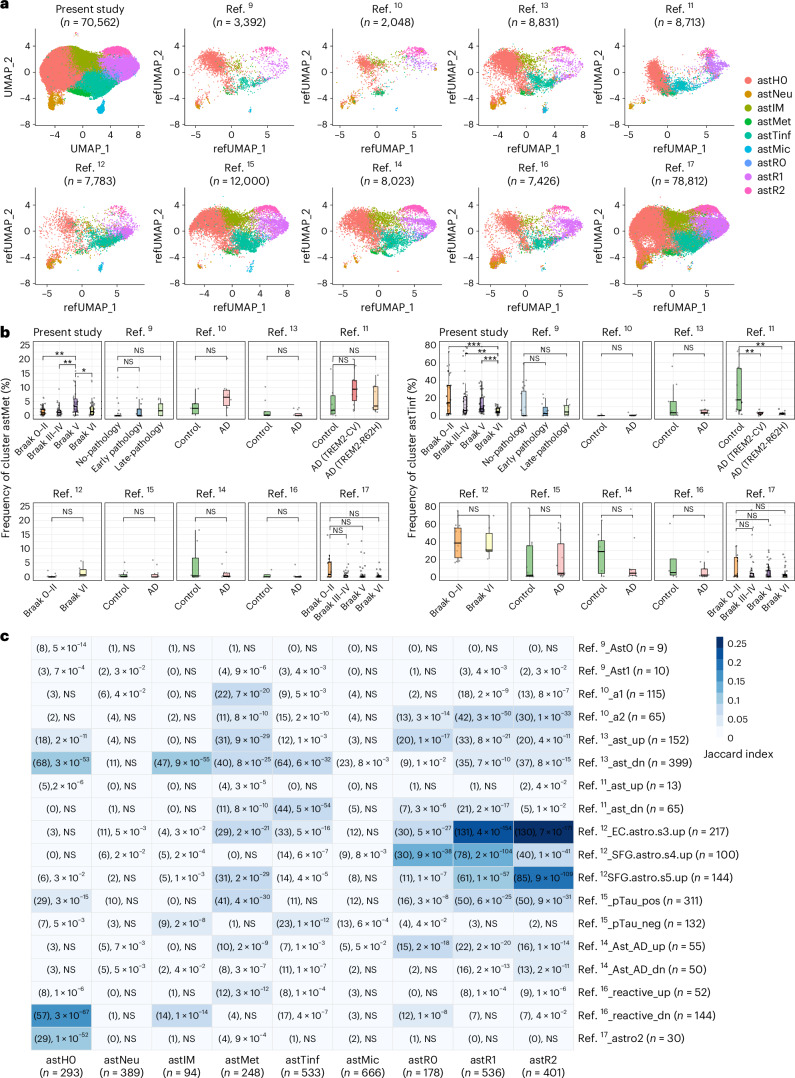
Astrocytes are crucial to brain homeostasis, yet their changes along the spatiotemporal progression of Alzheimer's disease (AD) neuropathology remain unexplored. Here we performed single-nucleus RNA sequencing of 628,943 astrocytes from five brain regions representing the stereotypical progression of AD pathology across 32 donors spanning the entire normal aging to severe AD continuum. We mapped out several unique astrocyte subclusters that exhibited varying responses to neuropathology across the AD-vulnerable neural network (spatial axis) or AD pathology stage (temporal axis). The proportion of homeostatic, intermediate and reactive astrocytes changed only along the spatial axis, whereas two other subclusters changed along the temporal axis. One of these, a trophic factor-rich subcluster, declined along pathology stages, whereas the other increased in the late stage but returned to baseline levels in the end stage, suggesting an exhausted response with chronic exposure to neuropathology. Our study underscores the complex dynamics of astrocytic responses in AD.


Conflict of interest statement

Competing interests: M.E.W., A.W., K.Z., F.L., G.L., T.P., J.T., A.A., T.K., R.V.T, K.B. and E.H.K. are employees of Abbvie. The design, study conduct and financial support for this research were provided by Abbvie. Abbvie participated in the interpretation of data, review and approval of the publication. B.T.H. has a family member who works at Novartis and owns stock in Novartis, serves on the scientific advisory board of Dewpoint and owns stock, serves on a scientific advisory board or is a consultant for Abbvie, Arvinas, Biogen, Novartis, Cell Signaling Technologies, Sangamo, Sanofi, Takeda, US Department of Justice and Vigil, and his laboratory is supported by sponsored research agreements with Abbvie, F Prime and Spark. The remaining authors declare no competing interests.

Figures

Fig. 1
Fig. 1. A molecular survey of astrocytes in five brain regions affected stereotypically in AD.
a, Experimental overview of our snRNA-seq study. The figure was created with BioRender.comb, UMAP visualization showing clustering of NEUN/OLIG2 nuclei. c, Violin plots illustrate the expression levels of cell type-specific marker genes in NEUN/OLIG2 nuclei across the five brain regions. d, Results of Aβ plaque load (percentage of immunoreactive area fraction) and pTau/tau ratio (measured by ELISA) in adjacent samples to those used for snRNA-seq across brain regions and pathology stages. SVC, secondary (association) visual cortex; PVC, primary visual cortex; IHC, immunohistochemistry; FANS, fluorescence-activated nuclei sorting.
Fig. 2
Fig. 2. Regional heterogeneity of astrocyte transcriptome in the normal aging brain.
a, Venn diagrams show the DEGs—upregulated in red and downregulated in blue—in each brain region relative to all other brain regions in n = 8 donors at pathology stage 1 (no neuritic plaques and Braak NFT stages 0/I/II). b, Heatmap depicts the DEGs in each brain region (upregulated in red and downregulated in blue) ranked by average log FC. c, Fluorescence immunohistochemistry of AQP4 and connexin-43 (GJA1) in EC and V1. Automated immunohistochemistry with the peroxidase-DAB method followed by quantification of AQP4- and GJA1-immunoreactive percentage area fraction in EC and V1 formalin-fixed paraffin-embedded (FFPE) sections from n = 11 pathology stage 1 donors (including two donors from this snRNA-seq study) demonstrated a higher expression of these two proteins in EC versus V1, in agreement with the snRNA-seq results. *P = 0.05, **P = 0.0036, two-sided paired t test. Scale bars—EC, 1 mm; V1, 5 mm; insets, 500 μm. d, Volcano plot illustrates the correlation analysis between pTau/tau ratio and astrocyte gene expression levels in pathology stage 1 donors. The x axis represents the correlation coefficient β, while the y axis indicates the FDR (expressed as −log10(FDR)). Genes in red are positively correlated, and those in blue are negatively correlated at an FDR < 0.05 (−log10(FDR) > 1.3), whereas genes in gray were statistically NS. e, Venn diagrams show the number of genes upregulated in EC (EC high) and/or positively correlated with the pTau/tau ratio (top) and the number of genes downregulated in EC (EC low) and/or genes negatively correlated with pTau/tau ratio (bottom). Genes in each intersection are listed in the boxes. NS, not significant.
Fig. 3
Fig. 3. Astrocyte transcriptomic changes along the stereotypical spatial progression of AD.
a, Spatial trajectory gene sets resulting from clustering the n = 504 DEGs between any two adjacent nodes of the AD network from EC to V1. The y axis is the standardized gene expression, with gray lines representing individual genes, whereas the colored lines represent the mean trend. b, The first two vertical bars represent the association between the average expression of each spatial trajectory gene set in each donor and their pTau/tau ratio and Aβ plaque burden (red indicates statistically significant positive correlation; blue indicates statistically significant negative correlation; gray indicates NS). The last two vertical bars illustrate the results of an overlap test between each spatial trajectory gene set and the region-specific EC-high/EC-low and V1-high/V1-low gene sets derived from normal controls in Fig. 2 (red indicates statistically significant overlap with region-specific upregulated gene set; blue indicates statistically significant overlap with region-specific downregulated gene set; gray indicates NS). c, Functional characterization of each spatial trajectory gene set via pathway analysis; some relevant genes of each pathway are displayed on the right. ROS, reactive oxygen species.
Fig. 4
Fig. 4. Astrocyte transcriptomic changes along the temporal progression of AD.
a, Temporal trajectory gene sets resulting from clustering the n = 798 DEGs between any two adjacent pathology stages from early to end stage. The y axis is the standardized gene expression, with gray lines representing individual genes, whereas the colored lines represent the mean trend. b, Functional characterization of each temporal trajectory gene set via pathways analysis; some relevant genes of each pathway are displayed on the right. MAPK, mitogen-activated protein kinase; PPARα, peroxisome proliferator-activated receptor α.
Fig. 5
Fig. 5. Clustering reveals homeostatic, reactive and intermediate astrocytes.
a, UMAP plot of a subsample of 500 astrocyte nuclei from each donor and region, with the colors representing each of the ten astrocyte subclusters resulting from the clustering. b, Bubble plots illustrate the expression z scores of selected marker genes defining the nine astrocyte subclusters. c, Characterization of astrocyte subclusters with pathway enrichment analysis. Bar plots represent the statistical significance (−log10(FDR)) of the functional pathways defining the main astrocyte subclusters. d, Double fluorescence immunohistochemistry for selected markers with thioflavin-S (ThioS) counterstaining in FFPE sections from the temporal association cortex of control (CTRL) and AD donors show reduced expression of some homeostatic markers and increased expression of some reactive markers in GFAP+ astrocytes surrounding some ThioS+ Aβ plaques. Note that representative photomicrographs from at least three CTRL and three AD donors were taken with similar exposure time and display settings for appropriate comparison. Scale bar = 10 μm. e, Violin plots show a statistically significant or marginally significant higher expression of reactive astrocyte markers in AD (pathology groups 3 and 4, n = 7) versus CTRL (pathology group 1, n = 6) centered within and around ThioS+ Aβ plaques. Individual data points are shown as dots, and horizontal lines represent the median value. Note that the gradient of expression of these reactive astrocyte markers from ThioS+ Aβ plaques to the plaque vicinity (≤50 μm) and to plaque-free distant areas (>50 μm from nearest plaque edge) in the AD temporal neocortex, while no such gradient is observed relative to sham plaques from CTRL cortex. Data from AD donors correspond to n = 50 randomly selected ThioS+ Aβ plaques per donor distributed throughout all layers of a temporal neocortex tissue section, their 50 μm halo and n = 50 distant (>50 μm) ROIs of similar size per donor. For CTRL donors, n = 50 sham plaques of similar size per donor, their 50 μm halo and n = 50 ROIs of similar size located far from them (>50 μm) per donor were analyzed. Data were analyzed running mixed-effects models with diagnosis and location as fixed effects and donor ID as random effect to account for within-donor correlation. FGFR, fibroblast growth factor receptor.
Fig. 6
Fig. 6. Dynamics of astrocyte transcriptomic changes.
a, Proportion of astrocyte subclusters across brain regions (n = 22 EC, n = 31 ITG, n = 28 PFC, n = 31 V2 and n = 32 V1). b, Proportion of astrocyte subclusters across pathology stages (n = 30 stage 1, n = 39 stage 2, n = 36 stage 3 and n = 39 stage 4). In both a and b, each dot represents a unique sample (individual + region). Horizontal line in each box represents the median value; boxes extend from the 25th to the 75th percentile of values in each group; whiskers extend from the 5th to the 95th percentile. c, Pseudotime (transcriptomics distance from the origin) is visualized on the UMAP plot with the homeostatic astH0 subcluster as the origin. d, Velocity streams calculated with CellRank on our subsampled astrocytes. e, Heatmap showing the top transitional genes along the pseudotime, with astH (blue) and astR (red) marker genes labeled to the right of the heatmap. Individual cells from subclusters and pseudotime are shown on the top annotation bar.
Fig. 7
Fig. 7. Comparison with publicly available human AD snRNA-seq datasets.
a, UMAP plot of astrocytes from the present study and nine other previously published studies after anchor-based integration onto data in the present study. b, Boxplots showing the frequency of astMet (left) and astTinf (right) in all studies. Exhaustion phenomenon was only observed in the present study. Horizontal line in each box represents the median value; boxes extend from the 25th to the 75th percentile of values in each group; whiskers extend from the 5th to the 95th percentile. Each dot represents one unique sample (individual + region). Present study—n = 30 Braak stages 0–II, n = 39 Braak stages III–IV, n = 36 Braak stage V and n = 39 Braak stage VI in; ref. —n = 24 no-pathology, n = 15 early pathology and n = 9 late-pathology; ref. —n = 6 control and n = 6 AD; ref. —n = 9 control and n = 12 AD; ref. —n = 11 control, n = 11 AD (TREM2-CV) and n = 10 AD (TREM2-R62H); ref. —n = 14 Braak stages 0–II and n = 6 Braak stage VI; ref. —n = 13 control and n = 11 AD; ref. —n = 7 control and n = 10 AD; ref. —n = 4 control and n = 11 AD; SEA-AD study—n = 12 Braak stages 0–II, n = 57 Braak stages III–IV, n = 67 Braak stage V and n = 28 Braak stage VI. Significance was evaluated by a two-sided Welch’s t test. P values were adjusted using the Benjamini–Hochberg method to correct for multiple comparisons when two or more comparisons were conducted within studies. Left, in the present study, Braak stages 0–II versus Braak stage V (**P = 0.0015), Braak stages III–IV versus Braak V (**P = 0.0015) and Braak stage V versus Braak stage VI (*P = 0.018). Right, in the present study, Braak stages 0–II versus Braak stage VI (***P = 5 × 10−4), Braak stages III–IV versus Braak stage VI (**P = 0.003) and Braak stage V versus Braak stage VI (***P = 8 × 10−4). In ref. , control versus AD (TREM2-CV) **P = 0.008, control versus AD (TREM2-R62H) **P = 0.008. c, Heatmap showing the overlap of the astrocyte subcluster marker genes with gene sets from the other studies.

References

    1. Escartin, C. et al. Reactive astrocyte nomenclature, definitions, and future directions. Nat. Neurosci.24, 312–325 (2021). - PMC - PubMed
    1. Verkhratsky, A. & Nedergaard, M. Physiology of astroglia. Physiol. Rev.98, 239–389 (2018). - PMC - PubMed
    1. Orre, M. et al. Isolation of glia from Alzheimer’s mice reveals inflammation and dysfunction. Neurobiol. Aging35, 2746–2760 (2014). - PubMed
    1. Srinivasan, K. et al. Untangling the brain’s neuroinflammatory and neurodegenerative transcriptional responses. Nat. Commun.7, 11295 (2016). - PMC - PubMed
    1. Jiwaji, Z. et al. Reactive astrocytes acquire neuroprotective as well as deleterious signatures in response to Tau and Aβ pathology. Nat. Commun.13, 135 (2022). - PMC - PubMed

LinkOut - more resources