. 2024 Nov 11;7(1):1486.
doi: 10.1038/s42003-024-07172-8.

N-terminal cleavage of cyclophilin D boosts its ability to bind F-ATP synthase

Affiliations

N-terminal cleavage of cyclophilin D boosts its ability to bind F-ATP synthase

Gabriele Coluccino et al. Commun Biol. .

Abstract

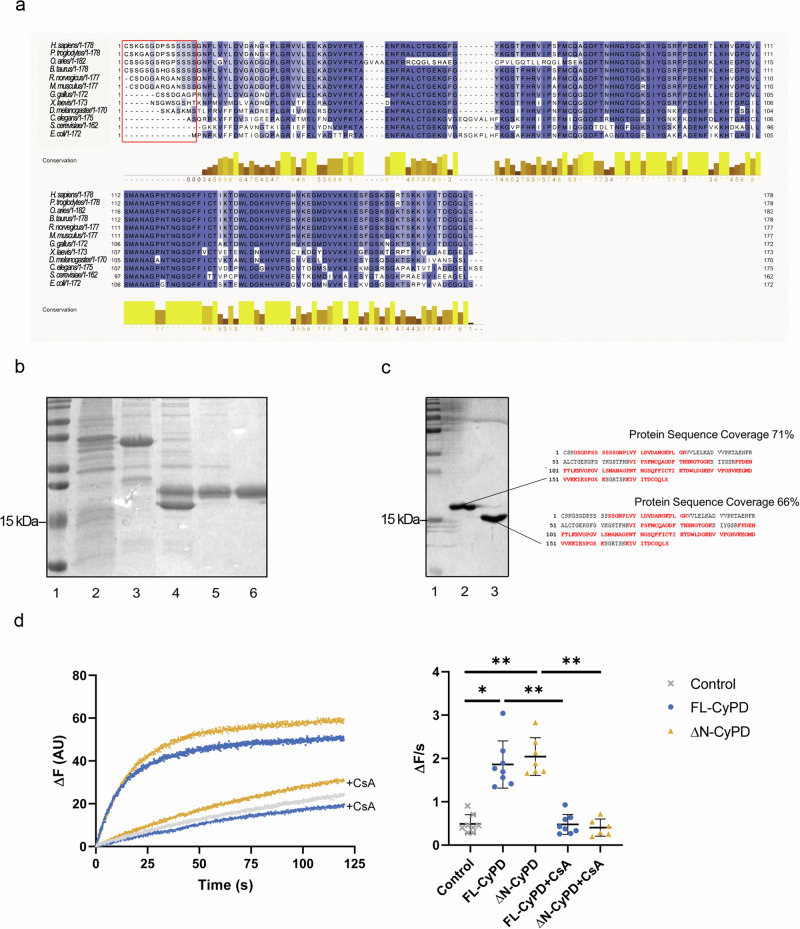
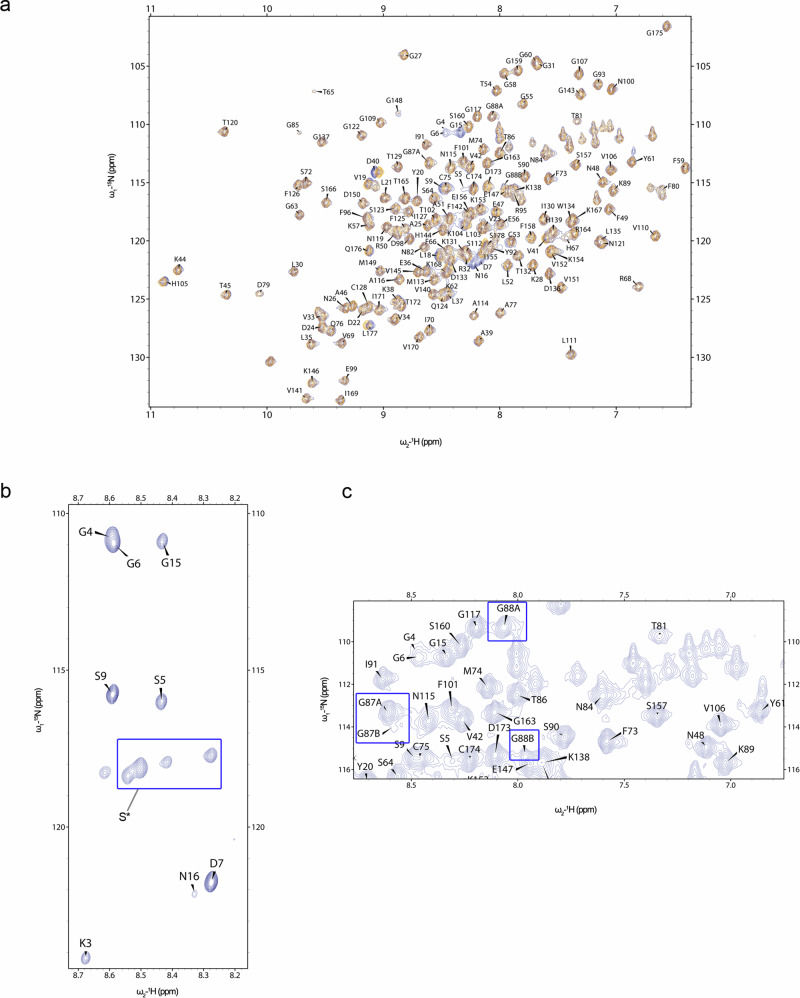
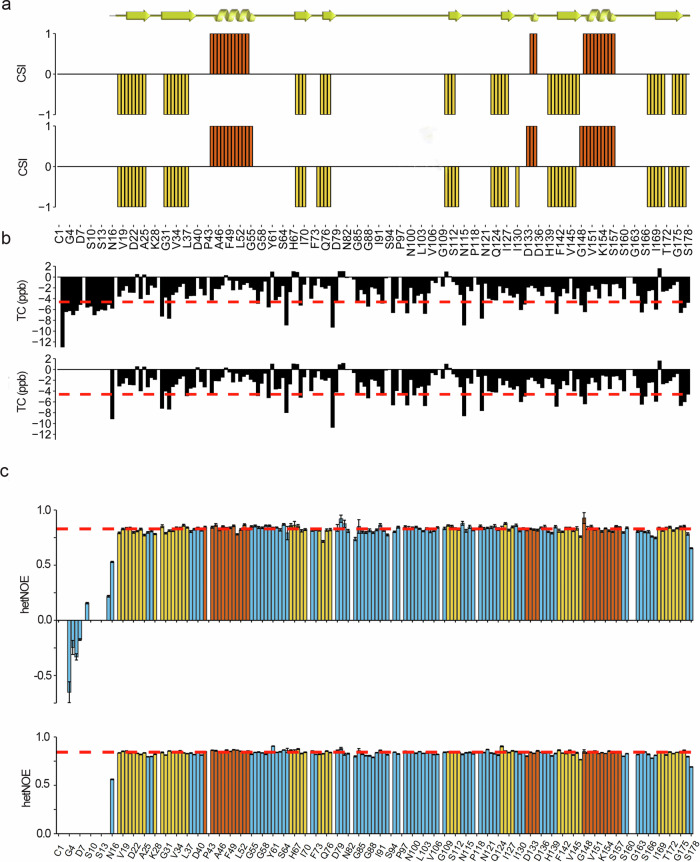
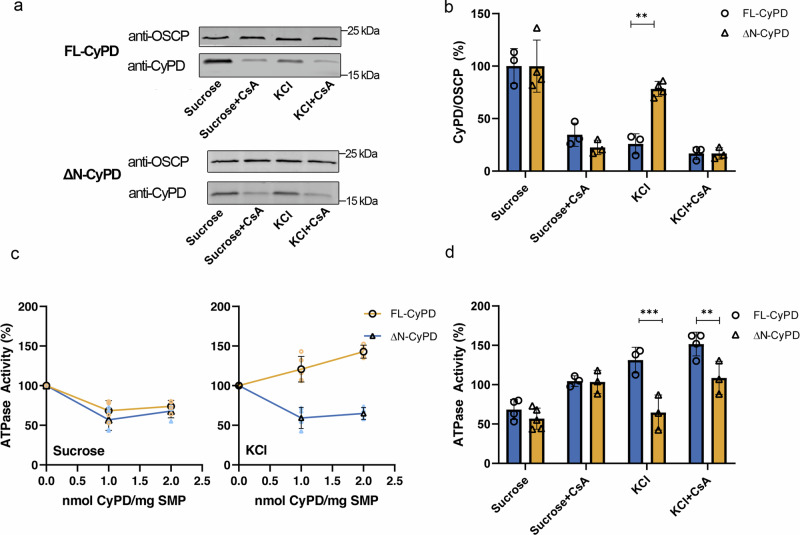
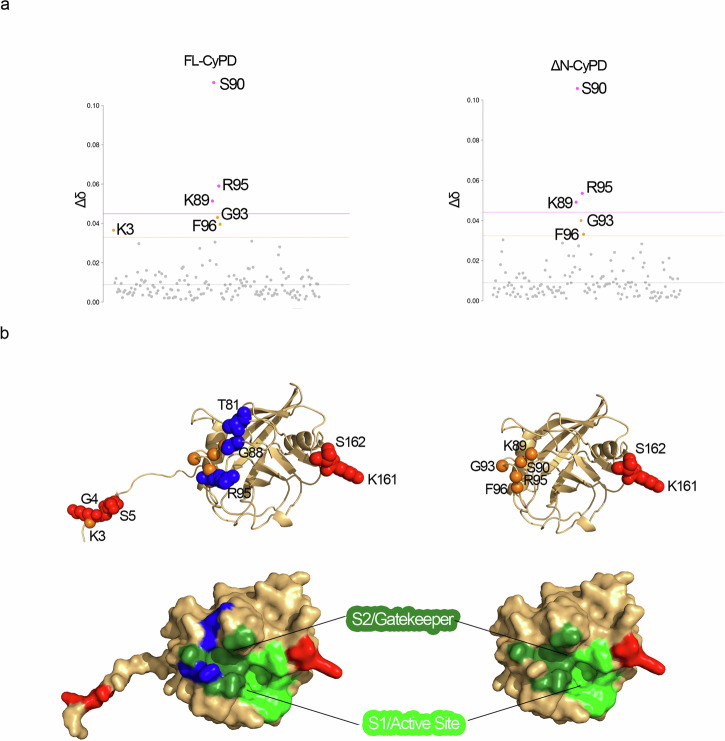
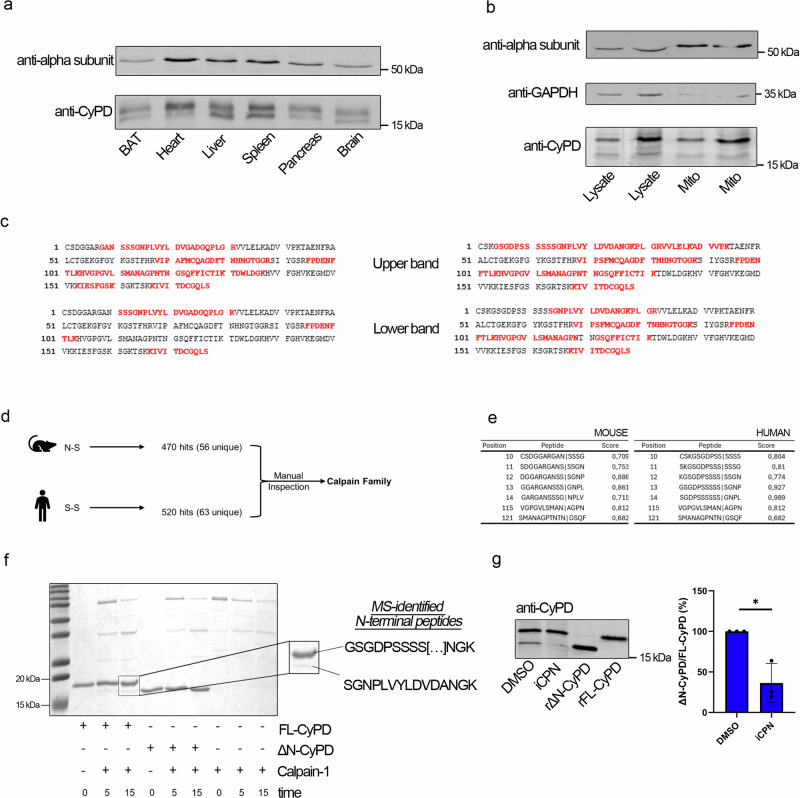
Cyclophilin (CyP) D is a regulator of the mitochondrial F-ATP synthase. Here we report the discovery of a form of CyPD lacking the first 10 (mouse) or 13 (human) N-terminal residues (ΔN-CyPD), a protein region with species-specific features. NMR studies on recombinant human full-length CyPD (FL-CyPD) and ΔN-CyPD form revealed that the N-terminus is highly flexible, in contrast with the rigid globular part. We have studied the interactions of FL and ΔN-CyPD with F-ATP synthase at the OSCP subunit, a site where CyPD binding inhibits catalysis and favors the transition of the enzyme complex to the permeability transition pore. At variance from FL-CyPD, ΔN-CyPD binds OSCP in saline media, indicating that the N-terminus substantially decreases the binding affinity for OSCP. We also provide evidence that calpain 1 is responsible for generation of ΔN-CyPD in cells. Altogether, our work suggests the existence of a novel mechanism of modulation of CyPD through cleavage of its N-terminus that may have significant pathophysiological implications.


Conflict of interest statement

Competing interests The authors declare no competing interests.

Figures

Fig. 1
Fig. 1. CyPD sequences and generation of full-length and truncated variants.
a Alignment of CyPD in different species. Residues are color-coded on a blue scale, from lightest to darkest, based on the percentage of conservation, while the red box highlights the N-terminal residues. b SDS-PAGE followed by Coomassie staining showing the principal steps of FL-CyPD production in E. coli strain BL21(DE3)pLysS. Lane 1, molecular weight markers; Lane 2, bacterial pellet after sonication; Lane 3, SUMO-CyPD eluted from the nickel-resin; Lane 4, SUMO and CyPD after the enzymatic reaction with Ulp1; Lane 5, flow through from the second incubation with nickel resin containing free CyPD and contaminants; Lane 6, purified CyPD after cationic exchange chromatography. c Mass spectrometry analysis of recombinant FL-CyPD (Lane 2) and ΔN-CyPD (Lane 3) separated on 15% SDS-PAGE (Lane 1, molecular weight markers) stained with colloidal Coomassie (left panel). Peptides from the bands of two recombinant proteins were sequenced and matched against human mature CyPD sequence (right panel). The univocally sequenced and matched peptides are shown in red, while residues in black represent non-detected ones (representative experiment out of five). Sequence coverages are indicated. d PPIase activity of recombinant FL-CyPD and ΔN-CyPD. PPIase activity was assessed monitoring the intrinsic fluorescence of RNase T1 during its refolding. Left panel: ΔF during time of the spontaneous reaction (grey line), compared with the refolding catalysed by FL-CyPD (blue) or ΔN-CyPD (orange), with or without 1:10 CsA. Representative traces of 4 different experiments. Right panel: slopes of the linear part of the traces were interpolated and used as a probe of FL-CyPD or ΔN-CyPD catalytic activity. Data were analysed according to the Kruskal-Wallis test followed by Dunn’s multiple comparisons test (**p < 0.01; *p < 0.05).
Fig. 2
Fig. 2. NMR chemical shifts assignment of human FL-CyPD and ΔN-CyPD.
a Overlay of the 1H-15N HSQC spectra (protein fingerprints) of FL-CyPD (blue) and ΔN-CyPD (orange) acquired at 298 K. b 1H-15N HSQC spectrum of FL-CyPD at 283 K. Counter levels were reduced to show the higher intensity of the signals from the N-terminal tail compared to the other residues. c Representative image from the 1H-15N HSQC spectrum acquired at 298 K of FL-CyPD showing the double forms of G87 and G88. Samples consisted of 500 μM CyPD in 20 mM NaPi pH 7.0. Spectra were acquired in a 700 MHz Bruker Spectrometer.
Fig. 3
Fig. 3. Structural and dynamical features of human FL-CyPD and ΔN-CyPD.
a Secondary structure of human FL-CyPD (upper barplot) and ΔN-CyPD (lower barplot) derived from the assigned main chain NMR chemical shifts according to the chemical shift indexing performed by TALOS-N (+ 1=helix, red; −1=strand, yellow; 0=random coil). The comparison with the crystallographic secondary structure, graphically represented above (ribbon=helix, arrow=strand), is also shown. b Temperature coefficients for each main chain amide group from FL-CyPD (upper barplot) and ΔN-CyPD (lower barplot). The plot is aligned with the one presented in (a), so the x-axis (representing the primary sequence) is the same. Red dashed line represents the limit above which a given amide group is considered involved in a H-bond (−4.6 ppb). c Barplots representing the hetNOE for each residue within FL-CyPD (upper barplot) and ΔN-CyPD (lower barplot). Bars are coloured according to the crystallographic secondary structure (blue=random coil; red=helix; yellow=strand). The red dotted lines represent the mean hetNOE of the secondary structure elements (0.828 for FL-CyPD, 0.842 for ΔN-CyPD). Error bars have been defined in the methods section.
Fig. 4
Fig. 4. Binding and modulation of F-ATP synthase by FL-CyPD and ΔN-CyPD.
a Pig heart SMP depleted of endogenous CyPD (1 mg/ml) were incubated at 25°C for 15 min with 1 nmol of either FL-CyPD or ΔN-CyPD/mg SMP under two different conditions, namely in the sucrose-based buffer (250 mM sucrose) or the KCl-based buffer (125 mM KCl) supplemented with 10 mM KH2PO4, in the presence or absence of 2 μM CsA. Immunoprecipitation of OSCP was performed, followed by Western blotting with anti-OSCP or anti-CyPD antibodies (representative experiment out of three). b Each immunodetected band was analyzed by densitometry, and the ratio between the peak area of CyPD (FL-CyPD or ΔN-CyPD) and that of the corresponding OSCP subunit was measured and expressed relative to the ratio obtained in the sucrose buffer in the absence of CsA, which was taken as 100% (values are mean ± S.D. of at least three independent experiments). c ATPase activity of pig heart SMP depleted of endogenous CyPD and exposed to different concentrations of either FL-CyPD (◯) or ΔN-CyPD (△) in the sucrose-based buffer (left panel) or the KCl-based buffer (right panel). The oligomycin-sensitive ATP hydrolysis rate was determined spectrophotometrically. Mean ± S.D. values of at least four independent experiments are shown in black. d ATPase activity of pig heart SMP exposed to 1 nmol/mg SMP of either FL-CyPD or ΔN-CyPD in either sucrose-based buffer or KCl-based buffer in the presence or absence of 2 μM CsA. The ATPase activity in the absence of FL-CyPD or ΔN-CyPD was taken as 100%, and reported values are mean ± S.D. of at least 3 independent experiments. Data were analysed according to the two-way ANOVA analysis followed by Bonferroni’s multiple comparisons test (**p < 0.01; ***p < 0.005).
Fig. 5
Fig. 5. Effect of KCl on structure and dynamics of FL-CyPD and ΔN-CyPD.
a CSP analysis of FL-CyPD (left panel) and ΔN-CyPD (right panel) after the addition of 150 mM KCl. Data points are coloured according to the chemical shift perturbation: pink points have a Δδ higher than Δδ¯+3 S.D. (pink dotted line), orange points have a Δδ higher than Δδ¯+2 S.D. (orange dotted line), grey points are non-perturbed residues. b KCl-induced variations plotted on the structures of FL-CyPD (left, Alphafold2 prediction) and ΔN-CyPD (right, PDB 2Z6W). Variations of chemical shifts shown in (a) are reported as orange spheres of the amide nitrogen of the corresponding residues. Lineshape variations were determined either considering the signal intensity or the integral at 0 mM KCl and at 150 mM KCl, only for those peaks that did not coalesce throughout the titration. Residues whose lineshape was significantly affected by salt addition are represented as spheres coloured in blue (signal intensity decrease) or red (signal intensity increase). The lower panel shows the surface representations of the above structures, showing the localization of the S2/gatekeeper and S1/active site regions and residues affected by KCl colored as above.
Fig. 6
Fig. 6. Detection of a truncated form of CyPD in cells and role of calpain-1 in CyPD cleavage.
a Western blot analysis of CyPD and F-ATP synthase α-subunit in lysates from different murine tissues. For each well, 30 μg of proteins were loaded. b Western blot analysis of CyPD and F-ATP synthase α-subunit in total lysates (Lysate, 10 μg and 20 μg in the first and second lane, respectively) or crude mitochondrial preparations (Mito, 5 μg and 10 μg in the third and fourth lane, respectively) from primary human skin fibroblasts. The cytosolic marker glyceraldehyde-3-phosphate dehydrogenase (GAPDH) was almost undetectable in the mitochondrial fraction. c Mass spectrometry analysis of the upper band at ~19 kDa and of the lower band at ~18 kDa from murine heart lysates detected by anti-CyPD antibodies (left panel) or human skin fibroblasts (right panel). Peptides were sequenced and matched against murine (left panel) or human (right panel) mature CyPD sequence. The univocally sequenced and matched peptides are shown in red, while residues in black represent non-detected ones (representative experiment out of five). For murine samples, sequence coverages were 51% ± 9% for the 19-kDa band and 37% ± 21% for the 18-kDa band. For human samples, sequence coverages were 39% ± 16% for the 19-kDa band and 30% ± 15% for the 18-kDa band. d Workflow for the interrogation of the MEROPS database and its analysis. The murine (NS) and human (SS) cleavage sites were used as a query in the search for proteases. Then, among the different hits revealed by the database, a manual inspection was performed. Proteins of the calpain family were found as the most interesting hits. e Results for the GPS-CCD 1.0 analysis for mouse and human mature CyPD sequence. Each table shows the most probable target sites for calpain 1, assigning to each putative cleavage site a score. Letters in bold-red show the actual cleavage sites. f SDS-PAGE/Coomassie staining following the incubation of FL-CyPD or ΔN-CyPD with Calpain 1 (CPN1) at different times (0 min, 5 min, 15 min). On the right, a magnification of the enzymatic products of FL-CyPD+CPN1 after 15 minutes is shown. The two bands were manually excised for mass spectrometry analysis. The N-terminal peptide detected in each band is shown. g Western blot analysis of CyPD in total lysates from HEK293 cells treated for 30 min with 50 μM of the broad-spectrum calpain inhibitor PD150606 or with the DMSO concentration as vehicle control. The ratio between the lower and the higher band was quantified by densitometry and is reported as mean ± S.D. of three independent experiments. Data were analysed according to the one-sample t-test (*p = 0.044).

References

    1. Daum, S. et al. Isoform-specific inhibition of cyclophilins. Biochemistry48, 6268–6277 (2009). - PMC - PubMed
    1. Wang, P. & Heitman, J. The cyclophilins. Genome Biol.6, 226 (2005). - PMC - PubMed
    1. Ke, H. M., Zydowsky, L. D., Liu, J. & Walsh, C. T. Crystal structure of recombinant human T-cell cyclophilin A at 2.5 A resolution. Proc. Natl Acad. Sci. USA.88, 9483–9487 (1991). - PMC - PubMed
    1. Kajitani, K. et al. Crystal structure of human cyclophilin D in complex with its inhibitor, cyclosporin A at 0.96-Å resolution. Proteins70, 1635–1639 (2007). - PubMed
    1. Davis, T. L. et al. Structural and biochemical characterization of the human cyclophilin family of peptidyl-prolyl isomerases. PLoS Biol.8, e1000439 (2010). - PMC - PubMed

MeSH terms

LinkOut - more resources