. 2025 Mar;32(3):431-440.
doi: 10.1038/s41594-024-01414-3. Epub 2024 Nov 11.

Structural basis of the mechanism and inhibition of a human ceramide synthase

Affiliations

Structural basis of the mechanism and inhibition of a human ceramide synthase

Tomas C Pascoa et al. Nat Struct Mol Biol. 2025 Mar.

Abstract

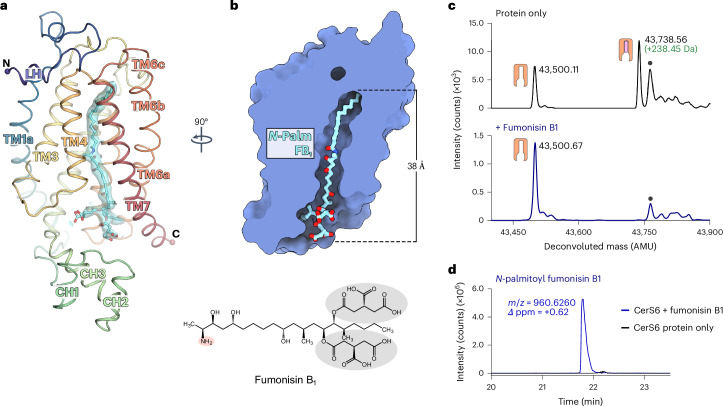
Ceramides are bioactive sphingolipids crucial for regulating cellular metabolism. Ceramides and dihydroceramides are synthesized by six ceramide synthase (CerS) enzymes, each with specificity for different acyl-CoA substrates. Ceramide with a 16-carbon acyl chain (C16 ceramide) has been implicated in obesity, insulin resistance and liver disease and the C16 ceramide-synthesizing CerS6 is regarded as an attractive drug target for obesity-associated disease. Despite their importance, the molecular mechanism underlying ceramide synthesis by CerS enzymes remains poorly understood. Here we report cryo-electron microscopy structures of human CerS6, capturing covalent intermediate and product-bound states. These structures, along with biochemical characterization, reveal that CerS catalysis proceeds through a ping-pong reaction mechanism involving a covalent acyl-enzyme intermediate. Notably, the product-bound structure was obtained upon reaction with the mycotoxin fumonisin B1, yielding insights into its inhibition of CerS. These results provide a framework for understanding CerS function, selectivity and inhibition and open routes for future drug discovery.


Conflict of interest statement

Competing interests: C.S.T., M.T., S.T., A.P. and G.S. are employees of Boehringer Ingelheim Pharma, GmbH & Co. KG. The other authors declare no competing interests.

Figures

Fig. 1
Fig. 1. Cryo-EM structure of human CerS6.
a, Cryo-EM map of the CerS6 dimer (blue) with one copy of Nb22 (gray) bound to each CerS6 monomer. b, Overall cartoon cylinder representation of the CerS6 dimer structure. One of the monomers is rainbow-colored from purple (N terminus) to red (C terminus). LH, luminal helix. c, Schematic representation of the CerS6 seven-TM helix topology. d, Cartoon representation of the transmembrane domain of a CerS6 monomer. The covalent acyl–imidazole species is shown in stick representation (acyl chain, pink carbon atoms) and the Coulombic potential map for this covalent species is shown as a pink transparent surface. The Hox-like domain was omitted for clarity. e, Denaturing intact protein MS analysis of purified CerS6 protein, revealing the presence of a covalent modification (+238.45 Da), which matches the expected mass shift corresponding to covalent attachment of a palmitoyl (C16:0) chain. This adduct peak was present in all purifications tested (n = 6). AMU, atomic mass units. Cyto, cytoplasm. Source data
Fig. 2
Fig. 2. CerS6 contains an acyl chain-binding tunnel buried deep in the membrane.
a, Cutaway molecular surface representation of the CerS6 TM region, revealing the presence of a long central cavity spanning the entire length of the protein. The palmitoyl chain covalently attached to His211 is bound in a narrow tunnel on the ER luminal half of the central cavity. b, Coulombic potential map in the region around the covalent linkage of the acyl chain to His211. ce, CerS6’s acyl-binding tunnel, viewed from the membrane plane (c and d) or the ER face (e). Side chains lining and capping the tunnel are shown as sticks. Hydrogen bonds in the active site are shown as dashed lines.
Fig. 3
Fig. 3. Unraveling the catalytic mechanism of CerS6 using MS.
a, Chemical structures of the natural long-chain base substrate sphinganine (dihydrosphingosine) and the drug FTY720 (fingolimod). The homologous primary amines are highlighted in salmon. b, Intact mass analysis of protein samples after incubation in the absence of substrates (black) or in the presence of sphinganine (green) (n = 3 biological replicates). Replicate traces are provided in Extended Data Fig. 6. Deconvoluted mass peaks are indicated as follows: unmodified enzyme, orange icon; covalent acyl–enzyme species, orange and pink icon; background species present in all traces, gray circle. c, LC–HRMS detection of the reaction products. EICs are shown for the expected [M + H]+ ions of each of the reaction products after incubation of the acyl–enzyme intermediate with sphinganine (C16:0 dihydroceramide, green) or FTY720 (N-palmitoyl FTY720, orange). EICs obtained after incubation in the absence of substrates are shown in black. d, CerS6’s active site, viewed from the plane of the membrane. The central cavity is shown as a transparent gray surface, highlighting the presence of a side pocket (highlighted in green) adjacent to the acyl carbonyl. Hydrogen bonds are shown as dashed lines. e, Mutational analysis of the CerS6 active site by comparison of the C16:0 dihydroceramide synthase activity of WT and active site mutants (n = 3 independent biological replicates). Gray bars correspond to the mean of the biological replicates. Data points represent each biological replicate, corresponding to the mean of four technical replicates. Error bars show the s.e.m. Source data
Fig. 4
Fig. 4. Cryo-EM structure of CerS6 in complex with N-palmitoyl FB1.
a, Cartoon representation of CerS6 with bound N-palmitoyl FB1 (shown as sticks; cyan carbon atoms). The cryo-EM density of the bound product is shown as a transparent cyan surface. b, Cutaway molecular surface representation, revealing that the N-palmitoyl FB1 species occupies the entire length of the central cavity. The Hox-like domain was omitted for clarity. c, Intact mass analysis of protein samples after incubation in the absence of substrates (black) or in the presence of the mycotoxin FB1 (blue) (n = 3 biological replicates). Replicate traces are provided in Extended Data Fig. 6. d, LC–HRMS detection of N-palmitoyl FB1. The EIC for its expected [M + H]+ ion is shown after incubation of the acyl–enzyme intermediate with FB1 (blue) or in the absence of the toxin (black). Inset, chemical structure of FB1. Its primary amine (salmon circle) and TCA (gray circles) groups are highlighted. Source data
Fig. 5
Fig. 5. Binding mode of N-palmitoyl FB1.
a, Close-up view of the CerS6 active site in the covalent acyl–enzyme intermediate and N-palmitoyl FB1-bound states, showing the transfer of the palmitoyl chain from His211 to the toxin. b, Cytoplasmic portion of the central cavity, viewed from the membrane plane. Residues lining the cavity are shown as sticks. Polar interactions between the carboxylates of the TCA groups of FB1 and positively charged residues on TM2 and TM7 are shown as dashed lines. c, Active site, viewed from the plane of the membrane. d, Polar and nonpolar surfaces on the cytoplasmic half of the central cavity. Cutaway molecular surface view, showing that the hydrocarbon chain of FB1 interacts with the large hydrophobic face formed by TM5–TM7.
Fig. 6
Fig. 6. Proposed double-displacement (ping-pong) mechanism of CerSs.
Initially, the acyl-CoA substrate binds with the acyl chain buried deep within the central tunnel and the CoA moiety sitting near the cytoplasmic entrance to the central cavity. In the first step, the nucleophilic attack of His211 on the acyl-CoA thioester carbonyl results in thioester cleavage, covalent acyl–imidazole intermediate formation and release of CoA. Subsequently, the long-chain sphingoid base substrate binds with its hydrocarbon chain interacting with the hydrophobic face of the central cavity and its amino alcohol moiety sitting in the side pocket in the active site. In the second step of the reaction, the primary amine of the long-chain base attacks the acyl–imidazole intermediate, leading to covalent intermediate breakdown and formation of the final N-acyl sphingoid base (ceramide) product.
Extended Data Fig. 1
Extended Data Fig. 1. Properties of purified CerS6.
a, Elution profile of CerS6 (Met1-Asp350). The collected dimer peak is shaded in gray. b, SDS-PAGE analysis of the purified dimeric (D) and monomeric (M) SEC peak fractions. Similar results were obtained for all purifications tested (n = 6). c, Elution profile of CerS6 (Met1-Asp350) in complex with nanobody 22. The putative dimer peak, shaded in gray, was pooled and concentrated for single particle cryo-EM. d, SDS-PAGE analysis of the SEC-purified CerS6 dimer and nanobody 22 complex. Similar results were obtained for all purifications tested (n = 3). e, NanoDSF screening of CerS inhibitors. n = 3 technical replicates. Error bars show the SEM. f-g, Denaturing intact protein MS analysis of purified CerS6. f, Deconvoluted mass spectra of wild-type CerS6 (Met1-Asp350). The expected mass of the untagged, unmodified, truncated enzyme based on the sequence is 42,373.53 Da. The observed lower mass peak (42,488.76 Da) corresponds to loss of the initiator methionine (−131.20 Da), acetylation of the new N-terminus ( + 42.04 Da), and addition of an N-linked GlcNAc ( + 203.19 Da). An additional, higher intensity, deconvoluted mass peak (43,502.71 Da) corresponds to the addition of a core N-linked glycan (theoretical +1217.09 Da) in place of simply the N-linked GlcNAc. Mass shifts corresponding to the mass of a palmitoyl group (theoretical +238.41 Da) are labelled in blue. Additional deconvoluted mass peaks corresponding to the addition of an unknown modification of approximately +264 Da on top of the glycosylation or glycosylation + palmitoylation peaks are labelled with gray dots. g, Deconvoluted mass spectra obtained for the purified CerS6 N18Q mutant which removes the only identified glycosylation site. The expected mass of the untagged, unmodified, truncated CerS6 N18Q enzyme based on the sequence is 42,387.56 Da. The observed lower mass peak (42,294.87 Da) corresponds to loss of the initiator methionine followed by acetylation of the new N-terminus. The +239.80 Da mass shift, corresponding to palmitoylated protein, is labelled in blue. Source data
Extended Data Fig. 2
Extended Data Fig. 2. Cryo-EM data processing: CerS6-Nb22 covalent intermediate dataset.
a, Cryo-EM data processing flowchart. b, Representative micrograph. c, 2D classes obtained prior to 3D classification. d, Final 3D reconstruction, colored by local resolution. e, Overlay of the structural model (tan) and the AlphaFold2 monomer prediction (gray). The cryo-EM maps are shown as blue (unsharpened map) or outline (blurred map; Bblur = 200 Å2) surfaces. A purple arrow indicates the manual adjustment of the position of the Hox-like domain into the experimental blurred map. f-g, Cryo-EM map (f) before and (g) after CTF refinement, Bayesian polishing and 3D classification in Relion. h, Angular distribution of particles used in the final reconstruction. i, Fourier Shell Correlation (FSC) plots, indicating overall map resolution (GSFSC = 0.143) and a model-to-map FSC curve. j, Sharpened cryo-EM map (contoured at 4.6σ) overlaid on the final model.
Extended Data Fig. 3
Extended Data Fig. 3. Cryo-EM map quality in the CerS6-Nb22 datasets.
a, Fit of the Hox-like domain into the unsharpened cryo-EM map (blue surface). b-d, Cryo-EM density in the regions around the modelled ligands. The respective sharpened cryo-EM maps (blue mesh) and Servalcat Fo-Fc difference maps (obtained by omitting the acyl-imidazole and the N-palmitoyl fumonisin B1 species from the models; green mesh) are overlaid on the models. e, Cryo-EM density for the bound lipid molecule, modelled as phosphatidylcholine (purple carbon atoms).
Extended Data Fig. 4
Extended Data Fig. 4. Transmembrane helix topology of CerS6.
a, The 6-TM barrel formed by TM2-7 of CerS6 is composed of two 3-TM units (TM2-4, blue; TM5-7, red), arranged as inverted repeats. b, Comparison of the transmembrane helix topology of the 6-TM barrels of CerS6, ELOVL7, HACD4 and TMEM120A (TACAN). c, Structural alignment of CerS6 and ELOVL7 reveals that their histidine pairs are structurally homologous. The acyl chain linked to His211 in the CerS6 covalent intermediate structure is shown in pink.
Extended Data Fig. 5
Extended Data Fig. 5. Cryo-EM data processing: CerS6-Nb02 covalent intermediate dataset.
a, Cryo-EM data processing flowchart. b, Representative micrograph. c, 2D classes obtained prior to 3D classification. d, Final 3D reconstruction, colored by local resolution. e, Angular distribution of particles used in the final reconstruction. f, Fourier Shell Correlation (FSC) plots, indicating overall map resolution (GSFSC = 0.143) and a model-to-map FSC curve. g, Coulombic potential map in the region around the covalent linkage of the acyl chain to His211. h, Sharpened cryo-EM map (contoured at 4.6σ) overlaid on the final model.
Extended Data Fig. 6
Extended Data Fig. 6. Monitoring the reaction of the covalent acyl-enzyme intermediate by mass spectrometry.
a-b, Purified CerS6 was incubated in the presence and absence of substrates prior to liquid chromatography – electrospray ionization – mass spectrometry (LC-ESI-MS) intact mass analysis. a, Deconvoluted mass spectra are shown for CerS6 incubated in the absence of substrates (protein only), with 200 µM sphinganine, or with 200 µM fumonisin B1. Deconvoluted mass peaks are indicated as follows: unmodified enzyme, orange icon; covalent acyl-enzyme species, orange and pink icon; background species ( + 264 Da) present in all traces, gray circle. Spectra are shown for 3 biological replicates. b, Deconvoluted mass spectra shown for CerS6 incubated in the presence and absence of 600 µM FTY720. Spectra are shown for 2 biological replicates. c-d Structural characterization of N-palmitoyl FTY720 species by LC-ESI-MS/MS. c, Structure of the proposed N-palmitoyl FTY720 reaction product, annotated with the m/z values of the daughter ions observed in panel d. d, MS/MS spectrum obtained from the fragmentation of the [M + H]+ ion of N-palmitoyl FTY720 (m/z 546.4881) using a collision-induced dissociation energy of 14 V. Proposed relationships between the observed m/z peaks are indicated. Source data
Extended Data Fig. 7
Extended Data Fig. 7. Multiple sequence alignment of human (CerS1-6) and S. cerevisiae (Lag1p, Lac1p) ceramide synthases.
Blue circles below the alignment indicate the active site residues.
Extended Data Fig. 8
Extended Data Fig. 8. Cryo-EM data processing: CerS6-Nb22 N-palmitoyl FB1-bound dataset.
a, Cryo-EM data processing flowchart. b, Representative micrograph. c, 2D classes obtained prior to 3D classification. d, Final 3D reconstruction, colored by local resolution. e, Fourier Shell Correlation (FSC) plots, indicating overall map resolution (GSFSC = 0.143) and a model-to-map FSC curve. f, Angular distribution of particles used in the final reconstruction. g, Sharpened cryo-EM map (contoured at 4.6σ) overlaid on the final model.
Extended Data Fig. 9
Extended Data Fig. 9. CerS6 dynamics and N-palmitoyl fumonisin B1 interactions in simulations.
a, Average root-mean-square deviation (RMSD) values of Cα atoms from atomistic simulations of the covalent intermediate and N-palmitoyl fumonisin B1-bound states. Traces where the Hox-like domain residues (70-126) were excluded from the RMSD calculation are shown to highlight the stability of the transmembrane region. b, Root-mean-square fluctuation (RMSF) values by residue (Cα atoms). RMSD and RMSF values shown are averaged over 4 ×100 ns atomistic simulations. c, N-palmitoyl FB1 stabilises the CerS6 structure. RMSF values from the simulations are mapped onto the structures, revealing a reduction in the overall dynamics of the protein upon binding the reaction product N-palmitoyl FB1, particularly in the Hox-like domain, the TM3-4 loop, TM6, and TM7. d, Analysis of the polar interactions between CerS6 and FB1 during the simulations. Values shown correspond to the percentage of snapshots (taken every 100 ps during the simulations) containing CerS6-FB1 polar interactions at each residue. Residues are coloured by the frequency of polar interactions with FB1 (cyan sticks). Source data
Extended Data Fig. 10
Extended Data Fig. 10. Cartoon representation of the proposed mechanism of ceramide synthases and their inhibition by FB1.
a, CerS6 initially reacts with an acyl-CoA substrate, forming a covalent acyl-enzyme intermediate and releasing CoA as the first product. Subsequently, the reaction of the acyl-enzyme intermediate with sphinganine produces ceramide as the final product. Ceramide dissociates from the enzyme, which can then react with another acyl-CoA substrate to re-start the cycle. b, Reaction of the covalent acyl-enzyme intermediate species with FB1 results in the formation of an N-acyl FB1 product. This inhibitory product remains tightly bound in the central cavity, forming polar interactions near the cytoplasmic entrance, and preventing recycling of the enzyme.

References

    1. Summers, S. A., Chaurasia, B. & Holland, W. L. Metabolic messengers: ceramides. Nat. Metab.1, 1051–1058 (2019). - PMC - PubMed
    1. Turpin, S. M. et al. Obesity-induced CerS6-dependent C16:0 ceramide production promotes weight gain and glucose intolerance. Cell Metab.20, 678–686 (2014). - PubMed
    1. Apostolopoulou, M. et al. Specific hepatic sphingolipids relate to insulin resistance, oxidative stress, and inflammation in nonalcoholic steatohepatitis. Diabetes Care41, 1235–1243 (2018). - PubMed
    1. Hajduch, E., Lachkar, F., Ferre, P. & Foufelle, F. Roles of ceramides in non-alcoholic fatty liver disease. J. Clin. Med.10, 792 (2021). - PMC - PubMed
    1. Hammerschmidt, P. & Brüning, J. C. Contribution of specific ceramides to obesity-associated metabolic diseases. Cell. Mol. Life Sci.79, 395 (2022). - PMC - PubMed

MeSH terms

LinkOut - more resources