. 2025 Mar;32(3):571-584.
doi: 10.1038/s41594-024-01401-8. Epub 2024 Nov 11.

Mechanism for Vipp1 spiral formation, ring biogenesis, and membrane repair

Affiliations

Mechanism for Vipp1 spiral formation, ring biogenesis, and membrane repair

Souvik Naskar et al. Nat Struct Mol Biol. 2025 Mar.

Abstract

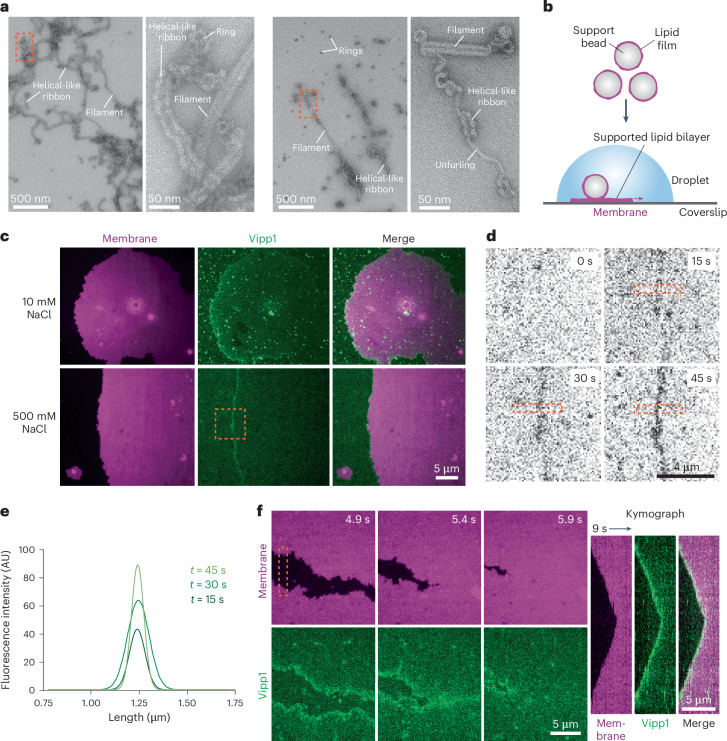
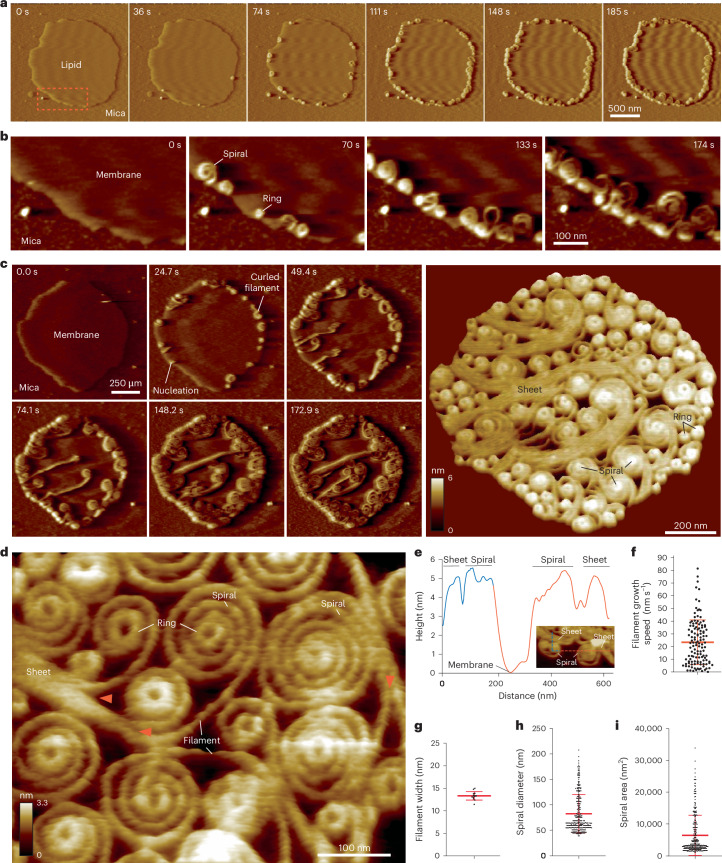
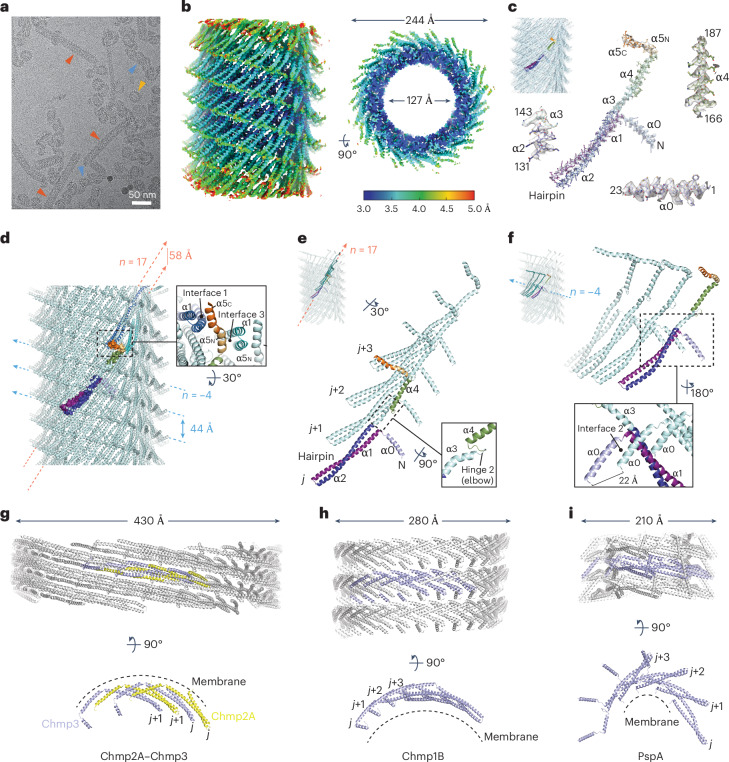
The ESCRT-III-like protein Vipp1 couples filament polymerization with membrane remodeling. It assembles planar sheets as well as 3D rings and helical polymers, all implicated in mitigating plastid-associated membrane stress. The architecture of Vipp1 planar sheets and helical polymers remains unknown, as do the geometric changes required to transition between polymeric forms. Here we show how cyanobacterial Vipp1 assembles into morphologically-related sheets and spirals on membranes in vitro. The spirals converge to form a central ring similar to those described in membrane budding. Cryo-EM structures of helical filaments reveal a close geometric relationship between Vipp1 helical and planar lattices. Moreover, the helical structures reveal how filaments twist-a process required for Vipp1, and likely other ESCRT-III filaments, to transition between planar and 3D architectures. Overall, our results provide a molecular model for Vipp1 ring biogenesis and a mechanism for Vipp1 membrane stabilization and repair, with implications for other ESCRT-III systems.


Conflict of interest statement

Competing interests: The authors declare no competing interests.

Figures

Fig. 1
Fig. 1. Vipp1 is a membrane sensor recruited to highly curved and perturbed membranes.
a, Left pair, NS EM images showing Vipp1 purified in low-salt (10 mM NaCl) buffer. The area in the red dashed box is enlarged in the second image. Right pair, Vipp1 in a 500 mM NaCl buffer. The area in the red dashed box is enlarged in the second image. The unfurling of the helical-like ribbon is shown. Experiments were repeated independently more than three times. b, Preparation of SLBs. c, Fluorescent microscopy showing Vipp1Alexa488 recruitment to the highly curved membrane edge. Vipp1Alexa488 recruitment to the membrane edge is unaffected by ionic strength. The experiment was repeated independently three times. The area in the dashed box is shown in d. d, Timecourse showcasing dynamic Vipp1Alexa488 recruitment to the membrane edge. e, Fitted curves of the fluorescence plot profile show increasing Vipp1Alexa488 recruitment to the membrane edge. Measurements were collected from the area in the dashed box in d. f, Timecourse showing fusion of neighboring SLBs with Vipp1Alexa488 lost from the membrane merge point. The kymograph (right) is related to the region enclosed by the dashed box. The experiment was repeated independently three times.
Fig. 2
Fig. 2. Vipp1 assembles dynamic networks of spirals, rings and sheets on membrane.
a, F-AFM phase timecourse showing Vipp1 recruitment to the highly curved edge of membrane patches. Scan rate, 70 Hz; 256 × 256 pixels. The area in the dashed box is enlarged in b. b, Spiral and ring formation localized to the membrane edge. Scan rate, 70 Hz; 256 × 256 pixels. c, Left, phase timecourse showcasing a dense network of sheets, spirals, and rings that ultimately cover the entire membrane plane. Right, average of six F-AFM height images. Scan rate, 120 Hz; 256 × 256 pixels. d, Average F-AFM height image showing Vipp1 sheet, spiral, and ring detail. Red arrows mark the sheet branching into filaments ~13 nm wide. Scan rate, 20 Hz; 256 × 256 pixels. e, Vipp1 sheet and spiral filament height offset from the membrane. fi, Quantification of Vipp1 filament and spiral characteristics. n = 124, 13, 278, and 278 independent measurements for panels f, g, h, and i, respectively. Error bars show one s.d. of the mean. Source data
Fig. 3
Fig. 3. Vipp1 spirals form protruding central rings that abscise.
a, F-AFM phase timecourse showing ring biogenesis from an exponential-shaped spiral (see Extended Data Figure 1a). Scan rate, 150 Hz; 256 × 213 pixels. b, F-AFM timecourse showing how spiral and ring maturation correlates with increased filament offset from the membrane. Blue and red dashed lines indicate plotted height profile. Blue and red arrows indicate equivalent positions between AFM images and in-plane distance plot. Scan rate, 20 Hz; 256 × 183 pixels. c, Quantification of height difference between Vipp1 ringsLS and surrounding spiral filaments. Data were derived from n = 16 independent measurements. Error bars show one s.d. of the mean. d, Schematic showing spiral and ring biogenesis pathways. e, Single frame (left) and F-AFM height images averaged together (right), showcasing the different types of Vipp1 ring observed. For RingsLS, the height scale reflects the difference between the central ring and neighboring spiral. f, Quantification of Vipp1 ring diameters, similar to those in e. Data derived from n = 20, 39, and 39 independent measurements for RingsHS, RingsLS, and Rings (no spiral), respectively. Error bars show one s.d. of the mean. g, F-AFM phase image in which Vipp1 ringsHS scan and stably bind highly curved or ruptured membrane. The zoomed-in area is enclosed in the dashed box, with a 40 nm scale bar. Scan rate, 15 Hz; 256 × 151 pixels. h, Quantification of Vipp1 ringsHS (red line) and ringsLS (blue line) height profiles show similar shape and lateral dimensions. Error bands show one s.d. of the mean. Source data
Fig. 4
Fig. 4. Vipp1 planar sheets and spiral filaments have closely related lattices.
a, F-AFM height image showing highly ordered planar sheets in Vipp1. Inset, Fourier Transform of the region enclosed by the dashed box. Parallel ridges are spaced 54 Å apart. White arrows indicate merged filament seam lines with 122 Å repeat. Scan rate, 10 Hz; 256 x 151 pixels. b, F-AFM phase image showing Vipp1 spirals. Insets, Fourier transform of the regions enclosed by the dashed boxes. Parallel ridges are spaced 54 Å apart. Blue arrows indicate the merging of spiral turns into a planar sheet, showcasing their close polymeric relationship. Scan rate, 35 Hz; 256 × 213 pixels. c, NS EM image showing Vipp1 polymers (rings and rod-like filaments) decorating the surface of a monolayer, which is itself covered by Vipp1 planar filaments. The experiment was repeated independently three times. d, NS EM image showcasing the mosaic of 2D planar spirals and sheets Vipp1 forms on a lipid monolayer. Yellow arrows indicate rings at the center of spirals. Red boxes indicate example regions for particle extraction and alignment. Inset, particle class average (left) and corresponding Fourier transform (right). Filament stripes are 54 Å apart. The experiment was repeated independently three times.
Fig. 5
Fig. 5. Vipp1Δα61-219 helical filaments have a lattice closely related to Vipp1 ringsHS.
a, Cryo-EM image showing Vipp1Δα61–219 forming helical filaments, helical-like ribbons, and rings (red, blue, and yellow arrows, respectively). A zoomed version is shown in Supplementary Data Figure 1a. The experiment was repeated independently three times. b, Sharpened Vipp1Δα6_L3 map contoured at 2.3σ, showing local-resolution estimates. c, Vipp1Δα6_L3 map fitted with Vipp1Δα6_L3 helical filament structure (top left). The colored monomer is isolated and zoomed to show map quality, build, and fit. The map is contoured at 3σ, except for helix α5 at 1σ. d, Structure of the Vipp1Δα6_L3 helical filament; the zoomed panel highlights conservation of interfaces 1 and 3. Bessel orders n = 17 and n = –4 are indicated with pitch. e, The 17-start right-handed helix in Vipp1Δα6_L3 forms ESCRT-III-like protofilaments. f, The 4-start left-handed helix in Vipp1Δα6_L3 is formed by subunit stacking mediated by interface 2. gi, Helical structures of other ESCRT-III family members bound to membrane.
Fig. 6
Fig. 6. Vipp1F197K/L200K_L1 is constricted and tubulates membrane.
a, Cryo-EM image showing Vipp1F197K/L200K_L1 forming helical filaments and coated membrane tubules. A zoomed version is shown in Supplementary Data Figure 1b. The experiment was repeated independently three times. b, Sharpened Vipp1F197K/L200K_L1 map contoured at 4σ showing local resolution estimates. c, Structure of the Vipp1F197K/L200K_L1 helical filament with one monomer colored. Bessel orders n = 14 and n = –5 are indicated with pitch. d, Unsharpened Vipp1F197K/L200K_L1 map contoured at 3σ, showcasing tubulated membrane within the inner lumen. e, Vipp1F197K/L200K_L1 filament surface rendered to show electrostatic charge. The blue to red spectrum represents positive to negative charges with units kBT/ec. Zoomed panels show the mechanism of membrane binding. f, Comparison of ESCRT-III-like protofilament orientation relative to the same membrane plane between Vipp1F197K/L200K_L1 and Vipp1 ringHS. g, Hairpin superposition of a Vipp1F197K/L200K_L1 subunit with a Vipp1 ringHS subunit (C14 symmetry, rung 4, PDB code 6ZW4).
Fig. 7
Fig. 7. Mechanism for Vipp1 spiral formation, ring biogenesis, and membrane repair.
a, Section of four ESCRT-III-like protofilaments extracted from the Vipp1Δα6_L3 helical structure, showing how filament twist enables binding of membranes on opposing planes. b, Model of Vipp1 planar sheet, spiral, and 3D ring biogenesis. F-AFM image (left); the white boxes labeled 1–3 are shown in the panels at the right labeled 1–3. Scan rate, 10 Hz; 256 × 151 pixels. The twisting helical filament in a bridges the transition from 2D planar to 3D ring structures. To facilitate modeling of the planar filament, helix α4 was removed. c, Mechanism of Vipp1-mediated membrane sensing, stabilization, and repair. In Chlamydomonas, Vipp1 helical filaments may bridge thylakoids and the chloroplast envelope.
Extended Data Fig. 1
Extended Data Fig. 1. Vipp1 assembles dynamic networks of sheets, spirals and rings on membrane, related to Figs. 2 and 3.
a, Phase F-AFM timecourse showing spiral formation and ringLS biogenesis. Highlighted events include ringLS abscission, filament branching, and ring formation in the absence of a spiral (green, white and blue arrows, respectively). White dotted box indicates zoomed region relating to Fig. 3a. Red dotted line relates to plotted height profile (right). Scan rate 150 Hz, 256 x 213 pixels. b, Average F-AFM height image showing the outer turn of a spiral formed by linear sheet connected by vertices. Here, lattice breaks in the filament packing marked shifts in polymerisation direction (blue arrows). White arrows indicate sheet branching. Scan rate 35 Hz, 256 x 151 pixels. c, Phase F-AFM timecourse showing how filaments often grow alongside established filaments with a propensity to branch off and form spirals (white arrows). Scan rate 42 Hz, 256 x 179 pixels. d, Phase F-AFM timecourse showing ring formation due to spatial constraint (white arrow). Dotted yellow line delineates membrane boundary. Scan rate 150 Hz, 256 x 213 pixels. e, Phase F-AFM image showing examples of rings formed in the absence of a spiral. These rings form on membrane micro-patches on the mica due to spatial constraint. Scan rate 15 Hz, 512 x 384 pixels. Middle panel relates to dotted box in left panel. The plot (right) shows the rings with mean height 6.0 ± 0.6 nm. Data derived from N = 21 independent measurements. Error bars show one standard deviation of the mean.
Extended Data Fig. 2
Extended Data Fig. 2. Vipp1 ringsHS form planar spirals in low salt conditions, related to Fig. 3.
a, Vipp1 ringsHS purified in high salt (50 mM NaCl) form rings between C11-C17 symmetries and also with higher symmetries such as C20 or above with diameters of 41 nm and 43 nm, respectively. Experiment repeated independently N = 3. b, Vipp1 ringsHS bind to mica as stable pre-formed dome-shaped rings in a high salt (150 mM NaCl) buffer. Scan rate 8 Hz, 256 x 146 pixels. Left panel represents field of view before sample addition. Right panel is complementary to Fig. 3h. c, Plot showing Vipp1 ringsHS heights as measured by F-AFM. Mean height is lower than Vipp1 ringsHS heights determined by cryo-EM between ~15-21 nm for C11-C17 symmetries. Data derived from N = 46 independent measurements. Error bars show one standard deviation of the mean. d, F-AFM timecourse showing how, in a low salt (10 mM NaCl) buffer, Vipp1 ringsHS forms planar sheets and spiral networks on membrane. Scan rate 20 Hz, 256 x 204 pixels. e, F-AFM image highlighting dotted box regions I and II in D. Rings and spirals nucleate and assemble on the highly curved membrane edge. Blue and red dotted lines were used for plotted height profiles (right) of typical spiral and rings. Scan rate 30 Hz, 256 x 179 pixels. f, NS EM image of Vipp1 ringsHS after buffer exchange into 10 mM NaCl buffer. Compared with the sample purified in 50 mM NaCl as in A, rings tend to be clumped or stacked and in the process of unfurling. Dotted box indicates zoomed region (right panel). Experiment repeated independently N = 3.
Extended Data Fig. 3
Extended Data Fig. 3. Vipp1Δα61-219 forms tightly packed planar spirals and highly ordered sheets, related to Figs. 2–4.
a, NS EM image showing Vipp1Δα61-219 forming helical filaments, helical-like ribbons, and rings (red, blue and yellow arrows, respectively). Related to Fig. 5a. b, F-AFM phase timecourse showing Vipp1Δα61-219 recruitment to the membrane where it forms curled sheets and compact spirals on the membrane edge. Scan rate 20 Hz, 256 x 213 pixels. c, F-AFM height and phase image showing membrane edges decorated with sheet and compact spirals. Red dotted line indicates plotted height profiles (right) with Vipp1Δα61-219 planar filaments/sheet equivalent height to native Vipp1, related to Fig. 2e. Scan rate 5 Hz, 256 x 320 pixels. d, Vipp1Δα61-219 forms dense crystalline planar sheets and spirals. Scan rate 10 Hz, 512 x 426 pixels. Dotted red line in top right panel was used for the plotted height profile (inset). Scan rate 10 Hz, 256 x 154 pixels. Dotted box in bottom right panel indicates region used for Fourier Transform (inset). Parallel ridges are separated by a 55 Å spacing. e, F-AFM image showing Vipp1Δα61-219 planar sheet curling at one end and branching into a spiral at the other. Scan rate 10 Hz, 256 x 488 pixels. f, Zoom of dotted box in E, showing how planar sheets curl via a wedging mechanism on the outer side of the bend (white arrows). Concurrently, sections are removed from the inner side (red dotted box and inset). Scan rate 10 Hz, 128 x 160 pixels. g, NS EM image showing Vipp1Δα61-219 rod-like filaments decorating the surface of a monolayer which is itself covered by 2D planar filaments. Experiment repeated independently N = 3. h, Vipp1Δα61-219 forms a mosaic of 2D planar filaments (blue arrows) and rings (yellow arrows) on a lipid monolayer. Filaments encircle apparent raised areas (Ra) and regions where the monolayer is ruptured (R). Experiment repeated independently N = 3. i, Zoom view of Vipp1Δα61-219 mosaic of 2D planar filaments and sheets on a lipid monolayer, related to Fig. 4d. Note spiral filaments are not observed here. Red boxes indicate example regions for particle extraction and alignment. Top right shows particle class average and corresponding Fourier Transform (bottom right). Filament stripes are 54 Å apart with an orthogonal 32 Å repeat.
Extended Data Fig. 4
Extended Data Fig. 4. Vipp1 helical lattice analyses and map resolutions.
a, 2D class averages of four different helical filaments including Vipp1L1, Vipp1F197K/L200K_L1, Vipp1Δα6_L2 and Vipp1Δα6_L3 (left column) with Fourier Transforms and Bessel Orders for key layer lines assigned (middle columns). Associated gold standard FSC curves for each map are presented (right column). b, Vipp1L1, Vipp1F197K/L200K_L1, Vipp1Δα6_L2 and Vipp1Δα6_L3 helical assemblies drawn as 2D lattices showing arrangement of key Bessel orders.
Extended Data Fig. 5
Extended Data Fig. 5. Cryo-EM maps and model build for Vipp1Δα6_L2 and Vipp1F197K/L200K_L1, related to Figs. 5 and 6.
a, Sharpened Vipp1Δα6_L2 map contoured at 2σ showing local resolution estimates. Vipp1Δα6_L2 map was resolved to 3.8 Å overall using helical parameters with rise = 2.16 Å and rotation = 68.50°. b, Vipp1Δα6_L2 map fitted with Vipp1Δα6_L2 helical filament structure (top left). The coloured monomer is isolated and zoomed to show map quality, build and fit. Map contoured between 3-4σ. Map local resolution range was broader than for Vipp1Δα6_L3 with lower map quality particularly around helix α5. The Vipp1Δα6_L2 lattice therefore has increased instability in comparison to Vipp1Δα6_L3 although residual heterogeneity in the particle stack cannot be discounted as a contributory factor in reducing map quality. c, Structure of the Vipp1Δα6_L2 helical filament. Bessel orders n = 16 and n = −5 are indicated with pitch. Specifically, the ESCRT-III-like protofilaments form a 16-start right-handed helix which twist around the helical axis with a 46 Å pitch. Concurrently, these protofilaments align to form a 5-start left-handed helix with a 46 Å pitch. In comparison to Vipp1Δα6_L3 (Fig. 5 and Extended Data Fig. 4), the effect is to rotate the Vipp1 lattice ~13° clockwise around the helical axis with modest packing adjustments accommodating a minor flattening of the rhomboid unit cell. This results in a slightly narrower filament 23.6 nm in diameter with a hollow inner lumen diameter of 12.5 nm. Overall, the Vipp1Δα6_L2 and Vipp1Δα6_L3 structures reveal how subtle shifts in Vipp1 assembly and lattice packing modulate inherent polymer stability. d, Vipp1F197K/L200K_L1 map fitted with Vipp1F197K/L200K_L1 helical filament structure (top left). The coloured monomer is isolated and zoomed to show map quality, build and fit. Map contoured at 4σ. Related to Fig. 6. e, Superposition of subunits from Vipp1F197K/L200K_L1 and Vipp1L1 with RMSD Cα = 1.8 Å. Subunits share similar conformations although Vipp1F197K/L200K_L1 does not have the hairpin kink observed in Vipp1L1 (Extended Data Fig. 6D).
Extended Data Fig. 6
Extended Data Fig. 6. Comparison of Vipp1L1 with Vipp1Δα6_L3 yields a mechanism of filament constriction.
a, Cryo-EM image showing Vipp1L1 forming helical filaments, helical-like ribbons, and rings (red, blue and yellow arrows, respectively). A zoomed version is presented as Supplementary Fig. 1b. b, DeepEMhancer post-processed Vipp1L1 map contoured at 3σ showing local resolution estimates. c, Vipp1L1 map fitted with Vipp1L1 helical filament structure (top left). The coloured monomer is isolated and zoomed to show map quality, build and fit. Map contoured between 2.8-3.5σ. The map region relating to helix α5c, contoured at 3σ, was not DeepEMhancer processed or sharpened. d, Structure of a Vipp1L1 subunit. e, Superposition of Vipp1L1, Vipp1Δα6_L2 and Vipp1Δα6_L3 monomers with the alignment focussed on the hairpin motif. The Cα RMSD of Vipp1L1 subunits to Vipp1Δα6_L2 or Vipp1Δα6_L3 was 1.5 Å and 1.7 Å, respectively. Note how helix α5 is compacted in Vipp1L1 compared with Vipp1Δα6_L2 and Vipp1Δα6_L3. f, Comparison of constricted versus non-constricted ESCRT-III-like protofilaments in Vipp1L1 and Vipp1Δα6_L3. Five monomers were superposed with the alignment focussed on the central subunit. g, Helical constriction occurs through subunit loss from the circumferential belt. Vipp1Δα6_L3 and Vipp1L1 filaments are compared, with constriction occurring due to a loss of two subunits (n = −21 reduced to n = −19) coupled with ~11 Å rotation of the left-handed four-start helix as indicated in the helix α0 zoom boxes.
Extended Data Fig. 7
Extended Data Fig. 7. Analysis of Vipp1 planar sheet and spiral ultrastructure.
a, Cylindrical projection of the Vipp1Δα6_L3 map with its auto-correlation function. Based on the Vipp1Δα6_L3 structure, the orientation of six subunits have been superposed on the 2D lattice with the ESCRT-III-like protofilaments coloured orange and turquoise. b, Cryogenic electron tomogram of Vipp1Δα6_L3. Central slice through the helical filaments is shown (left panel). Top right panel shows blue dotted box region from left panel. Only the upper surface ridges or stripes of the helical filament are sliced here. Bottom right panel shows Fourier Transform of red dotted box region. The ridges have a 45 Å repeat, which is consistent with the Vipp1Δα6_L3 left-handed 4-start helix pitch. c, Inter-subunit packing measurements of Vipp1Δα6_L3 and the equivalent in selected rungs of the Vipp1HS C17 symmetry ring. d, Hairpins slide relative to each other in Vipp1 ESCRT-III-like protofilaments. Two neighbouring subunits from rungs 1 and 4 of Vipp1HS C14 ring are superposed using the right-hand subunits only (left and middle panels). Whilst Ala50 and Ala 141 are aligned in the superposed subunits (dark orange and blue), Ala141 is up to 14 Å apart between the neighbouring subunits (light orange and cyan; right panel) indicating hairpin sliding. The distances 41 Å and 61 Å (middle panel) relate to the typical span of minimum and maximum inter-ridge distances observed in Vipp1 ringsHS, respectively. e, Lattice and subunit assignment of Vipp1Δα61-219 2D planar filaments and sheets on a lipid monolayer, relating to Extended Data Fig. 3I. The class average (left) is shown with lattice points and dimensions derived from the Fourier Transform shown in Extended Data Fig. 3I. The same class average (right) is shown with Vipp1 ESCRT-III-like protofilaments equivalent to Bessel order n = 17 in Vipp1Δα6_L3 positioned based on the lattice points (orange and turquoise).

Similar articles

Cited by

References

    1. Liu, J. et al. Bacterial Vipp1 and PspA are members of the ancient ESCRT-III membrane-remodeling superfamily. Cell184, 3660–3673 (2021). - PMC - PubMed
    1. Tarrason Risa, G. et al. The proteasome controls ESCRT-III–mediated cell division in an archaeon. Science369, eaaz2532 (2020). - PMC - PubMed
    1. Votteler, J. & Sundquist, W. I. Virus budding and the ESCRT pathway. Cell Host Microbe14, 232–241 (2013). - PMC - PubMed
    1. Liu, J. et al. Functional assignment of multiple ESCRT‐III homologs in cell division and budding in Sulfolobus islandicus. Mol. Microbiol.105, 540–553 (2017). - PubMed
    1. Juan, T. & Fürthauer, M. Biogenesis and function of ESCRT-dependent extracellular vesicles. Semin. Cell Dev. Biol.74, 66–77 (2018). - PubMed

MeSH terms

Substances

LinkOut - more resources