. 2024 Dec;5(12):1902-1918.
doi: 10.1038/s43018-024-00847-5. Epub 2024 Nov 11.

The pro-oncogenic noncanonical activity of a RAS•GTP:RanGAP1 complex facilitates nuclear protein export

Affiliations

The pro-oncogenic noncanonical activity of a RAS•GTP:RanGAP1 complex facilitates nuclear protein export

Brajendra K Tripathi et al. Nat Cancer. 2024 Dec.

Abstract

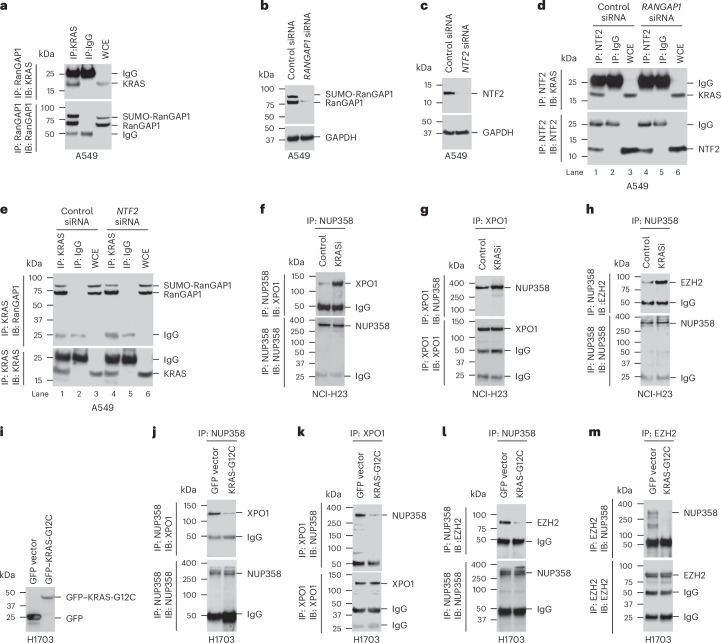
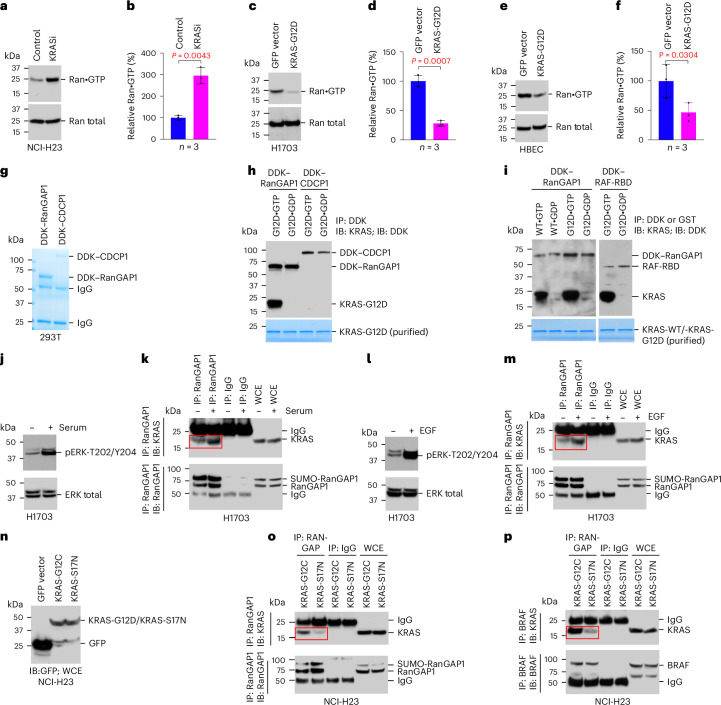
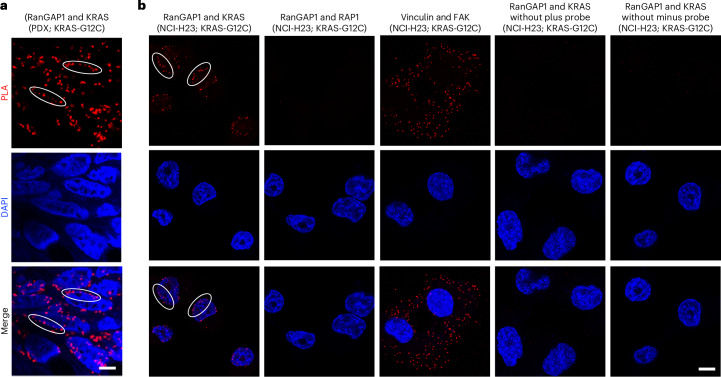
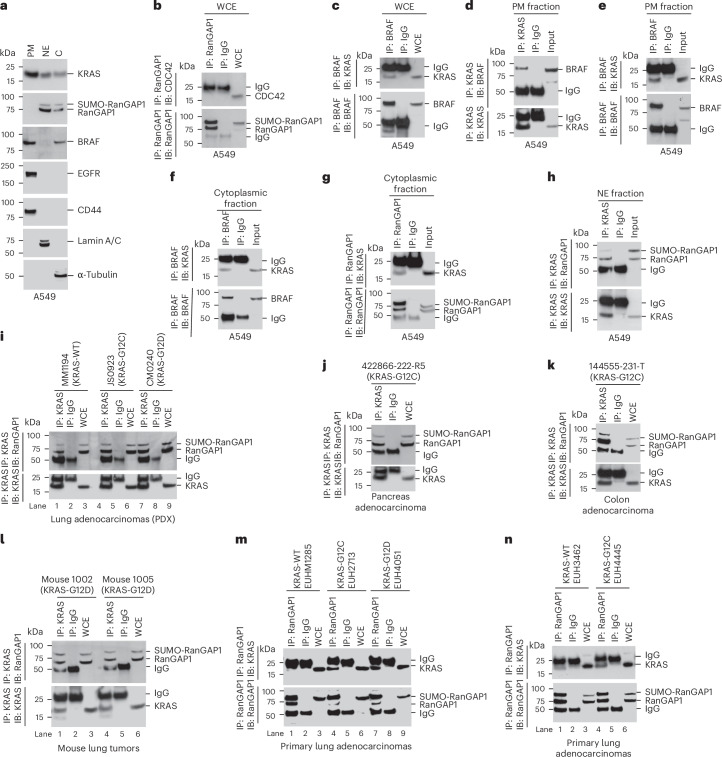
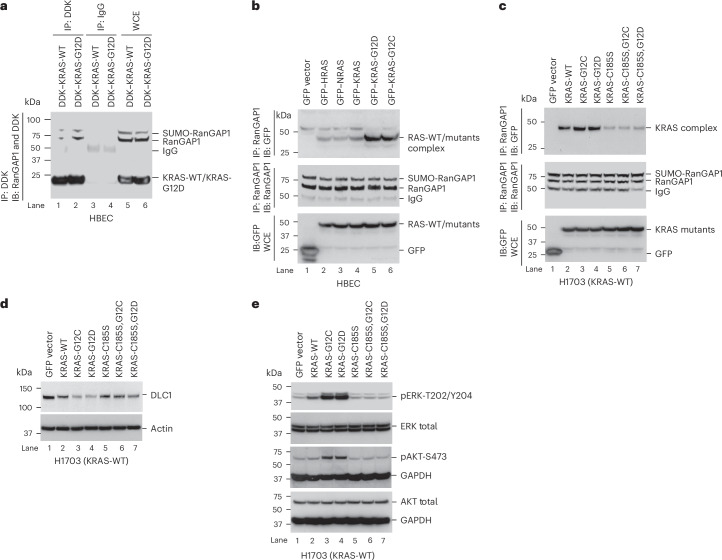
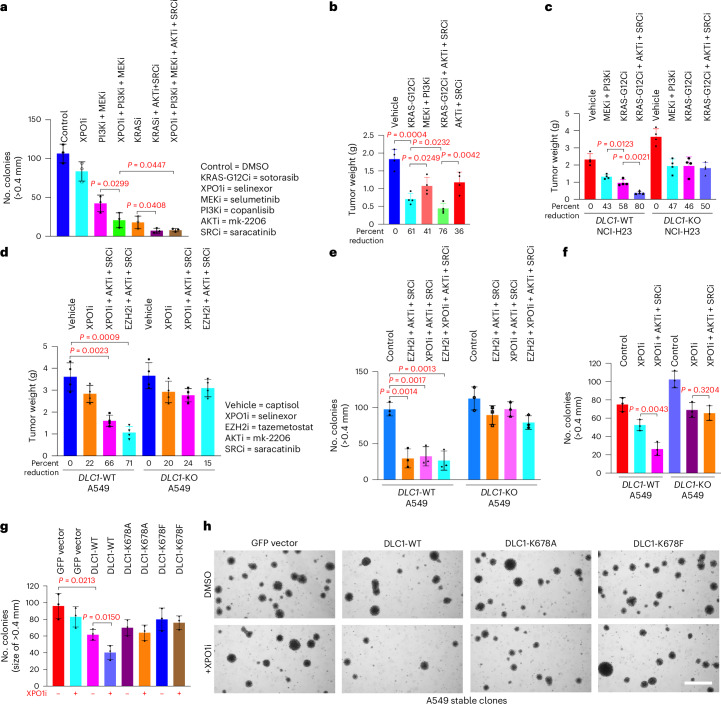
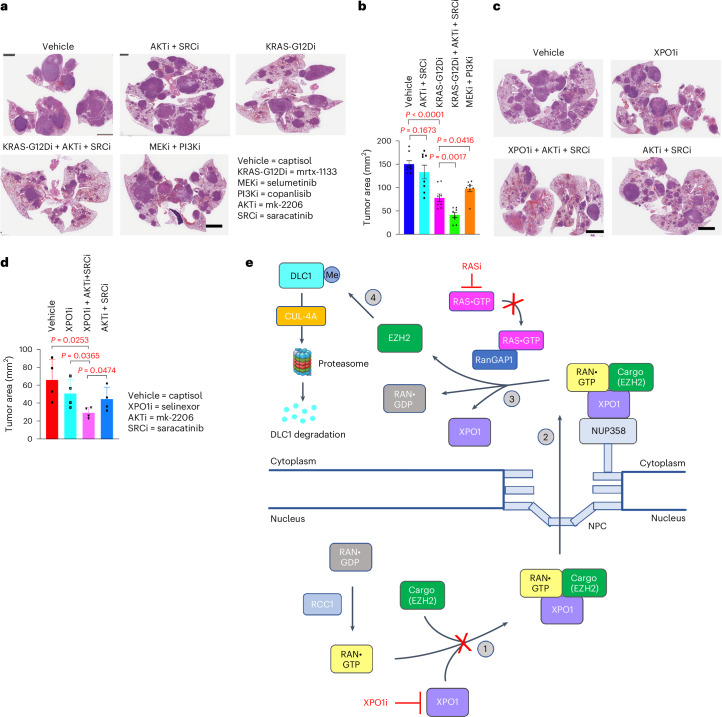
Canonical RAS signaling, including PI3K/AKT- and RAF/MEK-dependent activities, results mainly from RAS•GTP interaction with its effectors at the plasma membrane. Here, we identified a fundamental, oncogenic, noncanonical RAS•GTP activity that increases XPO1-dependent export of nuclear protein cargo into the cytoplasm and is independent of PI3K/AKT and RAF/MEK signaling. This RAS-dependent step acts downstream from XPO1 binding to nuclear protein cargo and is mediated by a perinuclear protein complex between RAS•GTP and RanGAP1 that facilitates hydrolysis of Ran•GTP to Ran•GDP, which promotes release of nuclear protein cargo into the cytoplasm. The export of nuclear EZH2, which promotes cytoplasmic degradation of the DLC1 tumor suppressor protein, is a biologically important component of this pro-oncogenic activity. Conversely, preventing nuclear protein export contributes to the antitumor activity of KRAS inhibition, which can be further augmented by reactivating the tumor suppressor activity of DLC1 or potentially combining RAS inhibitors with other cancer treatments.


Conflict of interest statement

Competing interests: All authors declare no competing interests.

Figures

Fig. 1
Fig. 1. RAS regulates nuclear protein export independently of PI3K and MEK signaling.
a, XPO1i (selinexor) prevented cytoplasmic export of EZH2 and XPO1. α-tubulin and lamin B1 were used as cytoplasmic and nuclear marker proteins, respectively; C, cytoplasmic; N, nuclear. bd, siRNA knockdown of KRAS (b) or XPO1i by selinexor reduced cytoplasmic EZH2 (c) and increased DLC1 (d). Combined treatment with selinexor and KRAS siRNA did not further increase the response. e, Stable transfection of mutant KRAS-G12C in H1703 cells decreased DLC1 expression, which was not affected by MEKi (U0126-ethanol) or PI3Ki (wortmannin) but was increased by XPO1i (selinexor). Wortmannin inhibited PI3K activity (measured by pAKT-S473), and U0126-ethanol inhibited MEK activity (measured by pERK-T202/Y204) in all treated samples. fi, In the KRAS-G12C NCI-H23 line, selinexor prevented complex formation between XPO1 and EZH2 (f and g) and between XPO1 and survivin (h), whereas complex formation was not prevented by the KRAS-G12C inhibitor sotorasib (i). Two independent experiments were performed for each image, with similar results; IB, immunoblot; IP, immunoprecipitation; WCE, whole-cell extract. Source data
Fig. 2
Fig. 2. KRAS and RanGAP1 form a protein complex that regulates the release of nuclear protein cargo (EZH2) from the NPC.
a, Complex formation between KRAS and RanGAP1 in A549 cells. Lysates from A549 cells were immunoprecipitated with antibody to RanGAP1 or mock IgG, followed by immunoblotting with antibody to KRAS or RanGAP1. be, siRNA knockdown of RanGAP1 (b) abolished the KRAS–NTF2 complex (d; lane 4), whereas siRNA knockdown of NTF2 (c) did not affect the KRAS–RanGAP1 complex (e; lane 4). GAPDH was used as a loading control. fh, Sotorasib treatment increased the complexes between NUP358 and XPO1 (f and g) and between NUP358 and EZH2 (h). Lysates from sotorasib-treated or sotorasib-untreated NCI-H23 cells were immunoprecipitated with antibody to NUP358 or XPO1 or mock IgG, followed by immunoblotting with antibody to NUP358, XPO1 or EZH2. im, Overexpressing mutant KRAS-G12C (i) decreased the complexes between NUP358 and XPO1 (j and k) and between NUP358 and EZH2 (l and m). Lysates from H1703 cells overexpressing mutant KRAS-G12C were immunoprecipitated with antibody to NUP358, XPO1 or EZH2 or mock IgG, followed by immunoblotting with antibody to NUP358, XPO1 or EZH2. Two independent experiments were performed for each image with similar results. Source data
Fig. 3
Fig. 3. RAS•GTP and RanGAP1 interact directly and regulate the level of cytoplasmic Ran•GTP.
af, KRASi by treatment with sotorasib increased cytoplasmic Ran•GTP in NCI-H23 cells (a and b), whereas overexpression of KRAS-G12D decreased cytoplasmic Ran•GTP in H1703 (c and d) and HBEC (e and f) cell lines. In b, d and f, bar graphs represent mean values of Ran•GTP, and error bars represent s.d.; n = 3 independent experiments. For the statistical analyses for b, d and f, a parametric unpaired one-tailed t-test with Welch’s correction was performed using Prism software, and no adjustments were made for multiple comparisons; P = 0.0043 for b, P = 0.0007 for d, and P = 0.0304 for f. gi, Purified RanGAP1 (g) bound to KRAS-G12D•GTP but not to KRAS-G12D•GDP (h). Purified CDCP1 (g) was used as a negative control (h). Purified RanGAP1 binds to the GTP-bound form of wild-type KRAS (KRAS-WT) and KRAS-G12D, but not to their GDP-bound forms. The right two lanes show positive binding (between GTP-bound KRAS-G12D and RAF-RBD) and negative binding (between GDP-bound KRAS-G12D and RAF-RBD) controls. Bottom, purified KRAS protein. jm, Lysates from serum or EGF-treated or EGF-untreated KRAS-wild-type H1703 cells were immunoprecipitated with antibody to RanGAP1 or mock IgG, followed by immunoblotting with antibody to KRAS or RanGAP1. Serum and EGF treatment induces ERK activity (measured by pERK-T202/Y204; j and l) and complex formation between KRAS and RanGAP1 (k and m). np, Overexpressing dominant-negative mutant KRAS-S17N (n) reduces complex formation between KRAS and RanGAP1 (o) and between KRAS and BRAF to a similar degree (p). Lysates from NCI-H23 cells overexpressing KRAS-G12C or KRAS-S17N were immunoprecipitated with antibody to RanGAP1 or mock IgG, followed by immunoblotting with antibody to KRAS or RanGAP1. Two independent experiments were performed for each image with similar results. Source data
Fig. 4
Fig. 4. KRAS and RanGAP1 form a perinuclear complex in PDX sections and NCI-H23 cells.
a, PDX tumor sections with KRAS-G12C showed perinuclear PLA signals of colocalization of RanGAP1 and KRAS. Tumor sections were immunostained with antibodies to RanGAP1 and KRAS. DAPI (blue) was used to stain the nuclei. White oval outlines indicate some of the red perinuclear signals; scale bar, 5 µm. b, Perinuclear PLA colocalization signal between RanGAP1 and KRAS in NCI-H23 cells (first column). The wider cell distribution of the PLA colocalization signals between vinculin and FAK (third column) was distinct from that between RanGAP1 and KRAS (first column), while there was no PLA signal between RanGAP1 and RAP1 GTPase (second column). There was no PLA signal detected when plus probe (middle columns) or minus probe was omitted (fourth and fifth images); scale bar, 10 µm. Two independent experiments were performed for each image with similar results.
Fig. 5
Fig. 5. Cell fractionations for PM, NE and cytoplasmic fractions.
The KRAS–RanGAP1 complex occurs in many tumors, including in primary human lung cancer, PDXs from lung, pancreas and colorectal cancer and a KRAS-induced mouse lung cancer model. a, A549 cells were fractionated for PM, NE and cytoplasmic fractions, and the purity of each fraction was verified by the expression of specific marker proteins, for example, EGFR and CD44 for the PM, lamin A/C for the NE and α-tubulin for the cytoplasm. KRAS is present in all three fractions, RanGAP1 is present only in NE and cytoplasmic fractions, and BRAF is present only in the PM and cytoplasmic fractions. b, Lysates from A549 cells were immunoprecipitated with antibody to RanGAP1 or mock IgG, followed by immunoblotting with antibody to CDC42 or RanGAP1. ch, Lysates from the indicated fractions were immunoprecipitated with antibody to BRAF, KRAS or RanGAP1 or mock IgG, followed by immunoblotting with antibody to KRAS, BRAF or RanGAP1; Input, indicated fraction. KRAS formed a complex with BRAF in the whole-cell extract (c), PM (d and e) and cytoplasmic fractions (f), and KRAS formed a complex with RanGAP1 in the cytoplasmic (g) and NE (h) fractions. in, Lysates from the indicated samples were immunoprecipitated with antibody to KRAS or RanGAP1 or mock IgG, followed by immunoblotting with antibody to RanGAP1 or KRAS. KRAS–RanGAP1 protein complexes were identified in PDXs from lung adenocarcinoma (i), pancreas adenocarcinoma (j) and colon adenocarcinoma (k); KRAS-inducible lung adenocarcinoma in mice (l) and primary human lung adenocarcinoma (m and n). Two independent experiments were performed for each image with similar results. Source data
Fig. 6
Fig. 6. RanGAP1 forms a complex with all three RAS proteins, which is enhanced by RAS farnesylation.
a, RanGAP1 bound more efficiently to mutant KRAS-G12D than to wild-type KRAS. b, The RanGAP1–RAS complex formed with similar efficiency with wild-type HRAS, NRAS and KRAS and was more efficient with mutant KRAS-G12C and KRAS-G12D. ce, H1703 cells were stably transfected with the indicated KRAS mutant and analyzed for several parameters. The RanGAP1–KRAS complex was most efficient with farnesylated KRAS, which is associated with the greatest decrease in DLC1 protein expression. Formation of the RanGAP1–KRAS complex was greater with KRAS-G12C and KRAS-G12D mutants (c, lanes 3 and 4) than with isogenic farnesylation-deficient C185S mutants (c, lanes 6 and 7), which was correlated with a greater reduction in DLC1 protein expression (d, lanes 3 and 4) than observed with the farnesylation-deficient C185S mutants (d, lanes 6 and 7). The KRAS-G12C and KRAS-G12D mutants have the highest activation of ERK and AKT (e, lanes 3 and 4), as measured by pERK-T202/Y204 and pAKT-S473 expression, respectively. Two independent experiments were performed for each image with similar results. Source data
Fig. 7
Fig. 7. The combination of XPO1i + MEKi + PI3Ki inhibits cell growth to the same degree as KRASi, facilitated by DLC1-dependence.
a, Quantitation of cell colonies (>0.4 mm) in response to the indicated treatment. Bar graphs represent mean, and error bars represent s.d.; n = 3. Combined XPO1i + PI3Ki + MEKi showed similar inhibition as KRASi. KRASi + AKTi + SRCi showed greater inhibition than KRASi; P = 0.0299 for PI3Ki + MEKi versus XPO1i + PI3Ki + MEKi, P = 0.0408 for KRAS-G12Ci versus KRAS-G12Ci + AKTi + SRCi, and P = 0.0447 for XPO1i + PI3Ki + MEKi versus XPO1i + PI3Ki + MEKi + AKTi + SRCi. b, In NCI-H23 xenografts, KRASi + AKTi + SRCi had the highest antitumor activity, followed by KRASi, with PI3Ki + MEKi having the lowest activity. The numbers below each graph represent percent reduction in tumor weight for each treatment group compared to vehicle; P = 0.0004 for vehicle versus KRAS-G12Ci, P = 0.0249 for KRAS-G12Ci versus MEKi + PI3Ki, P = 0.0232 for KRAS-G12Ci versus KRAS-G12Ci + AKTi + SRCi, and P = 0.0042 for KRAS-G12Ci + AKTi + SRCi versus AKTi + SRCi. c, Differences in treatment responses to various inhibitors seen in the DLC1-WT parental line were abrogated in a DLC1-KO line; P = 0.0123 for MEKi + PI3Ki versus KRAS-G12Ci and P = 0.0021 for KRAS-G12Ci versus KRAS-G12Ci + AKTi + SRCi. d, In A549 xenografts, treatment with AKTi + SRCi plus XPO1i or EZH2i had similar antitumor activity. In bd, individual and average tumor weight are shown. The bar graphs represent mean, error bars represent s.d.; n = 4; P = 0.0023 for vehicle versus XPO1i + AKTi + SRCi and P = 0.0009 for vehicle versus EZH2i + AKTi + SRCi. e, Quantitation of colonies after treatment. The four-drug combination was not more inhibitory than the three-drug combination without XPO1i or EZH2i; P = 0.0014 for control versus EZH2i + AKTi + SRCi, P = 0.0017 for control versus XPO1i + AKTi + SRCi, and P = 0.0013 for control versus EZH2i + XPO1i + AKTi + SRCi. f, Quantitation of colonies after treatment. The three-drug combination of XPO1i + AKTi + SRCi was more inhibitory than XPO1i; P = 0.0043 for XPO1i versus XPO1i + AKTi + SRCi in DLC1-WT and P = 0.3204 for XPO1i versus XPO1i + AKTi + SRCi in DLC1-KO. g,h, Quantitation of colonies after treatment (g), as shown in photomicrographs (h); scale bar, 2 mm. For eg, bar graphs represent mean, and error bars represent s.d.; n = 3. Anchorage-independent growth in response to XPO1i in stably transfected DLC1 mutants. For statistical analyses in ag, parametric unpaired one-tailed t-tests with Welch’s correction were performed; P = 0.0213 for GFP vector versus DLC1-WT-transfected cells and P = 0.0150 for untreated versus XPO1i-treated DLC1-WT-transfected cells. Source data
Fig. 8
Fig. 8. KRASi or XPO1i cooperates with the inhibition of AKT kinase and SRC kinase in antitumor activity.
a,b, In mouse lung tumors (a) induced by KRAS-G12D activation and p53 inactivation, the combination of mrtx-1133 + mk-2206 + saracatinib showed greater antitumor activity than mrtx-1133 alone or the combination of mk-2206 + saracatinib. Mrtx-1133 had greater antitumor activity than the selumetinib + copanlisib combination; scale bar, 4 mm. Bar graphs in b represent mean values of residual tumor area, and error bars represent s.d.; n = 8 mice per group; P = 0.1673 for vehicle versus AKTi + SRCi, P = 0.0001 for vehicle versus KRAS-G12Di, P = 0.0017 for KRAS-G12Di versus KRAS-G12Di + AKTi + SRCi, and P = 0.0416 for KRAS-G12Di versus MEKi + PI3Ki. c,d, The combination of selinexor + mk-2206 + saracatinib had greater antitumor activity than selinexor alone or the combination of mk-2206 + saracatinib (c); scale bar, 4 mm. Bar graphs in d represent mean values of residual tumor area, and error bars represent s.d.; n = 4 mice per group. For the statistical analyses for b and d, parametric unpaired one-tailed t-tests with Welch’s correction were performed using Prism software, and no adjustments were made for multiple comparisons; P = 0.0253 for vehicle versus XPO1i + AKTi + SRCi, P = 0.0365 for XPO1i versus XPO1i + AKTi + SRCi, and P = 0.0474 for XPO1i + AKTi + SRCi versus AKTi + SRCi. e, Model summarizing the key noncanonical steps identified in this study. (1) Formation of a trimeric protein complex (Ran•GTP–XPO1–cargo) in the nucleus, which can be abrogated by XPO1i. (2) The trimeric complex that is exported through the NPC becomes associated with NUP358, which is part of the cytoplasmic face of the NPC. (3) RAS•GTP and RanGAP1 form a complex that facilitates the hydrolysis of Ran•GTP to Ran•GDP and releases the cargo into the cytoplasm; RASi can prevent this step. (4) EZH2, which is a key protein cargo identified in this study, methylates DLC1, which can then be ubiquitinated and subjected to proteasome-dependent degradation. Source data
Extended Data Fig. 1
Extended Data Fig. 1. EZH2 protein sequence contains two consensus nuclear export signals, highlighted in red.
EZH2 protein sequence with two Nuclear Export Signals (NES) in red identified by NES Mapper (per) program.
Extended Data Fig. 2
Extended Data Fig. 2. XPO1 inhibition or RAS inhibition prevents EZH2 and Survivin export from nucleus to cytoplasm.
a In the NCI-H23 line, which harbors mutant KRAS-G12C, the XPO1 inhibitor selinexor or the KRAS-G12C inhibitor sotorasib prevented nuclear export of EZH2 and Survivin into the cytoplasm. α-tubulin and lamin B1 were used, respectively, as cytoplasmic and nuclear marker proteins. C, Cytoplasmic; N, Nuclear. b-d siRNA knockdown of XPO1 (b) or KRAS (c) prevented nuclear export of EZH2 and Survivin into the cytoplasm (d). GAPDH was used a loading control. e,f Results from XPO1 inhibition or KRAS knockdown in H1703 (e) and HBEC (f) lines were similar to those in NCI-H23 line (a,d). Two independent experiments were performed for each image, with similar results. Source data
Extended Data Fig. 3
Extended Data Fig. 3. Overexpression of mutant KRAS increases nuclear export of EZH2 and Survivin, which is independent of PI3K and MEK signaling; KRAS inhibition does not prevent XPO1:Survivin complex formation.
a-d Overexpression of KRAS-G12C in H1703 (a,b) or KRAS-G12D in HBEC (c,d) lines increased the level of cytoplasmic EZH2 and cytoplasmic Survivin and decreased the cytoplasmic DLC1 protein. α-tubulin and lamin B1 were used, respectively, as cytoplasmic and nuclear marker proteins. C, Cytoplasmic; N, Nuclear. e In A549 cells, MEK inhibitor U0126-ethanol and PI3K inhibitor wortmannin did not affect the level of DLC1 protein, while the XPO1 inhibitor selinexor did increase DLC1 protein. U0126-ethanol inhibited MEK activity (measured by pERK-T202/Y204) and wortmannin inhibited PI3K activity (measured by pAKT-S473) in all treated samples. f,g In the KRAS-G12C NCI-H23 line, selinexor prevented the complex formation between XPO1 and EZH2 in the nucleus, as it is confirmed from the purified nuclear extract. h,i KRAS inhibition by sotorasib (h) or siRNA knockdown of KRAS (i) did not prevent XPO1:Survivin complex formation. Lysates from NCI-H23 cells treated without or with sotorasib or KRAS siRNA were IP with antibodies to XPO1, Survivin, or mock IgG, followed by IB with antibodies to Survivin or XPO1. WCE, whole cell extract. j Complex formation between KRAS and NTF2 in A549 cells. Lysates from A549 cells were IP with antibodies to KRAS or mock IgG, followed by IB with antibodies to NTF2 or KRAS. k-n Overexpressed KRAS-G12C (k,l) or KRAS-G12D (m,n) formed a complex with full-length RanGAP1 (k,m) and the RanGAP1 catalytic domain (l,n). Two independent experiments were performed for each image, with similar results. Source data
Extended Data Fig. 4
Extended Data Fig. 4. Sequence alignment of the indicated proteins.
Multiple sequence alignment using CLUSTAL Omega (1.2.4, https://www.ebi.ac.uk/Tools/msa/clustalo/). a Protein sequence alignment among RanGAP1, NF1, and RASA1. b Protein sequence alignment between KRAS and RAP-1A.
Extended Data Fig. 5
Extended Data Fig. 5. KRAS and RanGAP1 form a perinuclear complex in PDX and A549 cells.
a PDX tumor sections with KRAS-G12D showed perinuclear PLA signals of colocalization of RanGAP1 and KRAS. Tumor sections were immunostained with RanGAP1 and KRAS antibodies. DAPI was used to stain nuclei (blue). White oval outlines indicate red perinuclear signals. Scale bar = 5 µm. b Perinuclear PLA colocalization signal between RanGAP1 and KRAS were also observed in A549 cells (first panel). The wider distribution of the PLA colocalization signal between Vinculin and FAK (third panel) was distinct from that between RanGAP1 and KRAS (first panel), while there was no PLA signal between RanGAP1 and RAP1 (second panel). There was no PLA signal detected when plus probe (middle panels) or minus probe was omitted (fourth and fifth panels). Scale bar = 10 µm. Two independent experiments were performed for each image with similar results.
Extended Data Fig. 6
Extended Data Fig. 6. Cell fractionations for plasma membrane (PM), nuclear envelope (NE), and cytoplasmic (C) fractions. The RAS:RanGAP1 complexes are present in many tumor types and non-tumorigenic lines.
a NCI-H23 cells were fractionated for PM, NE, and cytoplasmic fractions whose purity was verified by specific marker proteins, for example, EGFR and CD44 for the PM, lamin A/C for the NE, and α-tubulin for the cytoplasmic marker protein. KRAS is present in all three fractions, RanGAP1 is present only in NE and cytoplasmic fractions, while BRAF is present only in PM and cytoplasmic fractions. b-i Lysates from indicated fractions were IP with antibodies to BRAF, KRAS, RanGAP1, or mock IgG, followed by IB with antibodies to KRAS, BRAF, or RanGAP1. WCE, whole cell extract, Input, indicated purified fraction. KRAS formed a complex with BRAF in the WCE (b), PM (c,d), and cytoplasmic fraction (e). KRAS formed a complex with RanGAP1 in cytoplasmic fraction (f) and NE (g). h As BRAF is not present in NE (a), there was no complex formation between KRAS and BRAF in NE fraction. i Since RanGAP1 is not present in PM (a), there was no complex formation between KRAS and RanGAP1 in PM fraction. j-p Lysates from indicated samples were IP with antibodies to KRAS, RanGAP1, or mock IgG, followed by IB with antibodies to RanGAP1 or KRAS. WCE, whole cell extract. KRAS:RanGAP1 protein complexes were identified in: PDX’s from pancreas adenocarcinoma (j), PDX’s from colon adenocarcinoma (k), and PDX’s from HRAS mutant Nasopharyngeal Carcinoma (l), PDX’s from NRAS mutant colon adenocarcinoma (m), non-transformed HBEC line (n), non-immortalized, non-transformed WI-38 fibroblasts (o). In contrast to the positive results of complex formation between KRAS and RanGAP1 in primary human lung cancer shown in Fig. 5 l,m, the complex formation was not detected between RanGAP1 and the RAP1 (p). Two independent experiments were performed for each image, with similar results. Source data
Extended Data Fig. 7
Extended Data Fig. 7. The combined inhibition of XPO1, MEK, and PI3K inhibits cell growth to the same degree as KRAS inhibition. The combined inhibition of KRAS, AKT, and SRC has the highest antitumor activity; DLC1 expression makes a critical contribution to this antitumor activity.
a Photomicrographs of colonies quantified in Fig. 7a. Scale bar = 2 mm. Anchorage-independent colonies growth in responses to treatment with the KRAS inhibitor sotorasib alone or in the combination of the indicated drugs treatment. The combined inhibition of XPO1, PI3K, and MEK have similar colonies growth inhibition as KRAS inhibition. The combined inhibition of KRAS, AKT, and SRC had greater colonies growth inhibition compared to KRAS inhibition alone. b Xenograft tumors after 3 weeks of treatment with the indicated inhibitors quantified in Fig. 7b. c Quantitation of agar colonies (>0.4 mm) after the indicated drugs treatment. Bar graphs represent mean value and error bars represent SD. N = 3 independent experiments. p = 0.0004 for control versus KRAS-G12Ci, p = 0.0022 for control versus MEKi+PI3Ki, p = 0.0112 for KRAS-G12Ci versus MEKi+PI3Ki, and p = 0.0146 for KRAS-G12Ci versus KRAS-G12Ci+AKTi+SRCi. d Excised xenograft tumors after treatment with the indicated inhibitors. In the NCI-H23 xenograft tumors, combined inhibition of KRAS, AKT, and SRC has the highest antitumor activity in DLC1 expressed tumors. Most of the antitumor activity was attributable to DLC1 protein expression, as the isogenic DLC1-KO line was much less susceptible to the three-drug combination. e,f Quantitation (e) of agar colonies (>0.4 mm) after the indicated drugs treatment, as photomicrographs of colonies shown (f). In figure E, bar graphs represent mean value and error bars represent SD. N = 3 independent experiments. p = 0.0071 for MEKi+PI3Ki versus KRAS-G12Ci and p = 0.0069 for KRAS-G12Ci versus KRAS-G12Ci+AKTi+SRCi. In Figure F, hotomicrographs of anchorage-independent colonies growth in responses to treatment with KRAS inhibitor sotorasib and with the indicated inhibitors in NCI-H23 parental line and isogenic DLC1-KO line. Scale bar = 2 mm. For the statistical analysis for Figures C and E, parametric unpaired one tailed t-test with Welch’s correction was performed using Prism software, and no adjustments were made for multiple comparisons. Source data
Extended Data Fig. 8
Extended Data Fig. 8. Selinexor and tazemetostat treatment induce DLC1 protein expression in tumors. Treatment with the combination of three-drugs is not associated with changes in mouse coat appearance or weight loss.
a Sections from selinexor and tazemetostat treated tumors in Fig. 7d and Extended Data Fig.  8C were immunostained with antibodies to DLC1 (red) and DAPI was used to stain nuclei (blue). Tumor treated with selinexor alone or in combination with mk-2206 and saracatinib expressed higher levels of DLC1 protein than the vehicle control tumors. Scale bar, 100 μm. However, there were no upregulation of DLC1 protein in DLC1-KO line. b Quantification of DLC1 mean intensity in arbitrary units. Bar graphs represent mean value and error bars represent SD. N = 4 tumor sections per group. For the statistical analyses for Figure B, parametric unpaired one-tailed t-test with Welch’s correction was performed using Prism software, and no adjustments were made for multiple comparisons. p = 0.0091 for vehicle versus XPO1i, p = 0.0001 for vehicle versus XPO1i+AKTi+SRCi, and p = 0.0088 for vehicle versus EZH2i+AKTi+SRCi. c Treatment of tumor bearing mice with three-drug combination did not show visible side effects, such as change in coat appearance or weight loss unrelated to a decrease in tumor weight. N = 4 mice per group. d,e Graphs show average body weight of mice before treatment (d) and after three weeks treatment (e) in all groups. In Figure D and E, bar graphs represent mean value of mice weight for each group, and error bars represent SD. N = 4 mice per group for both D and E. The numbers at the bottom of panel E represent the average tumor weight. Much of the change in weight is attributable to the weight of the tumor. Source data

References

    1. Hanahan, D. Hallmarks of cancer: new dimensions. Cancer Discov.12, 31–46 (2022). - PubMed
    1. Nachmias, B. & Schimmer, A. D. Targeting nuclear import and export in hematological malignancies. Leukemia34, 2875–2886 (2020). - PMC - PubMed
    1. Boudhraa, Z., Carmona, E., Provencher, D. & Mes-Masson, A. M. Ran GTPase: a key player in tumor progression and metastasis. Front. Cell Dev. Biol.8, 345 (2020). - PMC - PubMed
    1. Tripathi, B. K. et al. Inhibition of cytoplasmic EZH2 induces antitumor activity through stabilization of the DLC1 tumor suppressor protein. Nat. Commun.12, 6941 (2021). - PMC - PubMed
    1. Frey, Y., Franz-Wachtel, M., Macek, B. & Olayioye, M. A. Proteasomal turnover of the RhoGAP tumor suppressor DLC1 is regulated by HECTD1 and USP7. Sci. Rep.12, 5036 (2022). - PMC - PubMed

Publication types

MeSH terms

LinkOut - more resources