. 2024 Nov 11;24(1):1381.
doi: 10.1186/s12885-024-13149-x.

Prognostic value of FDX1, the cuprotosis key gene, and its prediction models across imaging modalities and histology

Affiliations

Prognostic value of FDX1, the cuprotosis key gene, and its prediction models across imaging modalities and histology

Qiuyuan Yue et al. BMC Cancer. .

Abstract

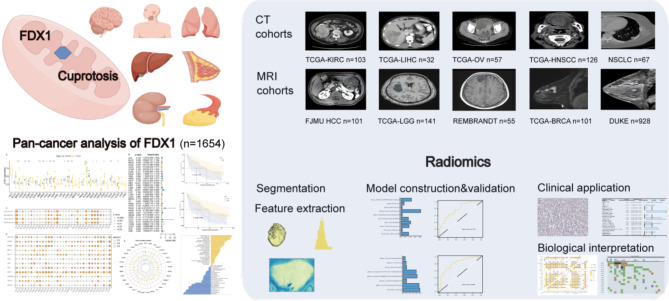
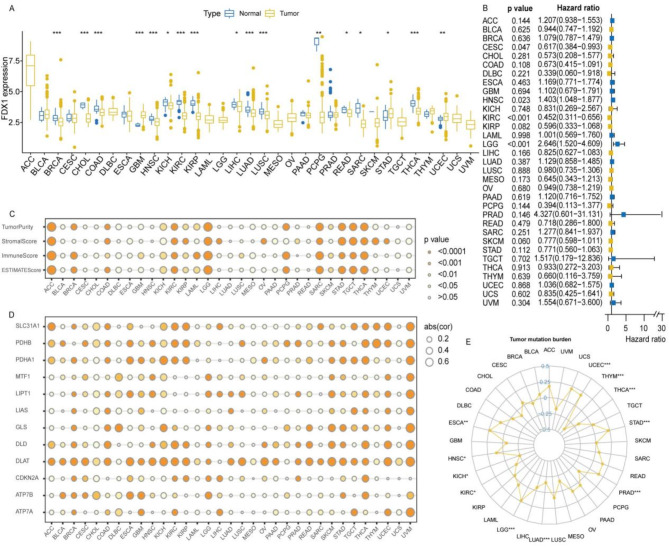
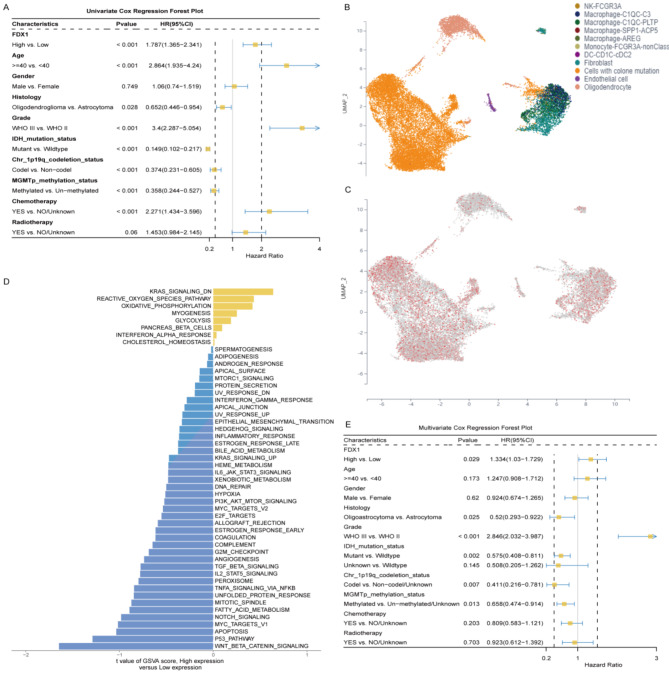
Background: Cuprotosis has been identified as a novel way of cell death. The key regulator ferredoxin 1 (FDX1) was explored via pan-cancer analysis, and its prediction models were proposed across seven malignancies and two imaging modalities.

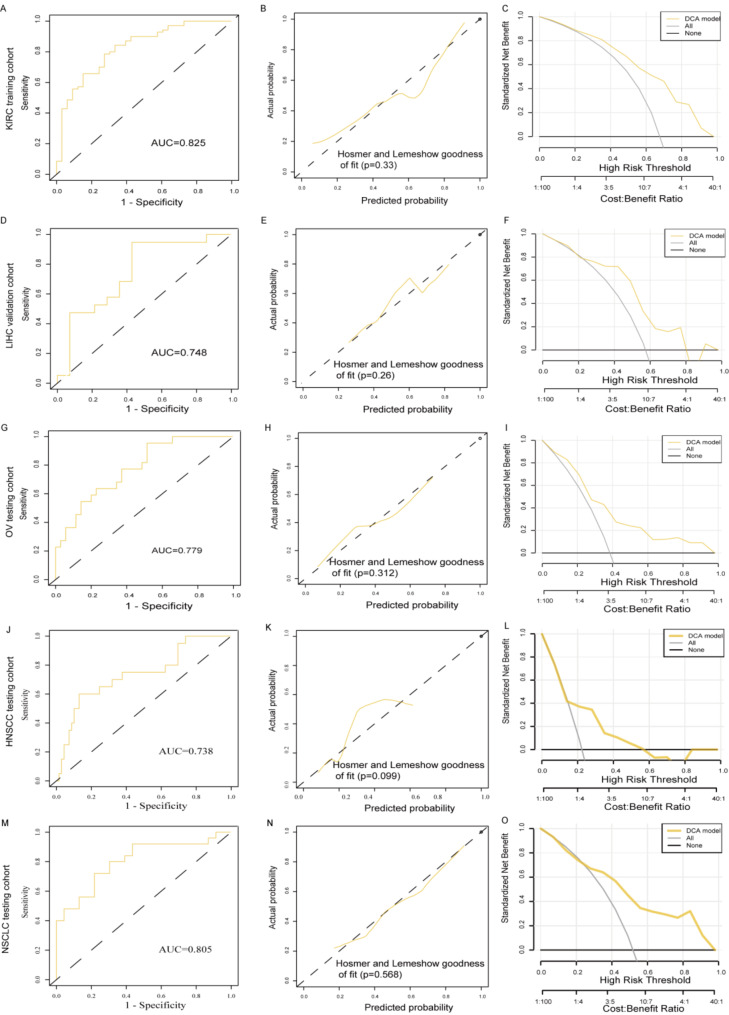
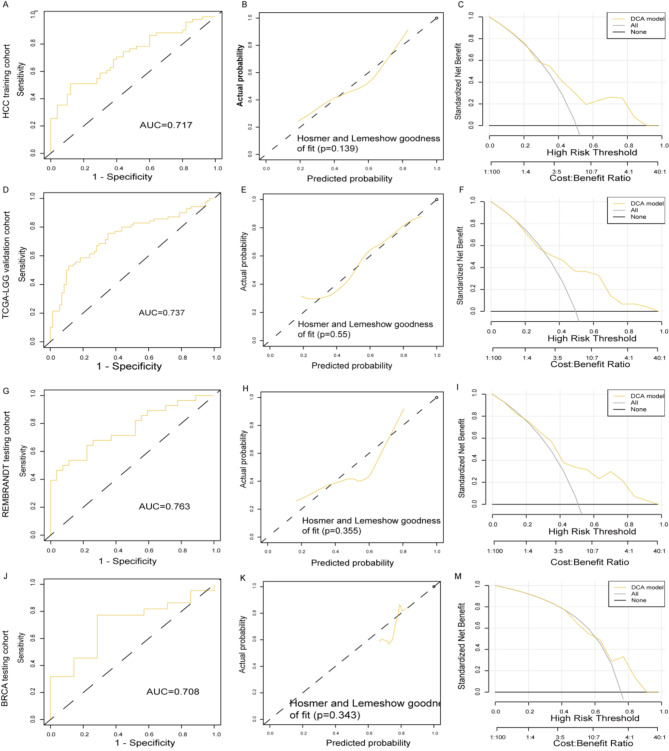
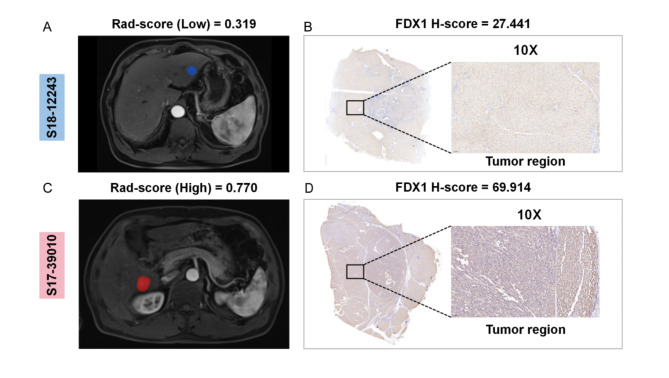
Methods: The prognostic value of FDX1 was explored via 1654 cases of 33 types of cancer in the Cancer Genome Atlas database. The MRI cohort of hepatocellular carcinoma in the First Affiliated Hospital of Fujian Medical University, and CT and MRI images from the Cancer Imaging Archive, REMBRANDT and Duke databases were exploited to formulate radiomic models to predict FDX1 expression. After segmentation of volumes of interest and feature extraction, the recursive feature elimination algorithm was used to screen features, logistic regression was used to model features, immunohistochemistry staining with FDX1 antibody was performed to test the radiomic model.

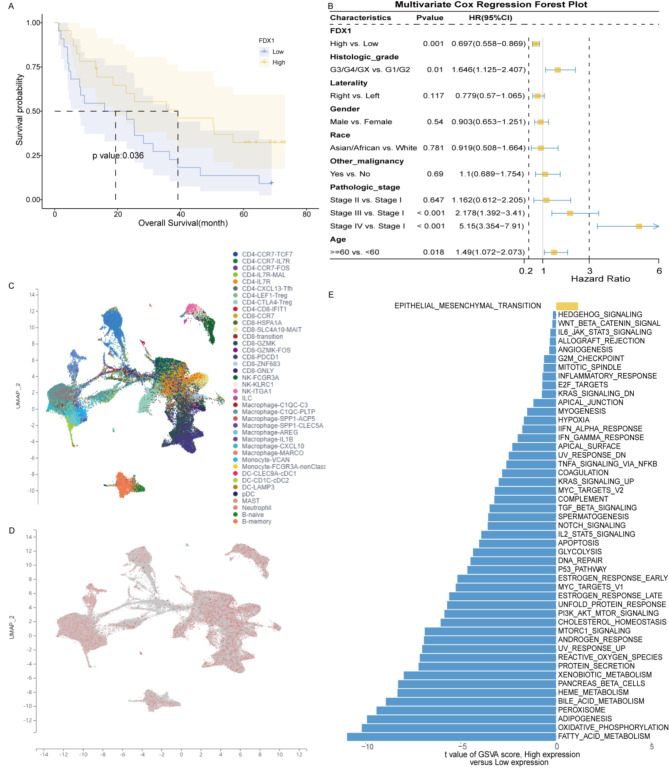
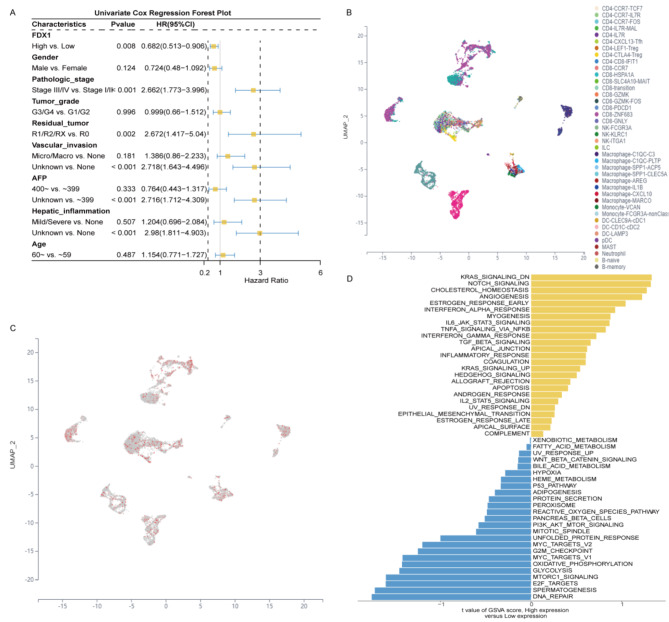
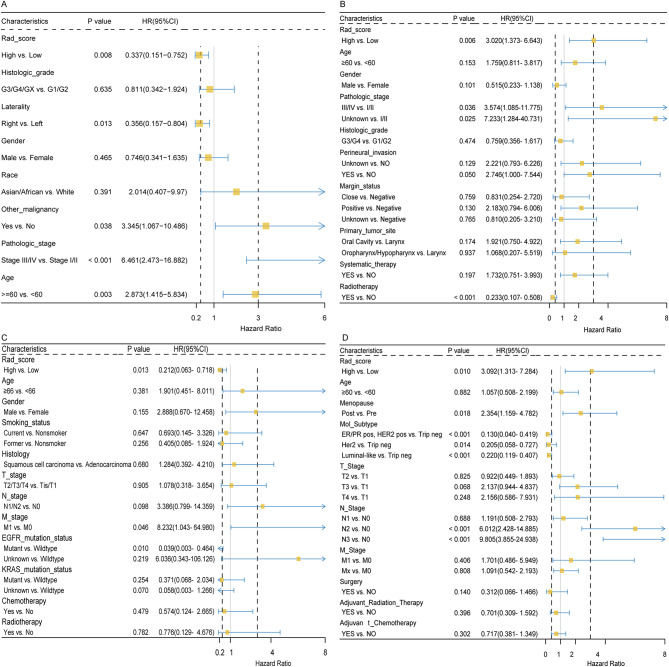
Results: FDX1 was found to be prognostic in various types of cancer. The area under the receiver operating characteristic curve of radiomic models to predict FDX1 expression reached 0.825 (95% CI = 0.739-0.911). Cross-tissue compatibility was confirmed in pan-cancer validation and test cohorts. Mechanistically, the radiomic score was significantly correlated with various immunosuppressive genes and gene mutations. The radiomic score was also found to be an independent prognostic factor, making it a potentially actionable biomarker in the clinical setting.

Conclusions: The expression of FDX1 could be non-invasively predicted via radiomics. The radiomic patterns with biological and clinical relevance across histology and modalities could have a broad impact on a larger population of patients.

Keywords: Cuprotosis; FDX1; Prognosis; Radiomics; Tumor microenvironment.


Conflict of interest statement

Declarations Ethics approval and consent to participate The study was performed in accordance with the ethical standards as laid down in the 1964 Declaration of Helsinki and its later amendments or comparable ethical standards. It’s approved by the Hospital Ethics Association (Ethics number: [2021] No. 090, the First Affiliated Hospital of Fujian Medical University). Patient anonymity was preserved, and informed consent was exempted in this retrospective study. Consent for publication Not applicable. Competing interests The authors declare no competing interests.

Figures

Fig. 1
Fig. 1
The flow of this study
Fig. 2
Fig. 2
Pan-cancer analysis of the significance of FDX1 in various cancer types. (A) Comparison of FDX1 expression levels across 33 cancer types, highlighting potential differences in expression patterns. (B) Cox regression analysis of overall survival to evaluate the prognostic significance of FDX1 across multiple cancers. (C) Correlation analysis between FDX1 expression and tumor microenvironment scores, exploring the impact of FDX1 on immune infiltration and the TME. (D) Analysis of FDX1’s relationship with cuprotosis-related genes, identifying FDX1’s role in copper-induced cell death. (E) Correlation between FDX1 expression and tumor mutational burden, exploring FDX1’s influence on genomic instability in different cancer types
Fig. 3
Fig. 3
Data mining in the KIRC cohort to assess the prognostic role of FDX1 in kidney renal clear cell carcinoma. (A) Kaplan-Meier curve showing the difference in OS between high and low FDX1 expression groups. (B) Cox regression analysis of OS in the KIRC cohort to determine the prognostic impact of FDX1. (C) FDX1 expression across different cell types in KIRC, illustrating its cellular distribution. (D) Heatmap of FDX1 expression values, categorized by high and low expression groups. (E) Gene set variation analysis of pathways enriched between FDX1 high and low expression groups
Fig. 4
Fig. 4
Data mining in the LIHC cohort to evaluate FDX1’s prognostic significance in liver hepatocellular carcinoma. (A) Cox regression analysis of overall survival to assess FDX1’s impact on survival in the LIHC cohort. (B) Distribution of FDX1 expression across different cell types in LIHC, illustrating its expression pattern. (C) Heatmap of FDX1 expression values, categorized by cell type. (D) GSVA revealing the pathways enriched in FDX1 high and low expression groups, exploring FDX1’s biological role in liver cancer
Fig. 5
Fig. 5
Data mining in the LGG cohort to evaluate the prognostic role of FDX1 in lower-grade glioma. (A) Cox regression analysis of overall survival in the TCGA-LGG cohort, assessing FDX1’s prognostic value. (B) FDX1 expression across different cell types in LGG, indicating the cellular distribution. (C) Heatmap of FDX1 expression values across different cell types in LGG. (D) GSVA of pathways enriched in FDX1 high and low expression groups in the LGG cohort. (E) Cox regression analysis of overall survival in the CCGA-LGG cohort to further validate FDX1’s prognostic role
Fig. 6
Fig. 6
Evaluation and validation of the CT-based radiomic model for predicting FDX1 expression across multiple cancer types. (A-C) Performance evaluation in the KIRC training cohort, using the ROC curve, calibration curve, and decision curve analysis to assess model accuracy. (D-F) Validation of the radiomic model in the LIHC cohort, with performance metrics including ROC, calibration, and decision curve analysis. (G-I) Testing of the model in the OV cohort, showing the generalizability of the model. (J-L) Performance metrics for the HNSCC cohort, including ROC, calibration, and decision curve analysis. (M-O) Testing of the model in the NSCLC cohort, with corresponding performance metrics
Fig. 7
Fig. 7
Evaluation and validation of the MRI-based radiomic model for predicting FDX1 expression in different cancer types. (A-C) Performance of the radiomic model in the HCC cohort (training set), including ROC curve, calibration curve, and decision curve analysis. (D-F) Validation of the MRI-based model in the TCGA-LGG cohort. (H-J) Testing the model in the REMBRANDT cohort, showing its ability to generalize across different cancers. (K-M) Evaluation of the model’s performance in the BRCA cohort, including ROC, calibration, and decision curve analysis
Fig. 8
Fig. 8
Immunohistochemistry staining of FDX1 in high and low rad_score specimens: (A and B) a representative MRI image with high rad_score and its corresponding immunohistochemistry staining of FDX1; (C and D) a representative MRI image with low rad_score and its corresponding immunohistochemistry staining of FDX1
Fig. 9
Fig. 9
Cox regression analysis of overall survival based on radiomic scores in various cancer types. (A) KIRC cohort, (B) HNSCC cohort, (C) NSCLC cohort, and (D) BRCA cohort, illustrating the prognostic significance of the radiomic scores across these cancer types
Fig. 10
Fig. 10
Analysis of differential mutation patterns between high and low rad_score groups. (A) Mutation analysis in the OV cohort, (B) LGG cohort, (C) BRCA cohort, identifying key mutations associated with high and low radiomic scores across these cancers

References

    1. 1. Siegel RL, Miller KD, Wagle NS, Jemal A: Cancer statistics, 2023. CA Cancer J Clin 2023, 73(1):17–48. - PubMed
    1. 2. Sun Q, Chen Y, Liang C, Zhao Y, Lv X, Zou Y, Yan K, Zheng H, Liang D, Li Z-C: Biologic Pathways Underlying Prognostic Radiomics Phenotypes from Paired MRI and RNA Sequencing in Glioblastoma. Radiology 2021, 301(3):654–663. - PubMed
    1. 3. Yan J, Liu L, Wang W, Zhao Y, Li KK-W, Li K, Wang L, Yuan B, Geng H, Zhang S et al: Radiomic Features From Multi-Parameter MRI Combined With Clinical Parameters Predict Molecular Subgroups in Patients With Medulloblastoma. Front Oncol 2020, 10:558162. - PMC - PubMed
    1. 4. van Geel JJL, Boers J, Elias SG, Glaudemans AWJM, de Vries EFJ, Hospers GAP, van Kruchten M, Kuip EJM, Jager A, Menke-van der Houven van Oordt WC et al: Clinical Validity of 16α-[F]Fluoro-17β-Estradiol Positron Emission Tomography/Computed Tomography to Assess Estrogen Receptor Status in Newly Diagnosed Metastatic Breast Cancer. J Clin Oncol 2022:JCO2200400. - PubMed
    1. 5. Choi YS, Ahn SS, Chang JH, Kang S-G, Kim EH, Kim SH, Jain R, Lee S-K: Machine learning and radiomic phenotyping of lower grade gliomas: improving survival prediction. Eur Radiol 2020, 30(7):3834–3842. - PubMed

MeSH terms

Substances

LinkOut - more resources