. 2024 Nov 11;24(1):1376.
doi: 10.1186/s12913-024-11729-y.

Application of mathematical models on efficiency evaluation and intervention of medical institutions in China

Affiliations

Application of mathematical models on efficiency evaluation and intervention of medical institutions in China

Qiwen Tai et al. BMC Health Serv Res. .

Abstract

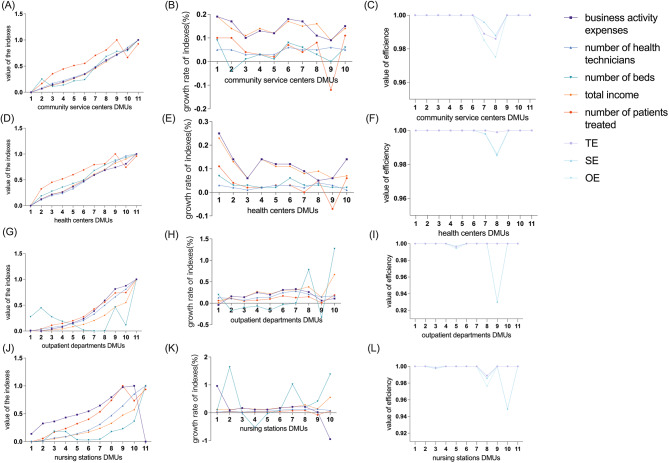
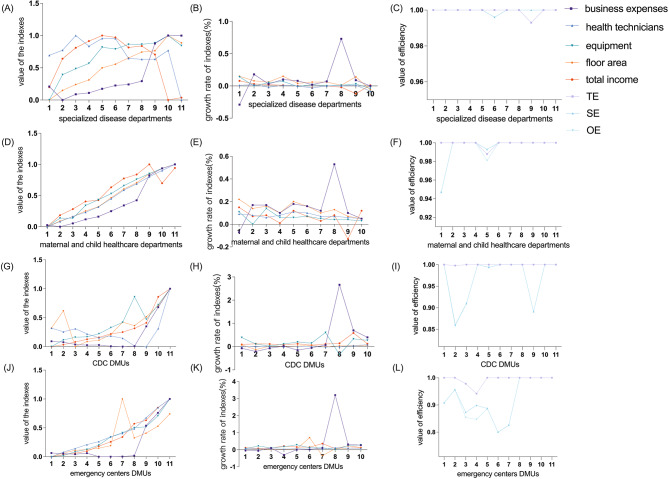
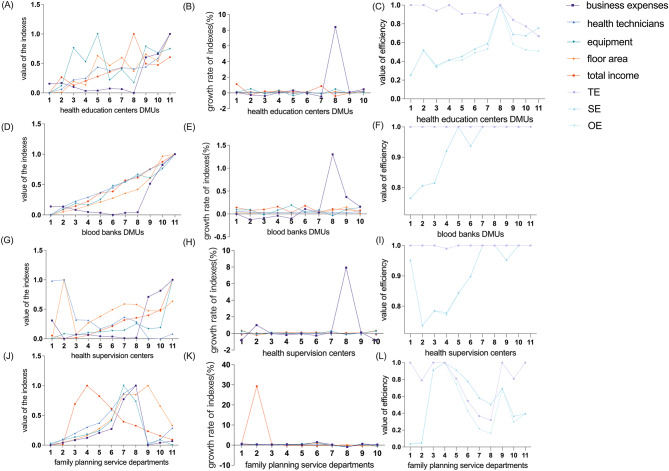
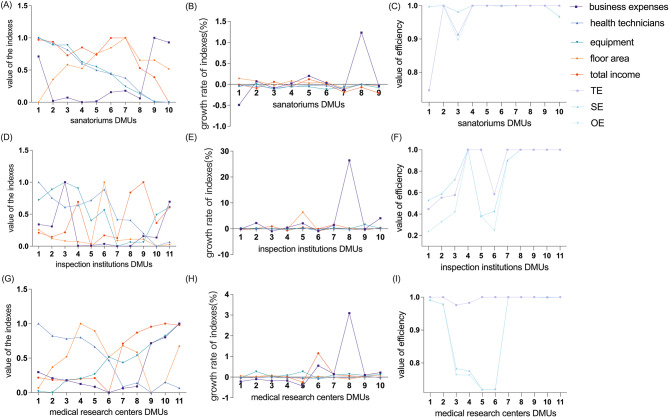
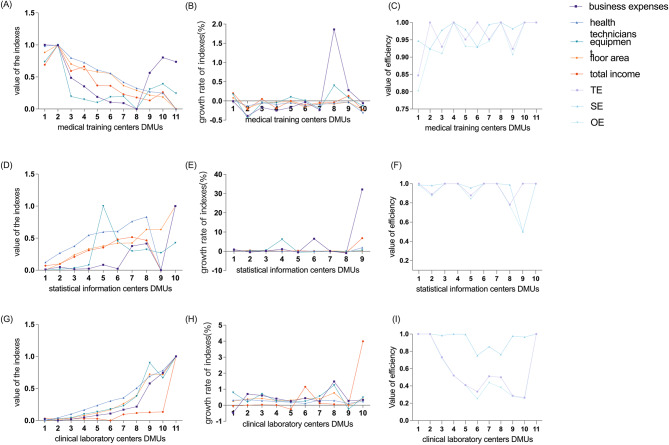
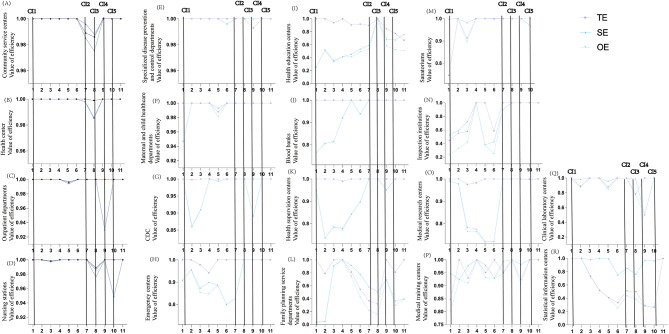
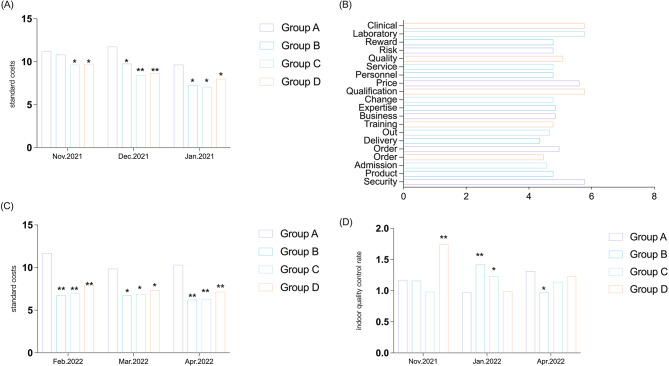
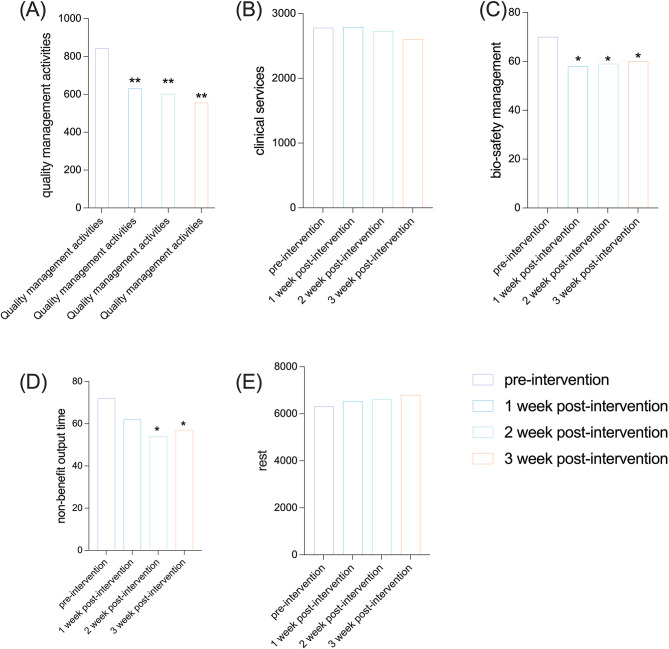
BACKGROUND : The efficiency of medical services directly impacts the economic burden of healthcare, making it crucial to analyze the input-output efficiency of various types of medical institutions. However, while hospitals had been extensively analyzed for their efficiency, other types of medical institutions had received limited attention in this regard. METHODS : In this study, we employed data envelopment analysis (DEA) methods based on time series and internal benchmarks to autonomously assess the efficiency of 18 distinct categories of healthcare facilities in China over the past decade. The verification was conducted through the utilization of the critical incident technique (CIT). Additionally, we utilized the Delphi process (AHP) method to evaluate suppliers of medical consumables, implemented a multi-population genetic algorithm for managing these consumethod and analytic hierarchymables efficiently, and applied stakeholder theory to manage medical personnel efficiency. RESULTS : Our findings indicated that medical institutions capable of providing clinical services exhibited higher levels of efficiency compared to those unable to do so. Multiple indicators suggested redundancy within these institutions. Notably, comprehensive benefit evaluation revealed that clinical laboratory had performed poorly over the past decade. We selected an inefficient medical institution for intervention in reagent management and the work efficiency of medical staff. After implementing the Delphi method and multi-population genetic algorithm for consumable replenishment, the reagent cost was reduced by 40%, 39% and 31% respectively in each of the three experimental groups, compared to the control group. By applying stakeholder theory and process reengineering methods, we were able to shorten quality control management time for medical staff in the experimental group by 41 min per day, reduce clinical service time by 25 min per day, and extend rest time by 70 min per day, while the quality indicators were all meeting the targets. CONCLUSION: By employing various mathematical models as described above, we were able to reduce costs associated with medical consumables and enhance medical personnel work efficiency without compromising quality objectives.

Keywords: AHP; CIT; DEA; Delphi; Medical consumable; Medical institution; Medical personnel efficiency; Multi-population genetic algorithm; Stakeholder.


Conflict of interest statement

Declarations Ethics approval and consent to participate This study received ethical approval from the Research Ethics Committee (REC) of the Ping An Healthcare Diagnostics Center with the reference number ‘2021 Ethics approval (declaration) No. 67’. The study obtained voluntary and informed consent from all participants, who expressed their willingness to participate. Furthermore, each eligible participant was provided with detailed information about the study and their right to withdraw or decline participation at any point. Additionally, a unique identifier was assigned to ensure the confidentiality and privacy of respondents’ data. Consent for publication Not applicable. Competing interests The authors declare no competing interests.

Figures

Fig. 1
Fig. 1
The growth and efficiency analysis of the input-output index in primary medical and health institutions. A The changes of indicators in community service centers. B The growth rate of indicators in community service centers. C The changes in the TE, SE and OE of community service centers from 2011 to 2021. D The changes of indicators in health centers. E The growth rate of indicators in health centers. F The changes in the TE, SE and OE of health centers from 2011 to 2021. G The changes of indicators in outpatient departments. H The growth rate of indicators in outpatient departments. I The changes in the TE, SE and OE of outpatient departments from 2011 to 2021. J The changes of indicators in nursing stations. K The growth rate of indicators in nursing stations. L The changes in the TE, SE and OE of nursing stations from 2011 to 2021. The data was standardized using the min-max method in SPSS before creating the line chart of indicator changes, enabling simultaneous display of different data groups in the chart
Fig. 2
Fig. 2
The growth and efficiency analysis of the specialized public health institutions. A The changes of indicators in specialized disease prevention and control departments. B The growth rate of indicators in specialized disease prevention and control departments. C The changes in the TE, SE and OE of specialized disease prevention and control departments from 2011 to 2021. D The changes of indicators in maternal and child healthcare departments. E The growth rate of indicators in maternal and child healthcare departments. F The changes in the TE, SE and OE of maternal and child healthcare departments from 2011 to 2021. G The changes of indicators in CDC. H The growth rate of indicators in CDC. I The changes in the TE, SE and OE of CDC from 2011 to 2021. J The changes of indicators in emergency centers. K The growth rate of indicators in emergency centers. L The changes in the TE, SE and OE of emergency centers from 2011 to 2021. The data was standardized using the min-max method in SPSS before creating the line chart of indicator changes, enabling simultaneous display of different data groups in the chart
Fig. 3
Fig. 3
The growth and efficiency analysis of the specialized public health institutions. A The changes of indicators in health education centers. B The growth rate of indicators in health education centers. C The changes in the TE, SE and OE of health education centers from 2011 to 2021. D The changes of indicators in blood banks. E The growth rate of indicators in blood banks. F The changes in the TE, SE and OE of blood banks from 2011 to 2021. G The changes of indicators in health supervision centers. H The growth rate of indicators in health supervision centers. I The changes in the TE, SE and OE of health supervision centers from 2011 to 2021. J The changes of indicators in family planning service departments. K The growth rate of indicators in family planning service departments. L The changes in the TE, SE and OE of family planning service departments from 2011 to 2021. The data was standardized using the min-max method in SPSS before creating the line chart of indicator changes, enabling simultaneous display of different data groups in the chart
Fig. 4
Fig. 4
The growth and efficiency analysis of the other health institutions. A The changes of indicators in sanatoriums. B The growth rate of indicators in sanatoriums. C The changes in the TE, SE and OE of sanatoriums from 2011 to 2021. D The changes of indicators in inspection institutions. E The growth rate of indicators in inspection institutions. F The changes in the TE, SE and OE of inspection institutions from 2011 to 2021. G The changes of indicators in medical research centers. H The growth rate of indicators in medical research centers. I The changes in the TE, SE and OE of medical research centers from 2011 to 2021
Fig. 5
Fig. 5
The growth and efficiency analysis of the other health institutions. A The changes of indicators in on-the-job medical training centers. B The growth rate of indicators in on-the-job medical training centers. C The changes in the TE, SE and OE of on-the-job medical training centers from 2011 to 2021. D The changes of indicators in statistical information centers. E The growth rate of indicators in statistical information centers. F The changes in the TE, SE and OE of statistical information centers from 2011 to 2021. G The changes of indicators in clinical laboratory centers. H The growth rate of indicators in clinical laboratory centers. I The changes in the TE, SE and OE of clinical laboratory centers from 2011 to 2021. The raw statistics had been documented in Tables S7 through S42 within the supplementary materials
Fig. 6
Fig. 6
The critical incident analysis (2001–2011). Community service centers. Health centers.C. Nursing stations. Outpatient departments. Specialized disease prevention and control departments. Maternal and child healthcare departments. Centers for disease control and prevention (CDC). Emergency centers. Health education centers. Blood banks. Health supervision centers. Family planning service departments. Sanatoriums. Inspection institutions. Medical research centers. On-the-job medical training centers. clinical laboratory centers. Statistical information centers
Fig. 7
Fig. 7
The implementation of new consumable management mode contributed to cost reduction in reagent consumables. A The statistical analysis was conducted using Prism 9.0 software. Firstly, the normal distribution test was performed using the Shapiro-Wilk test. If the significance level was greater than 0.05, it indicated that the results adhere to a normal distribution, enabling further application of the t-test. The results were in accordance with the normal distribution from a statistical perspective. Subsequently, t-tests were carried out for each experimental group (groups B, C and D) in comparison with the control group (group A). Where P<0.05 indicated that the difference was statistically significant. The experimental results were obtained from five biochemical reagents with equivalent costs. B The weights of each index obtained through AHP hierarchical analysis using SPSS 23.0, which had successfully passed the consistency test. C The Delphi method was employed to construct a supplier evaluation table, which was utilized for assessing the three suppliers. The supplier with the highest score was chosen to supply biochemical reagents for the experimental group. The t-tests were carried out for each experimental group (groups B, C and D) in comparison with the control group (group A). Where P<0.05 indicated that the difference was statistically significant. The experimental results were obtained from five biochemical reagents with equivalent costs. D Conducted statistical analysis on indoor quality control. The t-tests were carried out for each experimental group (groups B, C and D) in comparison with the control group (group A). Where P<0.05 indicated that the difference was statistically significant
Fig. 8
Fig. 8
The application of stakeholder theory enabled to identify viable approaches for enhancing personnel efficiency. After the intelligent upgrade of the laboratory information management system, Tomato-like statistics were conducted on the working and resting hours of the technical staff in the clinical laboratory center. The statistical analysis was conducted using Prism 9.0 software. Firstly, the normal distribution test was performed using the Shapiro-Wilk test. If the significance level was greater than 0.05, it indicated that the results adhere to a normal distribution, enabling further application of the t-test. The results were in accordance with the normal distribution from a statistical perspective. Prsim 9.0 t-test was utilized to assess the disparity between each experimental group and control group. Where P<0.05 indicated that the difference was statistically significant. The experimental results were obtained from six technicians. A Time spent on quality management activaties before and after the intervention. B Time spent on clinical services before and after the intervention. C Time spent on bio-safety management before and after the intervention. D Time spent on non-benefit out before and after the intervention. E Time spent on rest before and after the intervention

Similar articles

Cited by

References

    1. Abou Jaoude GJ, Garcia Baena I, Nguhiu P, et al. National tuberculosis spending efficiency and its associated factors in 121 low-income and middle-income countries, 2010–19: a data envelopment and stochastic frontier analysis. Lancet Glob Health. 2022;10(5):e649–60. - PMC - PubMed
    1. Pyne S, Sach TH, Lawrence M, et al. Cost-effectiveness of spironolactone for adult female acne (SAFA): economic evaluation alongside a randomised controlled trial. BMJ Open. 2023;13(12):e073245. - PMC - PubMed
    1. Kaneko T, Nagayama H, Ikeda K, et al. Cost-effectiveness of occupational therapy for older adults: a protocol for an updated systematic review. BMJ Open. 2023;13(12):e079318. - PMC - PubMed
    1. Strobel RJ, Likosky DS, Brescia AA, et al. The Effect of Hospital Market Competition on the adoption of transcatheter aortic valve replacement. Ann Thorac Surg. 2020;109(2):473–9. - PMC - PubMed
    1. Chen Z, Shi J, Xu M, Mao L. Efficiency evaluation of surgical nursing wards based on data envelopment analysis. J Nurs Manag. 2022;30(7):3218–26. - PubMed

LinkOut - more resources