. 2024 Nov 11;23(1):405.
doi: 10.1186/s12933-024-02502-w.

Elevated glucose levels increase vascular calcification risk by disrupting extracellular pyrophosphate metabolism

Affiliations

Elevated glucose levels increase vascular calcification risk by disrupting extracellular pyrophosphate metabolism

Alicia Flores-Roco et al. Cardiovasc Diabetol. .

Abstract

Background: Vascular calcification is a major contributor to cardiovascular disease, especially diabetes, where it exacerbates morbidity and mortality. Although pyrophosphate is a recognized natural inhibitor of vascular calcification, there have been no prior studies examining its specific deficiency in diabetic conditions. This study is the first to analyze the direct link between elevated glucose levels and disruptions in extracellular pyrophosphate metabolism.

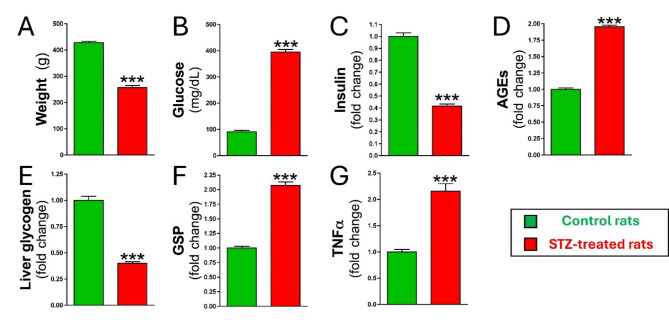
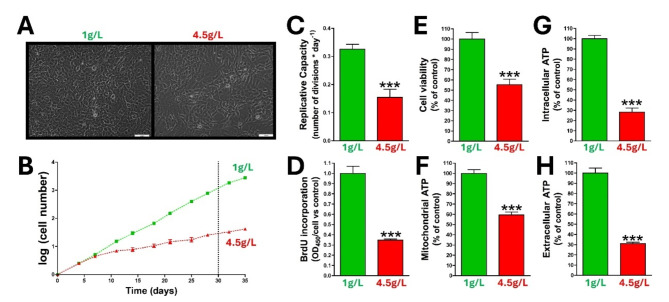
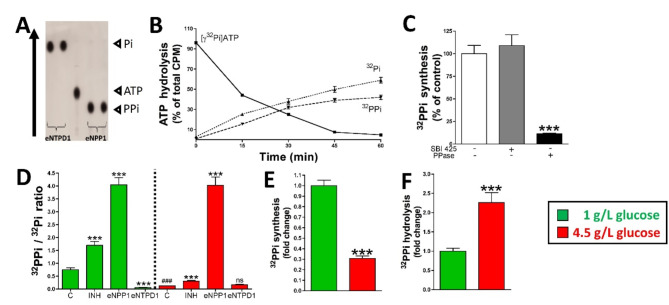
Methods: Rat aortic smooth muscle cells, streptozotocin (STZ)-induced diabetic rats, and diabetic human aortic smooth muscle cells were used to assess the effects of elevated glucose levels on pyrophosphate metabolism and vascular calcification. The techniques used include extracellular pyrophosphate metabolism assays, thin-layer chromatography, phosphate-induced calcification assays, BrdU incorporation for DNA synthesis, aortic smooth muscle cell viability and proliferation assays, and quantitative PCR for enzyme expression analysis. Additionally, extracellular pyrophosphate metabolism was examined through the use of radiolabeled isotopes to track ATP and pyrophosphate transformations.

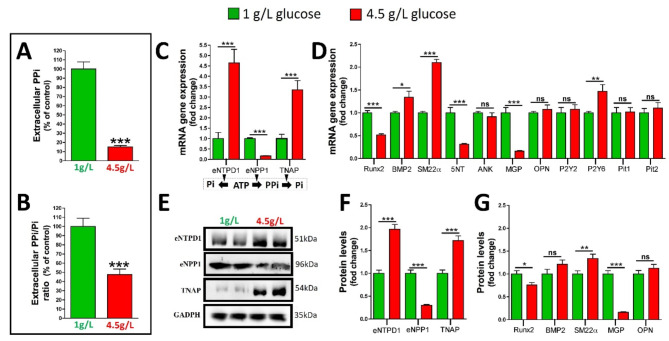
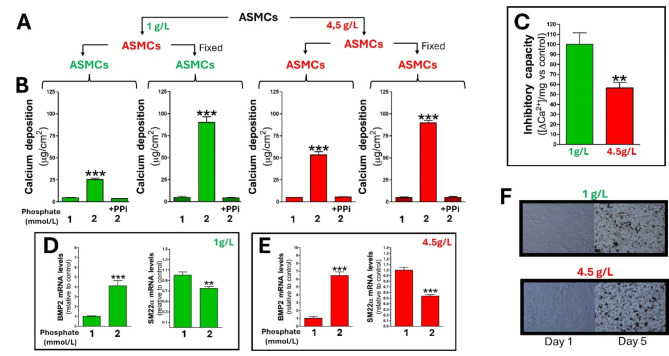
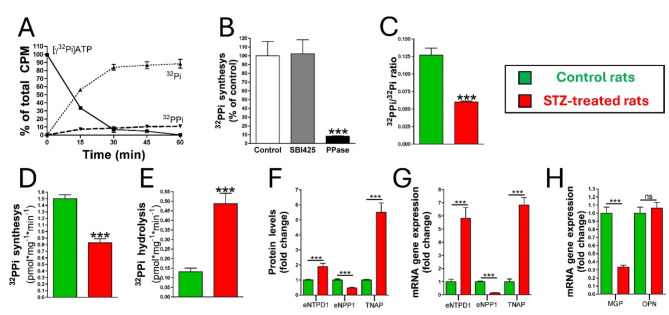
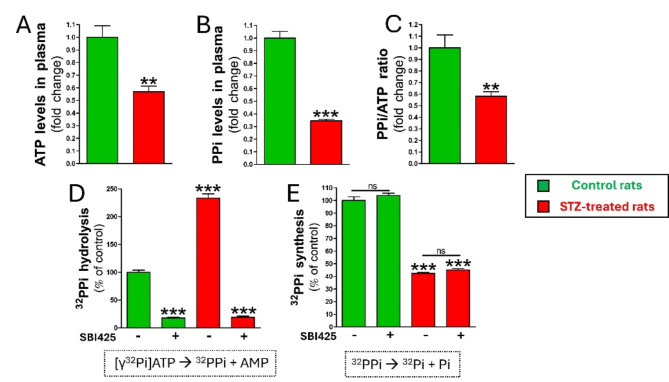
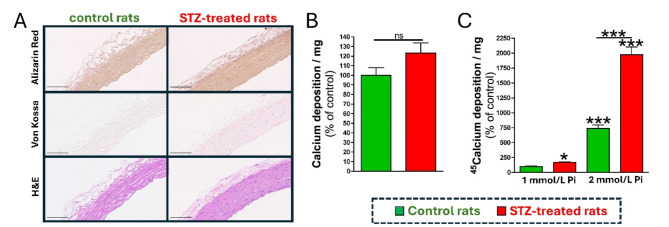
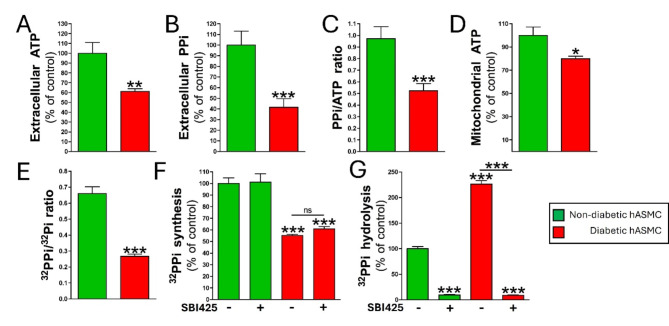
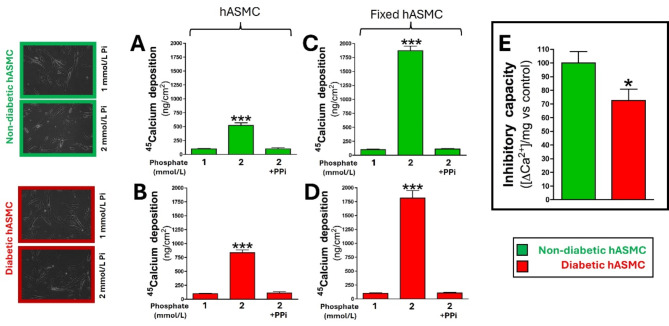
Results: Elevated glucose led to a significant reduction in extracellular pyrophosphate across all diabetic models. This metabolic disruption was marked by notable downregulation of both the expression and activity of ectonucleotide pyrophosphatase/phosphodiesterase 1, a key enzyme that converts ATP to pyrophosphate. We also observed an upregulation of ectonucleoside triphosphate diphosphohydrolase 1, which preferentially hydrolyzes ATP to inorganic phosphate rather than pyrophosphate. Moreover, tissue-nonspecific alkaline phosphatase activity was markedly elevated across all diabetic models. This shift in enzyme activity significantly reduced the pyrophosphate/phosphate ratio. In addition, we noted a marked downregulation of matrix Gla protein, another inhibitor of vascular calcification. The impaired pyrophosphate metabolism was further corroborated by calcification experiments across all three diabetic models, which demonstrated an increased propensity for vascular calcification.

Conclusions: This study demonstrated that diabetes-induced high glucose disrupts extracellular pyrophosphate metabolism, compromising its protective role against vascular calcification. These findings identify pyrophosphate deficiency as a potential mechanism in diabetic vascular calcification, highlighting a new therapeutic target. Strategies aimed at restoring or enhancing pyrophosphate levels may offer significant potential in mitigating cardiovascular complications in diabetic patients, meriting further investigation.

Keywords: ATP; Aging; Diabetes; Phosphate; Pyrophosphate; Vascular calcification.


Conflict of interest statement

Declarations Competing interests The authors declare no competing interests.

Figures

Fig. 1
Fig. 1
Impairment of glucose homeostasis in STZ-treated rats.A Body weight, B blood glucose levels, C blood insulin levels, D advanced glycation end products (AGEs), E liver glycogen content, F glycated serum protein (GSP), and G tumor necrosis factor-alpha (TNFα) levels in plasma from STZ-treated (left, green) and control rats (right, red). The data are shown as the mean ± SEM (n = 12). Statistical significance was assessed via Student’s t test. Asterisks denote significant differences, with ***P < 0.001
Fig. 2
Fig. 2
High glucose levels impair ASMC viability. Aortic smooth muscle cells (ASMCs) were incubated in MEM containing either 1 g/L (green) or 4.5 g/L (red) glucose. A Representative microscopy images (10x; scale bar: 100 μm) of ASMCs after 30 days of incubation. B Number of replicative cells at the indicated time points, with cell counting starting at passage 2 and continuing until day 35. C Mean number of cell divisions per day over the first 30 days (n = 10). D Incorporation of 5-bromodeoxyuridine (BrdU) into DNA as a measure of replication (n = 10). E Cell viability (n = 16). F Mitochondrial ATP synthesis (n = 16). G Intracellular ATP content (n = 12). H Extracellular ATP content (n = 16). The data are shown as the mean ± SEM. Statistical analysis was performed via Student’s t test, with asterisks indicating a significant difference at ***P < 0.001
Fig. 3
Fig. 3
Impact of high glucose on extracellular pyrophosphate metabolism. Aortic smooth muscle cells were cultured for one month in media containing either low (1 g/L) or high (4.5 g/L) glucose. A Measurement of extracellular pyrophosphate levels. B Extracellular pyrophosphate-to-ATP ratio. C, D Analysis of the gene expression of key enzymes involved in extracellular pyrophosphate metabolism, including eNTPD1, eNPP1, and TNAP, from isolated total RNA. (E) Immunoblot analysis of proteins associated with extracellular pyrophosphate metabolism. F, G Quantification of protein levels via ELISA, highlighting significant differences. The data are shown as the mean ± SEM, with data derived from 4 independent experiments, each containing 4 replicate plates. Statistical significance was determined via Student’s t test, with asterisks denoting significance levels: *P < 0.05; **P < 0.01; ***P < 0.001
Fig. 4
Fig. 4
High glucose levels impair the pyrophosphate-to-phosphate ratio. Aortic smooth muscle cells were incubated for one month in medium containing 1 g/L or 4.5 g/L glucose. A Autoradiograph displaying representative products from the hydrolysis of ATP (1 µmol/L ATP, 10 µCi/mL [γ32Pi]ATP) incubated with or without recombinant eNPP1 (ectonucleotide pyrophosphatase/phosphodiesterase 1) or eNTPD1 (ectonucleoside triphosphate diphosphohydrolase 1) enzymes. Enzymatic hydrolysis generated radiolabeled 32PPi (32-pyrophosphate) and 32Pi (32-phosphate), which, alongside unreacted [γ32Pi]ATP, were separated by thin-layer chromatography (TLC), as detailed in the Methods section. B Representative time course of ATP hydrolysis showing the products released over time. C Synthesis of the pyrophosphate 32PPi via hydrolysis of [γ32Pi]ATP (10 µCi/mL; 1 µmol/L ATP) in the absence or presence of 100 µmol/L SBI245 (a specific TNAP inhibitor) or inorganic pyrophosphatase (PPase). D The pyrophosphate-to-phosphate (32PPi/32Pi) ratio was quantified following hydrolysis of [γ32Pi]ATP (10 µCi/mL; 1 µmol/L ATP) under various conditions: in the absence of inhibitors (Control), in the presence of an ectonucleoside triphosphate diphosphohydrolase (eNTPD) inhibitor (INH, 200 µmol/L), or with the recombinant enzymes eNPP1 and eNTPD1 (100 ng/mL). Experiments were conducted in media containing either physiological (1 g/L) or elevated (4.5 g/L) glucose concentrations. D) Synthesis of 32PPi by hydrolysis of [γ32Pi]ATP (10 µCi/mL and 1 µmol/L ATP). E Hydrolysis of 32PPi (10 µCi/mL and 5 µmol/L PPi). The results are shown as the mean ± SEM (4 independent experiments with 4 plates per experiment). Student’s t test (E, F) or one-way ANOVA with Tukey’s post hoc test (C, D) was used for statistical analysis. Asterisks indicate a statistically significant difference compared with the control group: *P < 0.05; ***P < 0.001. ### Indicates a value of P < 0.001 compared with the control group (1 g/L)
Fig. 5
Fig. 5
High glucose levels accelerated phosphate-induced aortic smooth muscle cell calcification. A Schematic representation of the experimental setup. Rat ASMCs were incubated in MEM containing either 1 g/L or 4.5 g/L glucose for one month. Following this period, the cells were incubated overnight in MEM containing 0.1% FBS. Some cells were then fixed as detailed in the Methods section. The cells were subsequently incubated in MEM (containing 0.1% FBS) with either 1 mmol/L or 2 mmol/L phosphate in the absence or presence of 100 µmol/L pyrophosphate (+ PPi). After 7 days of incubation, with daily media replacement, the calcium content was measured as described in the Materials and Methods section. A Schematic overview of the experimental design for calcification assays. B Quantitative measurements of calcium deposition across the four experimental groups. C Calcification inhibitory capacity was calculated as the difference in calcium deposition between living and fixed cells (ΔCa²⁺). D and E Quantitative PCR analysis of the mRNA levels of BMP2 and SM22α in ASMCs subjected to phosphate-induced calcification and incubated with 1 g/L glucose (D) or 4.5 g/L glucose (E). F Representative microscopy images (10x magnification; scale bar: 100 μm) showing calcification in ASMCs incubated with 1 g/L glucose (top) or 4.5 g/L glucose (bottom). The data are shown as the mean ± SEM from four independent experiments, each with three plates per experiment. Statistical analysis was performed via one-way ANOVA with Tukey’s post hoc test (D, E) and Student’s t test (B, C). Asterisks indicate a significant difference with **P < 0.01; ***P < 0.001
Fig. 6
Fig. 6
STZ-treated rats exhibit impaired extracellular pyrophosphate metabolism in the aortic wall. A A representative time course of ATP hydrolysis was conducted using a 1 µmol/L ATP solution containing 10 µCi/mL [γ-32P]ATP as a radiotracer. The products of hydrolysis, 32PPi (32-pyrophosphate), 32Pi (32-phosphate), and [γ-32P]ATP-, were separated and quantified via thin layer chromatography, as outlined in the Methods section. B The synthesis of pyrophosphate (PPi) was analyzed by hydrolyzing 1 µmol/L ATP containing 10 µCi/mL [γ-32P]ATP as a radiotracer. The reactions were carried out in the absence or presence of either a specific TNAP inhibitor (SBI-425) or inorganic pyrophosphatase (PPase). C The ratio of 32PPi to 32Pi generated by ATP hydrolysis was calculated to assess the efficiency and specificity of pyrophosphate synthesis. D The synthesis of 32PPi was evaluated by hydrolyzing 1 µmol/L ATP containing 10 µCi/mL [γ-32P]ATP. E The release of 32Pi was measured following the hydrolysis of 5 µmol/L pyrophosphate, which contained 10 µCi/mL 32PPi as a radiotracer. F Quantification of protein levels via ELISA. G, H Total RNA was isolated from rat aortas to evaluate the expression levels of key enzymes involved in extracellular pyrophosphate metabolism, including eNTPD1 (ectonucleoside triphosphate diphosphohydrolase 1), eNPP1 (ectonucleotide pyrophosphatase/phosphodiesterase 1), and tissue-nonspecific alkaline phosphatase (TNAP) (panel G. Additionally, the expression of calcification-related proteins, such as matrix Gla protein (MGP) and osteopontin (OPN), was assessed (panel H). The data are shown as the mean ± SEM and represent data from 12–16 independent aortas. Statistical analyses were performed via Student’s t test. Asterisks indicate a significant difference with ***P < 0.001
Fig. 7
Fig. 7
STZ-treated rats presented reduced ATP and pyrophosphate levels in the plasma. A ATP concentration and B pyrophosphate (PPi) concentration in plasma were measured in both STZ-treated and untreated rats over 1 month. C Pyrophosphate-to-ATP ratio. D 32-Pyrophosphate (32PPi) synthesis in blood was assessed via the hydrolysis of 1 µmol/L ATP, containing 10 µCi/mL [γ32Pi]ATP as a radiotracer, in the absence or presence of a specific TNAP inhibitor (SBI425). E) Pyrophosphate hydrolysis was analyzed in blood by measuring the release of 32-phosphate (32Pi) following the hydrolysis of 5 µmol/L pyrophosphate, with 10 µCi/mL 32PPi used as a radiotracer. The results are shown as the mean ± SEM (12 rats per group). Statistical analyses were conducted via Student’s t test (A, B, C) or one-way ANOVA with Tukey’s post hoc test (D, E). Asterisks indicate a significant difference with **P < 0.01; *P < 0.001
Fig. 8
Fig. 8
Increased propensity for calcification in aortas from STZ-treated rats. A Representative images (original magnification ×20; scale bar: 100 μm) of H&E, Von Kossa, and Alizarin Red staining images of histological sections of aortic rings from the indicated groups of rats. B Calcium content in the aortic rings, expressed as µg of calcium per milligram of dry aorta. “Control” refers to aortas from nontreated rats. C Accumulation of calcium-45 (45Calcium) in aortic rings incubated ex vivo for 5 days with 1 mmol/L phosphate and 10 µCi/mL calcium-45 radiotracer. D Accumulation of calcium-45 (45Calcium) in aortic rings incubated ex vivo for 5 days with 2 mmol/L phosphate and 10 µCi/mL calcium-45 radiotracer. In both panels (C and D), “Control” refers to aortas from nontreated rats incubated with 1 mmol/L phosphate. The data are shown as the mean ± SEM (12 aortic rings per group). Statistical analyses were performed via Student’s t test, with asterisks indicating significant differences at *P < 0.001
Fig. 9
Fig. 9
Diabetic human aortic smooth muscle cells exhibit impaired extracellular pyrophosphate metabolism. A Extracellular ATP concentration and B extracellular pyrophosphate concentration in human aortic smooth muscle cells from both diabetic and non-diabetic (Control) individuals. C Pyrophosphate-to-ATP ratio. D Mitochondrial ATP synthesis. E 32-Pyrophosphate-to-32-phosphate ratio released by hydrolysis of ATP containing 10 µCi/mL [γ32Pi]ATP as a radiotracer. F 32-Pyrophosphate (32PPi) synthesis was evaluated through the hydrolysis of 1 µmol/L ATP, containing 10 µCi/mL [γ32Pi]ATP as a radiotracer, in the absence or presence of a specific TNAP inhibitor (SBI 425). G Pyrophosphate hydrolysis was assessed by measuring the release of 32-phosphate (32Pi) following the hydrolysis of 5 µmol/L pyrophosphate, with 10 µCi/mL 32PPi used as a radiotracer. The results are shown as the mean ± SEM (n = 16; 4 independent experiments with 4 culture plates per experiment). Statistical analyses were conducted via Student’s t test (AE) or one-way ANOVA with Tukey’s post hoc test (F, G). Asterisks indicate a significant difference with *P < 0.05; **P < 0.01; ***P < 0.001
Fig. 10
Fig. 10
Reduced inhibitory capacity of diabetic human smooth muscle cells to prevent phosphate-induced calcification. Human non-diabetic and diabetic aortic smooth muscle cells (hASMCs) were grown to confluence as described in the Methods section. Some cells were then fixed as detailed in the same section. The cells were subsequently incubated in MEM containing 10 µCi/mL calcium-45 (45Calcium) as a radiotracer, with either 1 mmol/L or 2 mmol/L phosphate, in the absence or presence of 100 µmol/L pyrophosphate (+ PPi). After 4 days of incubation with daily media replacement, the calcium-45 (45Calcium) content was measured as described in the Materials and Methods section. A Non-diabetic hASMCs. B Fixed non-diabetic hASMCs. C Diabetic hASMCs. D Fixed diabetic hASMCs. The cells incubated with 1 mmol/L phosphate served as the control. E Calcification inhibitory capacity was calculated as the difference in calcium deposition between living and fixed cells (ΔCa2+). The results are shown as the mean ± SEM (four independent experiments, each with three wells per experiment). Statistical analysis was performed via one-way ANOVA with Tukey’s post hoc test (A-D) and Student’s t test (E). Asterisks indicate significant differences, with *P < 0.05 and ***P < 0.001

References

    1. Cloete L. Diabetes mellitus: an overview of the types, symptoms, complications and management. Nurs Stand R Coll Nurs G B 1987. 2022;37(1):61–6. - PubMed
    1. Bielka W, Przezak A, Molęda P, Pius-Sadowska E, Machaliński B. Double diabetes-when type 1 diabetes meets type 2 diabetes: definition, pathogenesis and recognition. Cardiovasc Diabetol. 2024;23(1):62. - PMC - PubMed
    1. Cole JB, Florez JC. Genetics of diabetes mellitus and diabetes complications. Nat Rev Nephrol j. 2020;16(7):377–90. - PMC - PubMed
    1. Strain WD, Paldánius PM. Diabetes, cardiovascular disease and the microcirculation. Cardiovasc Diabetol. 2018;17(1):57. - PMC - PubMed
    1. Wong ND, Sattar N. Cardiovascular risk in diabetes mellitus: epidemiology, assessment and prevention. Nat Rev Cardiol. 2023;20(10):685–95. - PubMed

Publication types

MeSH terms

LinkOut - more resources