

Comparative meta-analysis of transcriptomic studies in spinal muscular atrophy: comparison between tissues and mouse models
- PMID: 39529156
- PMCID: PMC11555813
- DOI: 10.1186/s12920-024-02040-0
Comparative meta-analysis of transcriptomic studies in spinal muscular atrophy: comparison between tissues and mouse models
Abstract
Background: Spinal Muscular Atrophy (SMA), a neuromuscular disorder that leads to weakness in the muscles due to degeneration of motor neurons. Mutations in the survival motor neuron 1 (SMN1) gene leads to the deficiency of SMN protein that causes SMA. The molecular alterations associated with SMA extends across the transcriptome and proteome. Although several studies have examined the transcriptomic profile of SMA, the difference in experimental settings across these studies highlight the need for a comparative meta-analysis to better understand these differences.
Methods and data: We conducted a systematic comparative meta-analysis of publicly available gene expression data from six selected studies to elucidate variations in the transcriptomic landscape across different experimental conditions, including tissue types and mouse models. We used both microarray and RNA-seq datasets, retrieved from Gene Expression Omnibus (GEO) and ArrayExpress (AE). Methods included normalization, differential expression analysis, gene-set enrichment analysis (GSEA), network reconstruction and co-expression analysis.
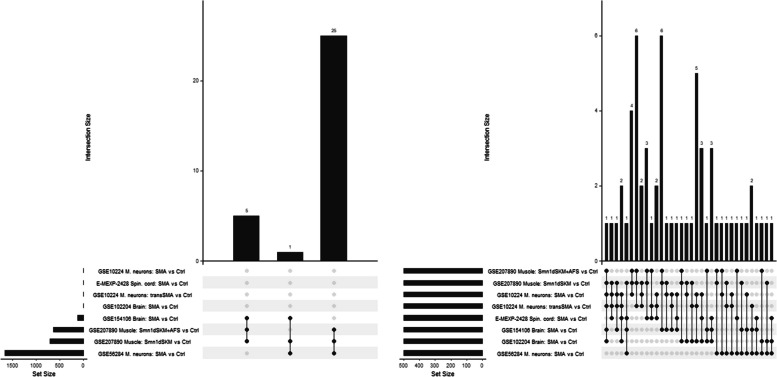
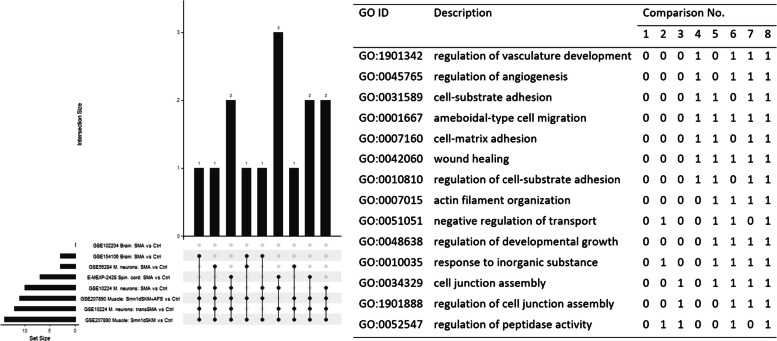
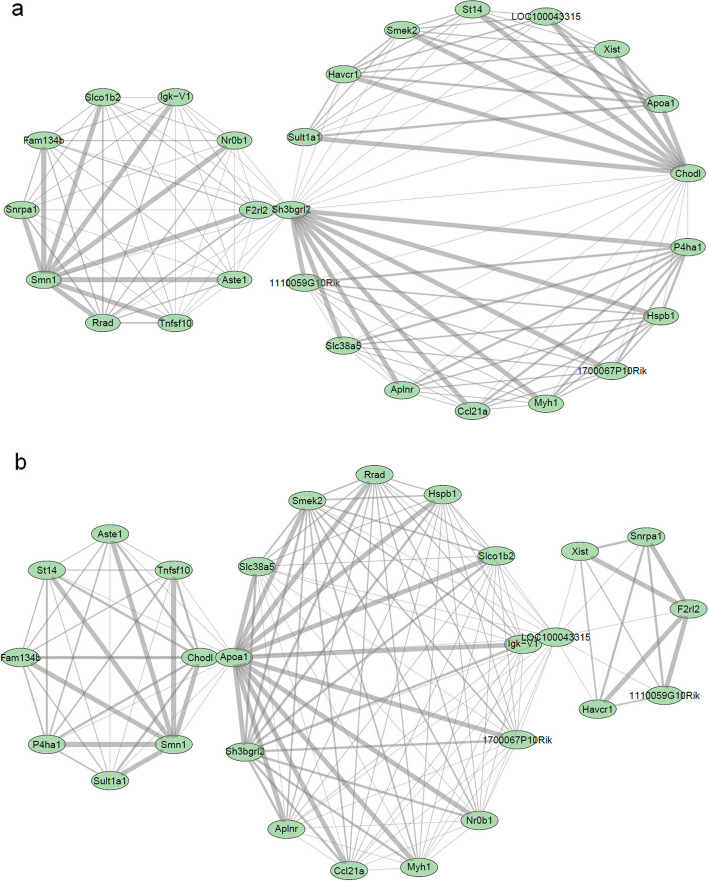
Results: Differential expression analysis revealed varying numbers of differentially expressed genes ranging between zero and 1,655 across the selected studies. Notably, the Metallothionein gene Mt2 was common in several of the eight comparisons. This highlights its role in oxidative stress and detoxification. Additionally, genes such as Hspb1, St14 and Sult1a1 were among the top ten differentially expressed genes in more than one comparison. The Snrpa1 gene, involved in pre-mRNA splicing, was upregulated in the spinal cord and has a strong correlation with other differentially expressed genes from other comparisons in our network reconstruction analysis. Gene-set enrichment analysis identified significant GO terms such as contractile fibers and myosin complexes in more than one comparison which highlights its significant role in SMA.
Conclusions: Our comparative meta-analysis identified only few genes and pathways that were consistently dysregulated in SMA across different tissues and experimental settings. Conversely, many genes and pathways appeared to play a tissue-specific role in SMA. In comparison with the original studies, reproducibility was rather weak.
Keywords: Differential expression analysis; Meta-analysis; Network reconstruction; Spinal muscular atrophy; Transcriptomics; WGCNA.
© 2024. The Author(s).
Conflict of interest statement
Figures
References
-
- Benjamini Y, Hochberg Y. Controlling the false discovery rate: a practical and powerful approach to multiple testing. J Roy Stat Soc: Ser B (Methodol). 1995;57(1):289–300.
-
- Bolstad BM, Irizarry RA, Åstrand M, Speed TP. A comparison of normalization methods for high density oligonucleotide array data based on variance and bias. Bioinformatics. 2003;19(2):185–93. - PubMed
Publication types
MeSH terms
LinkOut - more resources
Full Text Sources
Medical
Research Materials
Miscellaneous
