. 2024 Nov 12;43(1):299.
doi: 10.1186/s13046-024-03221-6.

Drug prioritization identifies panobinostat as a tailored treatment element for patients with metastatic hepatoblastoma

Affiliations

Drug prioritization identifies panobinostat as a tailored treatment element for patients with metastatic hepatoblastoma

Salih Demir et al. J Exp Clin Cancer Res. .

Abstract

Background: Patients with metastatic hepatoblastoma are treated with severely toxic first-line chemotherapies in combination with surgery. Yet, inadequate response of lung metastases to neo-adjuvant chemotherapy still compromises patient outcomes making new treatment strategies, tailored to more efficient lung clearance, mandatory.

Methods: We harnessed a comprehensive patient-derived xenograft platform and a variety of in vitro and in vivo assays to establish the preclinical and biological rationale for a new drug for patients with metastatic hepatoblastoma.

Results: The testing of a library of established drugs on patient-derived xenografts identified histone deacetylase inhibitors, most notably panobinostat, to be highly efficacious on hepatoblastoma cells, as compared to non-cancerous cells. Molecularly, the anti-tumor effect of panobinostat is mediated by posttranslational obstruction of the MYC oncoprotein as a result of dual specificity phosphatase 1 upregulation, thereby leading to growth inhibition and programmed cell death. Of clinical importance, upregulation of the MYC target gene nucleophosmin 1 is indicative of response to panobinostat and associated with metastatic disease in patients with hepatoblastoma. The combination of panobinostat with the current SIOPEL 4 induction protocol, consisting of cisplatin and doxorubicin, revealed high synergies already at low nanomolar levels. The simulation of a clinical trial, with this combination therapy, in patient-derived xenograft models, and ultimately heterotypic lung metastasis mimics clearly underscored the potency of this approach.

Conclusion: Integrated studies define MYC inhibition by panobinostat as a novel treatment element to be introduced into the therapeutic strategy for patients with metastatic hepatoblastoma.

Keywords: Hepatoblastoma; MYC; Metastasis; Panobinostat; Therapy.


Conflict of interest statement

Declarations Ethics approval and consent to participate In vivo testing in mice was carried out according to the Italian Decree (08/2023-UT). Consent for publication Not applicable. Competing interests The authors declare that they have no competing interests.

Figures

Fig. 1
Fig. 1
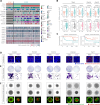
Drug prioritization strategy using a pediatric liver cancer testing platform. A Schematic workflow representing the establishment of hepatoblastoma patient-derived xenograft (PDX) models. B Mutational status and C RNA expression levels of marker genes in the tumor cells lines of the platform. Dashed lines represent the mean expression level of normal liver tissue. D Heatmap displaying the response towards drug candidates tested on the platform, as evidenced by area under the curve (AUC) values from sensitive (purple) to resistant (orange). Corresponding Z-scores of each drug candidate are shown depicting the overall efficacy of the tested drugs on all cell lines, with boxes and whiskers representing the 25th to 75th percentiles and smallest to largest values, respectively. HDAC inhibitors (HDACi) and microtubule-targeting agents (MTA) are highlighted in purple and orange, respectively. E Response curves displaying the cell viability upon 10 increasing concentrations of panobinostat, ranging from 5 nM to 100 µM. Each curve represents an individual cell line, with tumor models in grey and healthy controls in orange. Mean response of all tumor models is shown in purple, and each dot represents the mean value of two independent experiments with duplicate measurements. F Lollipop plot showing the therapeutic window score of HDACi (purple) and MTA (orange) compounds. G Half-maximal inhibitory concentrations (IC50) of cisplatin (CIS), doxorubicin (DOX) and panobinostat (PANO) in tumor models and non-cancerous controls. PHITT, Pediatric Hepatic International Tumor Trial; SIOPEL, Childhood Liver Tumors Strategy Group; CTNNB1, beta catenin; AXIN1, Axin 1; TERT, telomerase reverse transcriptase; TP53, tumor protein p53; NFE2L2, nuclear factor erythroid 2-related factor 2; NRAS, neuroblastoma Ras viral oncogene homolog; GPC3, glypican 3; AFP, alpha fetoprotein; MKI67, marker of proliferation Ki-67; AXIN2, Axin 2; IGF2, insulin like growth factor 2
Fig. 2
Fig. 2
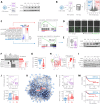
Histone deacetylase expression in hepatoblastoma patients and panobinostat effects in vitro. A Color-coded clinical (upper panel) and transcriptional (lower panel) characterization of patients with hepatoblastoma (HB) with corresponding normal liver tissue (N) enrolled in the JPLT-2 trial (data were retrieved from the GSE131329 data set). Relative RNA expression levels of histone deacetylases (HDACs) were calculated by normalizing the fragments per kilobase of transcript per million mapped reads of candidate genes with the housekeeping gene TATA-box binding protein. B Comparison of HDAC expression levels between normal liver (N) and hepatoblastoma (HB) samples as well as between different clinical characteristics. Individual values and the mean of the group are given as short and long lines, respectively. The student’s t test was applied to calculate significances between the groups. C Kaplan–Meier curves displaying overall and event free survival probabilities of 53 HB patients of the JPLT-2 trial with low (n = 21) and high (n = 32) HDAC4 expression. Wilcoxon test was used to calculate significance. D Short-term growth of proliferating tumor cells upon vehicle (DMSO) or 1 nM panobinostat (PANO) for 24h, as detected by ethynyl deoxyuridine staining (red) on Hoechst 33,342-counterstained nuclei (blue). E Long-term growth of hepatoblastoma cells exposed to DMSO or 1 nM PANO for 7 days, as monitored by colony formation assay. Representative crystal violet-stained wells (upper panel) and magnified views of single colonies (lower panel) are demonstrated. F Three-dimensional growth of established HB tumor spheroids after exposure to DMSO or 1 nM PANO for 4 days, given as microscopic brightfield images (two upper panels). The bottom panel depicts spheroids after live/dead staining with calcein-AM (green) and propidium iodide (red), respectively. 16-gene, subtype according to the 16-gene signature; CTNNB1, beta catenin; CHIC, risk group according to the Children's Hepatic Tumors International Collaboration; PRETEXT, pre-treatment extent of tumor; n/a, not applicable
Fig. 3
Fig. 3
Molecular consequences of panobinostat treatment. A Western blot analysis of five hepatoblastoma models showing acetylated histone 3 (AcH3) protein levels after exposure to vehicle (DMSO) or 1 nM panobinostat (PANO) for 16h. Lamin B1 (LMNB1) served as nuclear loading control. B Volcano plot of expressed genes after RNA sequencing demonstrating significantly up- (red) and down-regulated (blue) genes in five hepatoblastoma models following 16h incubation with DMSO or 1 nM PANO. Dashed lines represent log2 fold increase and p < 0.05 significance thresholds. C Gene set enrichment analysis of RNA sequencing data showing positively (red) and negatively (blue) enriched HALLMARK gene sets (left panel), given as normalized enrichment scores (NES) and number of genes involved in the respective gene sets (size). The two top ranked HALLMARK gene sets are shown as individual enrichment plots (right panel). D Apoptotic cells detected by fluorescent staining of active caspase 3 and 7 substrates (green). Fluorescent images of tumor lines were captured after 24h incubation with DMSO or 1 nM PANO. E MYC expression in tumor cells treated with DMSO or 1 nM PANO on the RNA (left panel) and protein level (right), as evidenced by RNA sequencing and Western blot, respectively. F Enrichr-generated clustergram of significantly upregulated genes upon PANO exposure given as protein–protein-interaction Hub enrichment scores (PPI Hub ES) for enriched molecular categories and color-coded logarithmic p values. G RNA levels of DUSP1 in 53 patients with hepatoblastoma (HB) and corresponding normal liver tissue (N) of the JPLT-2 trial. The student’s t test was applied to calculate significance. H Subnetwork module map of significantly upregulated genes upon PANO exposure showing enriched kinases after kinase enrichment analysis utilizing the post-translational molecular signature database (PTMsigDB) and weighted gene co-expression network analysis (WGCNA) (left panel). The bubble plot shows top scoring kinases (right panel), with the size of bubbles representing the number of involved genes and the color scale indicating significance. I Western blot analysis demonstrating the expression levels of DUSP1, ERK 1/2, and phospho-ERK 1/2 (Thr202/Tyr204) proteins in hepatoblastoma models treated with DMSO or 1 nM PANO for 16h. Alpha tubulin (TUBA) was used as loading control. J + L Correlation between response of hepatoblastoma models towards PANO, given as area under the curve (AUC) and RNA sequencing-derived MYC and NPM1 expression, with R2 correlation coefficients and p values calculated by two-tailed Pearson test and linear regressions given as dashed lines (upper panels). Violin plot demonstrating the RNA levels of MYC and NPM1 in patients with hepatoblastoma (HB) and corresponding normal liver tissue (N) of the JPLT-2 trial, stratified into groups of 14 normal liver samples (N), 39 non-metastatic (M-) and 14 metastatic patients (M +). Significance was calculated by Student’s t test (lower panel). K STRING protein–protein interaction network of the significantly downregulated genes of the HALLMARK_MYC_TARGETS_V1 gene set (111 out of 200 genes) upon PANO treatment, highlighting connections and neighborhood of the involved proteins. The nodes represent proteins, the edges indicate both functional and physical protein associations, and the line thickness indicates the strength of data support. M Kaplan–Meier curves displaying event-free survival (EFS) and overall survival (OS) probabilities for patients with hepatoblastoma of the JPLT-2 trial with either high (n = 28) or low (n = 26) NPM1 expression. The log-rank Mantel-Cox test was used to calculate significance
Fig. 4
Fig. 4
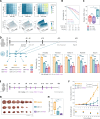
Susceptibility of MYC-activated tumor cells to panobinostat treatment. A Kaplan–Meier survival curves of CreAlbMyc and CreAlbKras mice (left), and representative liver images demonstrating the lesions (right). Representative cryosections from CreAlbMyc and CreAlbKras cohorts stained with hematoxylin and eosin (H&E) (top), fluorescently stained for the hepatoblastoma markers glypican 3 (GPC3; red) and epithelial cell adhesion molecule (EPCAM; green) (middle), and the MYC proto-oncogene (MYC, magenta) (bottom). Schematic overview of generating mouse tumor cell lines from dissected tumors (left) and microscopic images of the established models (right). Cell viability curves and IC50 values demonstrating the response of the CreAlbMyc (purple) and CreAlbKras (orange) mouse tumor cell lines towards increasing concentrations of cisplatin, doxorubicin, and panobinostat. Western blot analysis highlighting the expression level of MYC protein in CreAlbMyc and CreAlbKras mouse models treated with DMSO or 1 nM PANO for 16h. Glycerinaldehyd-3-phosphat-dehydrogenase (GAPDH) was used as loading control
Fig. 5
Fig. 5
Panobinostat treatment of lung metastasis mimics. A Immunofluorescence images of individual spheroids of lung epithelial cells (BEAS-2B), neonatal skin fibroblasts (HDFn) and hepatoblastoma models stained for the airway epithelial cell marker surfactant C (SP-C), the mesenchymal marker vimentin (VIM) and the hepatoblastoma marker alpha fetoprotein (AFP), respectively. BEAS-2B, HDFn and HB cells were labeled with the tracking dyes Vybrant DiO, Dil and DiD, respectively. Basic lung metastasis spheroid model consisting of lung epithelial cells (green) and tumor cells (pink) treated with vehicle (DMSO) or 1 nM panobinostat (PANO). Normal lung spheroid model with lung epithelial cells (green) and fibroblasts (yellow). Heterotypic lung metastasis spheroid model comprised of lung epithelial cells (green), fibroblasts (yellow), and tumor cells (pink) after DMSO or 1 nM PANO treatment. Infiltrative lung metastasis spheroid model generated from individual spheroids of lung epithelial cells (green), fibroblasts (yellow), and tumor cells (pink) upon exposure to DMSO or 1 nM PANO. Time of spheroid formation and treatment as well as scale bars are indicated
Fig. 6
Fig. 6
Simulation of a clinical trial in vitro and in vivo. Representative cell viability-matrix (top) and 3-dimensional synergy landscapes (bottom) for pairwise-drug combination of cisplatin (CIS), doxorubicin (DOX) and panobinostat (PANO) with four increasing concentrations demonstrated in PDX214 cells. Summarized cell viability curves of five hepatoblastoma models with sensitivity towards two-drug combination of CIS, DOX and PANO for indicated concentrations. Lines represent the mean of two independent experiments with duplicate measurements, each dot represents an individual tumor model. Summarized maximum synergy scores of five hepatoblastoma models corresponding to given cell viability curves upon two-drug combination of CIS, DOX and PANO. The dots represent individual tumor cell lines, whiskers show min-to-max values and horizontal lines indicate the median. Schematic overview of one cycle of the SIOPEL 4 induction regimen and its adaptation to the in vitro setting. Bar graphs show the cell viability for determined drug combinations, with the mean ± SD of two independent experiments in triplicates. Statistics were calculated using a two-tailed unpaired Student’s t test, with ns = not significant, *p < 0.05, **p < 0.01, ***p < 0.001, ****p < 0.0001. E Dosing protocol of the in vivo drug testing in the PDX303 xenograft mouse model. Tumor growth (upper panel) and body weight changes (lower panel) in mice treated with either CIS + DOX, CIS + DOX and PANO, or vehicle. Values correspond to mean tumor volumes and mean body weights ± SEM, and differences to vehicle were calculated using two-way Anova. Pictures and weights of dissected tumors at day 22

Similar articles

Cited by

References

    1. Weinberg AG, Finegold MJ. Primary hepatic tumors of childhood. Hum Pathol. 1983;14(6):512–37. - PubMed
    1. Perilongo G, Maibach R, Shafford E, Brugieres L, Brock P, Morland B, et al. Cisplatin versus cisplatin plus doxorubicin for standard-risk hepatoblastoma. N Engl J Med. 2009;361(17):1662–70. - PubMed
    1. Zsiros J, Brugieres L, Brock P, Roebuck D, Maibach R, Zimmermann A, et al. Dose-dense cisplatin-based chemotherapy and surgery for children with high-risk hepatoblastoma (SIOPEL-4): a prospective, single-arm, feasibility study. Lancet Oncol. 2013;14(9):834–42. - PMC - PubMed
    1. Zsiros J, Maibach R, Shafford E, Brugieres L, Brock P, Czauderna P, et al. Successful treatment of childhood high-risk hepatoblastoma with dose-intensive multiagent chemotherapy and surgery: final results of the SIOPEL-3HR study. J Clin Oncol. 2010;28(15):2584–90. - PubMed
    1. van Kalsbeek RJ, Hudson MM, Mulder RL, Ehrhardt M, Green DM, Mulrooney DA, et al. A joint international consensus statement for measuring quality of survival for patients with childhood cancer. Nat Med. 2023;29(6):1340–8. - PubMed

MeSH terms

LinkOut - more resources