GABA and glutamate measurements in temporal cortex of autistic children
- PMID: 39529294
- PMCID: PMC11638920
- DOI: 10.1002/aur.3253
GABA and glutamate measurements in temporal cortex of autistic children
Abstract
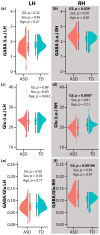
Autism spectrum disorder (ASD) is a neurodevelopmental disorder and presents with challenges in social communication. A hypothesized underlying contributing mechanism is the imbalance in excitation and inhibition (E/I), partly influenced by the levels of excitatory neurotransmitter glutamate (Glu) and inhibitory neurotransmitter γ-aminobutyric acid (GABA) in the brain. Although many have reported the levels of GABA and Glu in the brain, only a few reports address the temporal cortex and then only with a small sample of autistic children, and often only in one hemisphere. We used a macromolecular suppressed edited-magnetic resonance spectroscopy (MRS) sequence to study GABA and Glu (as potential key players influencing E/I) in a large sample of children with ASD in the right and left temporal cortices of children with (N = 56) and without (N = 30) ASD (7-18 years). As a group, children with ASD exhibited no differences in the left hemisphere (GABA and Glu Cohen's |d|: 0.24 and 0.03), but the right hemisphere showed higher GABA and lower Glu concentrations (GABA and Glu Cohen's |d|: 0.53 and 0.65) compared to neurotypicals. Furthermore, a negative association was found between the right hemisphere Glu levels of the ASD group and a clinical assessment tool (r = -0.361, p = 0.022), reflecting autism trait severity (social responsiveness scale). In conclusion, we highlight the chemical abnormalities in children with ASD through a cross-sectional measurement. Longitudinal studies are warranted to determine whether these chemical levels persist or resolve over development.
Keywords: GABA; MEGA‐PRESS; MM‐suppressed; autism; glutamate.
© 2024 The Author(s). Autism Research published by International Society for Autism Research and Wiley Periodicals LLC.
Figures


References
-
- Andreychenko, A. , Boer, V. O. , Arteaga de Castro, C. S. , Luijten, P. R. , & Klomp, D. W. (2012). Efficient spectral editing at 7 T: GABA detection with MEGA‐sLASER. Magnetic Resonance in Medicine, 68(4), 1018–1025. - PubMed
-
- Barkhuijsen, H. , De Beer, R. , & Van Ormondt, D. (1969). Improved algorithm for noniterative time‐domain model fitting to exponentially damped magnetic resonance signals. Journal of Magnetic Resonance, 73(3), 553–557.
-
- Berman, J. I. , Bloy, L. , Blaskey, L. , Jackel, C. R. , Miller, J. S. , Ross, J. , Edgar, J. C. , & Roberts, T. P. L. (2023). Contributions to auditory system conduction velocity: Insights with multi‐modal neuroimaging and machine learning in children with ASD and XYY syndrome. Frontiers in Psychiatry, 14, 1057221. - PMC - PubMed
-
- Bhattacharyya, P. , Lowe, M. , & Phillips, M. (2007). Spectral quality control in motion‐corrupted single‐voxel J‐difference editing scans: An interleaved navigator approach. Magnetic Resonance in Medicine: An Official Journal of the International Society for Magnetic Resonance in Medicine, 58(4), 808–812. - PubMed
Publication types
MeSH terms
Substances
Grants and funding
LinkOut - more resources
Full Text Sources
Medical
Research Materials

