. 2024 Oct 21;5(6):100721.
doi: 10.1016/j.xinn.2024.100721. eCollection 2024 Nov 4.

Brainstem opioid peptidergic neurons regulate cough reflexes in mice

Affiliations

Brainstem opioid peptidergic neurons regulate cough reflexes in mice

Haicheng Lu et al. Innovation (Camb). .

Abstract

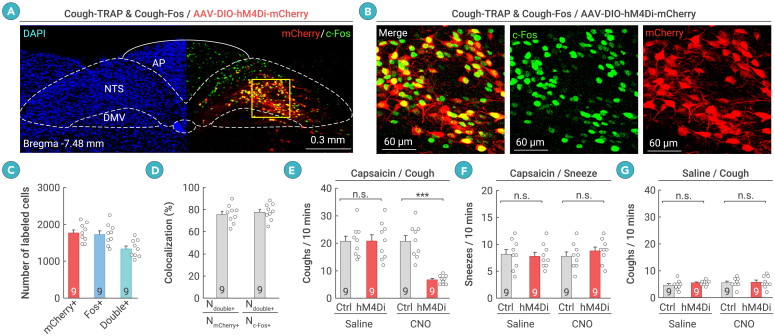
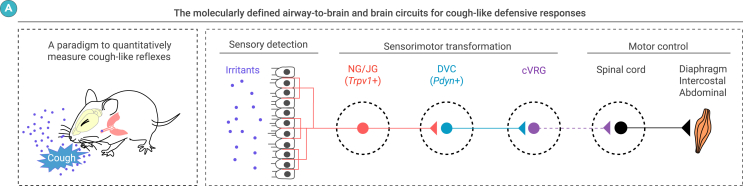
Cough is a vital defensive reflex for expelling harmful substances from the airway. The sensory afferents for the cough reflex have been intensively studied. However, the brain mechanisms underlying the cough reflex remain poorly understood. Here, we developed a paradigm to quantitatively measure cough-like reflexes in mice. Using this paradigm, we found that prodynorphin-expressing (Pdyn+) neurons in the nucleus of the solitary tract (NTS) are critical for capsaicin-induced cough-like reflexes. These neurons receive cough-related neural signals from Trpv1+ vagal sensory neurons. The activation of Pdyn+ NTS neurons triggered respiratory responses resembling cough-like reflexes. Among the divergent projections of Pdyn+ NTS neurons, a glutamatergic pathway projecting to the caudal ventral respiratory group (cVRG), the canonical cough center, was necessary and sufficient for capsaicin-induced cough-like reflexes. These results reveal that Pdyn+ NTS neurons, as a key neuronal population at the entry point of the vagus nerve to the brainstem, initiate cough-like reflexes in mice.


Conflict of interest statement

The authors declare no competing interests.

Figures

None
Graphical abstract
Figure 1
Figure 1
Paradigm for measuring capsaicin-induced cough-like reflexes (A) Schematic showing three-channel recording system for measuring capsaicin-induced airway defensive reflexes. (B) Example traces of IPP (top), box flow (middle), and sound waveform (bottom) simultaneously recorded during capsaicin-induced airway defensive reflexes. (C) Example waveforms (top) and sonograms (bottom) of class I and II reflexes. (D) Distribution of sonogram durations and peak frequencies of capsaicin-induced airway defensive reflexes in WT mice (151 reflexes from five mice), showing distinct distribution of class I and II reflexes. (E) Quantification of sonogram durations (left) and peak frequencies (right) of class I and II reflexes. (F, H, and J) Schematics showing strategy for chemogenetic inactivation of Trpv1+ sensory neurons in NG/JG (F), TG (H), or both ganglia (J). (G, I, and K) Quantification of effects of chemogenetic inactivation of Trpv1+ sensory neurons in NG/JG (G), TG (I), or both ganglia (K) on the number of capsaicin-induced class I (left) or class II (right) reflexes. (L and O) Schematic showing application of capsaicin solution containing Evans blue dye (20 μL) into the trachea (L) or nostril (O). (M and P) Example images showing expulsion of blue droplets on the floor following capsaicin solution delivery in the trachea (M) or nostril (P). (N and Q) Distribution of sonogram durations and peak frequencies of respiratory reflexes with capsaicin solution delivered in the trachea (N) or nostril (Q). (R and S) Quantitative analyses showing percentages of class I (R) or class II responses (S) with capsaicin solution delivered in the trachea or nostril. Numbers of mice (D, E, G, I, K, R, and S) are indicated in the graphs. Data in (E), (G), (I), (K), (R), and (S) are means ± standard error of the mean (SEM). Statistical analyses (E, G, I, K, R, and S) were performed using Student’s t test (∗∗∗p < 0.001 and n.s. p > 0.1). For p values, see Table S4.
Figure 2
Figure 2
Neurons in the DVC are required for capsaicin-induced cough-like reflexes (A and B) Example coronal brain section (A) and magnified fields (B) showing hM4Di-mCherry and Fos induced by capsaicin-TRAP and capsaicin-Fos, respectively. (C) Number of DVC cells labeled with hM4Di-mCherry (mCherry+), Fos (Fos+), or both (double+). (D) Specificity (Ndouble+/NmCherry+) and efficiency (Ndouble+/NFos+) of hM4Di-mCherry in labeling capsaicin-TRAPed DVC neurons. (E and F) Quantification of effects of chemogenetic inactivation of capsaicin-TRAPed DVC neurons on number of capsaicin-induced cough-like (E) and sneeze-like (F) reflexes. (G) Quantification of effects of chemogenetic inactivation of capsaicin-TRAPed DVC neurons on baseline levels of cough-like reflexes to aerosolized saline. Scale bars are labeled in graphs. Numbers of mice (C–G) are indicated in the graphs. Data in (C)–(G) are means ± SEM. Statistical analyses (E–G) were performed using Student’s t test (∗∗∗p < 0.001 and n.s. p > 0.1). For p values, see Table S4.
Figure 3
Figure 3
Pdyn+ NTS neurons are essential for capsaicin-induced cough-like reflexes (A) Example coronal brain section showing Pdyn mRNA in DVC of WT mouse. (B and C) Quantification of distribution of Pdyn-expressing (Pdyn+) cells within DVC (B) and NTS (C). (D) Example micrograph showing capsaicin-induced Fos colocalized with Pdyn+ cells in DVC. (E) Example coronal brain section showing hM4Di-mCherry expression in DVC of Pdyn-IRES-Cre mice. (F and G) Example micrographs (F) and quantification (G) showing specificity and efficiency of Pdyn-IRES-Cre mice in labeling Pdyn+ NTS cells. (H and I) Example trace of action potential firing (H) and quantification of firing rate (I) showing effectiveness of CNO to chemogenetically silence hM4Di-expressing DVC neurons in acute brain slices. CNO was dissolved in ACSF (10 μM) and perfused in brain slices. (J, L, and N) Quantification of capsaicin-induced cough-like reflexes within 10 min in mice treated with saline or CNO (1 mg/kg) to chemogenetically inactivate DVC neurons expressing Pdyn (J), Penk (L), and Pomc mRNA (N). (K, M, and O) Quantification of citric-acid-induced cough-like reflexes within 10 min in mice treated with saline or CNO (1 mg/kg) to chemogenetically inactivate DVC neurons expressing Pdyn (K), Penk (M), and Pomc mRNA (O). Scale bars are labeled in graphs. Numbers of mice (B, C, G, and J–O) and cells (I) are indicated in the graphs. Data in (B), (C), (G), and (I)–(O) are means ± SEM. Statistical analyses (I–O) were performed using Student’s t test (∗∗∗p < 0.001, ∗p < 0.05, and n.s. p > 0.1). For p values, see Table S4.
Figure 4
Figure 4
Pdyn+ NTS neurons receive cough-related signals from Trpv1+ vagal sensory neurons (A) Example coronal brain section from Pdyn-IRES-Cre mice showing AAV-helper-labeled cells (tdTomato+) and RV-labeled cells (EGFP+) in DVC. See Figure S4A for information on AAV helpers and RV. (B) Quantification of retrogradely labeled neurons in various brain areas. Example micrographs are provided in Figure S3D. (C) Example section showing RV-labeled cells (EGFP+) in NG/JG. (D and E) Example micrographs (D) and quantification (E) showing that most RV-labeled cells (EGFP+) in NG/JG were TRPV1+. (F) Example coronal brain section showing optical fiber track above GCaMP7-expressing neurons in DVC of Pdyn-IRES-Cre mice. (G and H) Example micrographs from NTS (G) and quantification (H) showing colocalization of GCaMP7 with Pdyn mRNA. (I) Schematic showing fiber photometry recording from Pdyn+ NTS neurons in mice exhibiting capsaicin-induced cough-like reflexes. Note: cough-like reflexes were monitored by simultaneous recording of IPP and cough sound. (J) Normalized GCaMP fluorescence changes (green, ΔF/F) in Pdyn+ NTS neurons in parallel with time course of IPP (blue) and sound waveform (red). (K) Heatmap showing 10 trials of normalized GCaMP fluorescence changes (ΔF/F) aligned with cough sound onset in example mouse. (L) Average GCaMP response curve aligned with cough sound onset in example mouse. (M and N) Average GCaMP response curve aligned with cough sound onset in example mouse with UCV (M) or deletion of Trpv1 (Trpv1−/−) (N). (O) Quantification of peak GCaMP responses in Pdyn+ NTS neurons during capsaicin-induced cough-like reflexes in control mice (Ctrl) and those with UCV or deletion of Trpv1 (Trpv1−/−). Scale bars are labeled in graphs. Numbers of mice (B, E, H, and O) are indicated in graphs. Data in (B), (E), (H), and (L)–(O) are means ± SEM. Statistical analyses (O) were performed using Student’s t test (∗∗∗p < 0.001). For p values, see Table S4.
Figure 5
Figure 5
Activation of Pdyn+ NTS neurons evokes cough-like reflexes (A) Example coronal brain section showing hM3Dq-mCherry+ cells in DVC of Pdyn-IRES-Cre mice. (B) Example micrographs showing hM3Dq-mCherry expressed specifically in Pdyn+ NTS neurons. For quantification, see Figure S4A. (C and D) Example trace of action potential firing (C) and quantification of firing rate (D) showing effectiveness of CNO to chemogenetically activate hM3Dq-expressing DVC neurons in acute brain slices. CNO was dissolved in ACSF (10 μM) and perfused in brain slices. (E) Quantification of cough-like reflexes evoked by chemogenetic activation of Pdyn+ NTS neurons. (F) Left, example IPP trace (top), cough sound trace (middle), and corresponding sonogram (bottom) in response to single pulse light stimulation of Pdyn+ NTS neurons. Cough-like reflexes are indicated by dashed frames. Right, temporally expanded IPP trace, cough sound trace, and sonogram during a light-evoked cough-like reflex (asterisk). (G and H) Probability for single light pulse to evoke cough-like reflex as a function of laser power (G) and duration (H). (I and J) Localization of ChR2-mCherry+ NTS neurons relative to Slc17a6 mRNA (I) and Slc32a1 mRNA (J). (K) Schematic showing recording of light-evoked postsynaptic currents from NTS neurons negative for ChR2-mCherry. (L and M) Example traces (L) and quantification (M) showing effects of picrotoxin (PTX; 50 μM) and APV (50 μM)/CNQX (20 μM) on amplitude of light-evoked postsynaptic currents. Scale bars are labeled in graphs. Numbers of mice (E, G, and H) or cells (D and M) are indicated in the graphs. Data in (D), (E), (G), (H), and (M) are means ± SEM. Statistical analyses (D, E, G, H, and M) were performed using Student’s t test (∗∗∗p < 0.001, ∗∗p < 0.01, and n.s. p > 0.1). For p values, see Table S4.
Figure 6
Figure 6
Pdyn+ NTS-cVRG pathway is critical for capsaicin-evoked cough-like reflexes (A) Schematic illustrating AAV injection for labeling Pdyn+ NTS neurons and their projections with EGFP-Syb2. (B) Example coronal brain section of Pdyn-IRES-Cre mice showing EGFP-Syb2+ neurons in DVC. (C and D) Example coronal brain section of Pdyn-IRES-Cre mice showing EGFP-Syb2+ axonal terminals in the cVRG (C) and IRt (D). (E) Schematic showing bilateral chemogenetic suppression of Pdyn+ NTS-IRt pathway. See Figure S6 for example brain section containing cannula track. (F) Quantification of capsaicin-induced cough-like reflexes in mice without (saline) and with (CNO) bilateral chemogenetic inactivation of Pdyn+ NTS-IRt pathway. (G) Schematic showing bilateral chemogenetic suppression of Pdyn+ NTS-cVRG pathway. See Figure S6 for example brain section containing cannula track. (H) Quantification of capsaicin-induced cough-like reflexes in mice without (saline) and with (CNO) bilateral chemogenetic inactivation of Pdyn+ NTS-cVRG pathway. (I) Comparison of cough change ratios after selective inactivation of projections of Pdyn+ NTS neurons to IRt and cVRG. (J) Schematic showing optogenetic activation of axon terminals of Pdyn+ NTS neurons in cVRG. (K) Example traces of IPP and cough sound, showing cough-like reflexes evoked by optogenetic activation of the Pdyn+ NTS-cVRG pathway. (L) Quantification showing that the probability of evoking cough-like reflexes by photostimulation of Pdyn+ NTS-cVRG pathway depends on laser power (left) and duration (right) of light pulses. (M) Schematic showing photostimulation of cVRG neurons in WT mice. (N) Example traces of IPP and cough sound, showing cough-like reflexes evoked by single-pulse photostimulation of cVRG neurons. (O) Quantification showing that the probability of evoking cough-like reflexes by photostimulation of cVRG neurons depends on laser power (left) and duration (right) of light pulses. (P) Schematic showing AAV-mediated labeling of Pdyn+ NTS neurons and PRV-mediated labeling of neurons in the cVRG transsynaptically connected to three groups of respiration-related muscles. See Figure S6 for PRV injection strategy. (Q) Example coronal section of cVRG showing axon terminals of Pdyn+ NTS neurons (EGFP-Syb2+) and PRV-labeled neurons (PRV-DsRed+) transsynaptically connected to abdominal muscles. For results related to diaphragm and intercostal muscles, see Figure S6. Scale bars are labeled in graphs. Numbers of mice (F, H, I, L, and O) are indicated in the graphs. Data in (F), (H), (I), (L), and (O) are means ± SEM. Statistical analyses (F, H, I, L, and O) were performed using Student’s t test (∗∗∗p < 0.001, ∗∗p < 0.01, and ∗p < 0.05). For p values, see Table S4.
Figure 7
Figure 7
Summary of the study (A) Summary graphs. Left, paradigm to quantitatively measure cough-like reflexes in mice. Right, molecularly defined airway-to-brain and brain circuits mediating cough-like reflexes in mice.

References

    1. Fontana G.A. Before we get started: what is a cough? Lung. 2008;186(Suppl 1):S3–S6. doi: 10.1007/s00408-007-9036-8. - DOI - PubMed
    1. Sykes D.L., Morice A.H. The Cough Reflex: The Janus of Respiratory Medicine. Front. Physiol. 2021;12 doi: 10.3389/fphys.2021.684080. - DOI - PMC - PubMed
    1. Lee K.K., Davenport P.W., Smith J.A., et al. Global Physiology and Pathophysiology of Cough: Part 1: Cough Phenomenology - CHEST Guideline and Expert Panel Report. Chest. 2021;159(1):282–293. doi: 10.1016/j.chest.2020.08.2086. - DOI - PMC - PubMed
    1. Morice A.H., Millqvist E., Bieksiene K., et al. ERS guidelines on the diagnosis and treatment of chronic cough in adults and children. Eur. Respir. J. 2020;55(1) doi: 10.1183/13993003.01136-2019. - DOI - PMC - PubMed
    1. Chung K.F., McGarvey L., Song W.J., et al. Cough hypersensitivity and chronic cough. Nat. Rev. Dis. Prim. 2022;8(1):45. doi: 10.1038/s41572-022-00370-w. - DOI - PMC - PubMed

LinkOut - more resources