. 2024 Oct 28:15:1405013.
doi: 10.3389/fimmu.2024.1405013. eCollection 2024.

BCR, not TCR, repertoire diversity is associated with favorable COVID-19 prognosis

Affiliations

BCR, not TCR, repertoire diversity is associated with favorable COVID-19 prognosis

Faith Jessica Paran et al. Front Immunol. .

Abstract

Introduction: The SARS-CoV-2 pandemic has had a widespread and severe impact on society, yet there have also been instances of remarkable recovery, even in critically ill patients.

Materials and methods: In this study, we used single-cell RNA sequencing to analyze the immune responses in recovered and deceased COVID-19 patients during moderate and critical stages.

Results: Expanded T cell receptor (TCR) clones were predominantly SARS-CoV-2-specific, but represented only a small fraction of the total repertoire in all patients. In contrast, while deceased patients exhibited monoclonal B cell receptor (BCR) expansions without COVID-19 specificity, survivors demonstrated diverse and specific BCR clones. These findings suggest that neither TCR diversity nor BCR monoclonal expansions are sufficient for viral clearance and subsequent recovery. Differential gene expression analysis revealed that protein biosynthetic processes were enriched in survivors, but that potentially damaging mitochondrial ATP metabolism was activated in the deceased.

Conclusion: This study underscores that BCR repertoire diversity, but not TCR diversity, correlates with favorable outcomes in COVID-19.

Keywords: COVID - 19; gene expression; immune repertoire analysis; immunology & infectious diseases; single cell RNA and transcriptome sequencing.


Conflict of interest statement

The authors declare that the research was conducted in the absence of any commercial or financial relationships that could be construed as a potential conflict of interest.

Figures
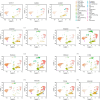
Figure 1
Figure 1
UMAP projections of cell populations in the healthy and COVID-19 samples. Azimuth annotation of clustered peripheral mononuclear blood cells (PBMCs) shown through UMAP projection shows the general trend of cell proportions with relation to disease severity. CD4 CTL, CD4-positive cytotoxic T lymphocytes; CD4/CD8 TEM, CD4-/CD8-positive effector memory T cell; CD4/CD8 TCM, CD4-/CD8-positive central memory T cell; Treg, regulatory T cell; MAIT, Mucosal associated invariant T cell; NK, natural killer cell; Eryth, erythroid cell; HSPC, hematopoietic precursor cell; ASDC, AXL+ dendritic cell; ILC, innate lymphoid cell; cDC1, CD141-positive myeloid dendritic cell; cDC2, CD1c-positive myeloid dendritic cell; pDC, plasmacytoid dendritic cell.
Figure 2
Figure 2
UMAP projections and bar graphs for T cell clusters and proportions. Eleven clusters were generated for T cells. Bar plot shows cell compositions at moderate and critical stages, with CD4 TCM and CD8 TEM occupying most of the T cells for healthy subjects and COVID-19 patients. Healthy subjects had a high proportion of CD8 naïve cells. CD4 CTL, CD4-positive cytotoxic T lymphocytes; CD4/CD8 TEM, CD4-/CD8-positive effector memory T cell; CD4/CD8 TCM, CD4-/CD8-positive central memory T cell; Treg, regulatory T cell; MAIT, Mucosal associated invariant T cell.
Figure 3
Figure 3
Differential gene expression analysis in CD4 TCM cells. (A) Normalized expression values of differential genes during the moderate and critical states for each patient are visualized in the heatmap. Inflammatory genes were upregulated in the moderate state of progressing patients (D 1-3 and R 1). Horizontal divisions represent the genes expressed and overlapped in the TRBV subsets. (B) Gene overlap among TRBV subsets upregulated and downregulated (in parentheses) during the moderate state, in comparison to the patient’s critical state. Genes in the non-intersection areas were defined as the specific gene sets for each TRBV subsets.
Figure 4
Figure 4
Pathway enrichment analysis in CD4 TCM cells. (A) Gene set enrichment analysis was performed between the moderate vs critical state of each patient. Plot summarized all Hallmark pathways activated and suppressed during the moderate states of progressing and recovering patients, divided by pathway category. Panels represent TRBV subsets. Red dots indicate progressing patients (D 1-3), and blue dots indicate recovering patients (R 1-3). (B) Gene ontology enrichment analysis was performed in go:Profiler using differentially expressed genes identified during the critical stage of deceased vs surviving patients. Nodes represent pathways; node colors represent patients; node sizes are proportional to number of genes associated with each pathway; edges represent connections between pathways. The clusters, calculated using MCL algorithm, represent similarities among the pathways.
Figure 5
Figure 5
UMAP projections and bar graphs for B cell clusters and proportions. Four clusters were generated for B cells. Bar plot shows cell compositions at moderate and critical stages, with plasmablasts making up the majority B cells in deceased patients, D 2 and 3. In surviving patients, a larger proportion of naïve B cells is observed.
Figure 6
Figure 6
Differential gene expression analysis in B cells. Normalized expression values of differential genes during the moderate and critical states for each patient are visualized in the heatmaps. Patients who progressed in severity (D 1-3 and R 1) show upregulated inflammatory genes in their moderate, compared to the critical samples, where ribosomal protein genes were prominent. During the moderate state of recovering patients, R 2 and 3, metabolic and biosynthetic genes were upregulated. In critical samples, ribosomal proteins were upregulated.
Figure 7
Figure 7
Shared enriched pathways in the moderate stages in B cells. Plot summarizes all Hallmark pathways activated and suppressed during the moderate states of progressing and recovering patients. Red dots indicate progressing patients (D 1-3), and blue dots indicate recovering patients (R 1-3). All patients had enriched immune pathways in this stage, with progressing patients having higher enrichment scores for the IFN-α and IFN-γ pathways. All patients had downregulated proliferation pathways.
Figure 8
Figure 8
Detailed Verification of BCRs in COVID-19 Patients. (A) Somatic hypermutation and clonal expansion in critical samples. Individual clonotypes are depicted as bubbles with the size indicating the count of each clonotype and their position corresponding to HV gene usage and somatic hypermutation (SHM) rate. Larger bubbles denote higher clonotype counts. Clonal expansions are marked in the deceased patient groups (D 1-3) with counts exceeding 15. The recovered patient groups (R 1-3) show counts not exceeding 14. Arrows indicate the expanded clonotypes used for subsequent antibody binding assays. (B) Recombinant antibody binding to SARS-CoV-2 using expanded clones from COVID-19 patients. Variable region sequences from expanded clonotypes were expressed with the human IgG1 or kappa constant regions. The binding of these recombinant antibodies to immobilized SARS-CoV-2 infected call lysates was assessed using ELISA format. (C) Average coefficient of variation for somatic hypermutation (SHM) ratio in BCR from COVID-19 patients in the critical stage across different IGHV genes. Clone sequences were analyzed for SHM using IMGT/HighV-Quest. Statistical significance (determined by the Mann-Whitney U-test) between the groups for each HV-gene is indicated by the following markers: ***p < 0.001, **p < 0.05, *p < 0.1. (D) Database hit ratios of CDR sequences between deceased and recovered patient groups. CDR1, CDR2, and CDR3 amino acid sequences from patient-derived clones were compared to a sequence database from prior COVID-19 studies and healthy individuals. Ratios are calculated as the number of database hits per total clonotypes in each patient’s heavy and light chains. The recovered patient group exhibited a significantly higher hit ratio compared to the deceased group (one-tailed Welch’s t-test, p = 0.0043).

References

    1. Chen Z, John Wherry E. T cell responses in patients with COVID-19. Nat Rev Immunol. (2020) 20:529–36. doi: 10.1038/s41577-020-0402-6 - DOI - PMC - PubMed
    1. Huang C, Wang Y, Li X, Ren L, Zhao J, Hu Y, et al. . Clinical features of patients infected with 2019 novel coronavirus in Wuhan, China. Lancet. (2020) 395(10223):497–506. doi: 10.1016/S0140-6736(20)30183-5 - DOI - PMC - PubMed
    1. Lucas C, Wong P, Klein J, Castro TBR, Silva J, Sundaram M, et al. . Longitudinal analyses reveal immunological misfiring in severe COVID-19. Nature. (2020) 584(7821):463–9. doi: 10.1038/s41586-020-2588-y - DOI - PMC - PubMed
    1. Zhang F, Gan R, Zhen Z, Hu X, Li X, Zhou F, et al. . Adaptive immune responses to SARS-CoV-2 infection in severe versus mild individuals. Signal Transduct Target Ther. (2020) 5(1):156. doi: 10.1038/s41392-020-00263-y - DOI - PMC - PubMed
    1. COMBAT . A blood atlas of COVID-19 defines hallmarks of disease severity and specificity. Cell. (2022) 185:916–938.e958. doi: 10.1016/j.cell.2022.01.012 - DOI - PMC - PubMed

Substances