. 2024 Nov;35(11):e14267.
doi: 10.1111/pai.14267.

Immunomodulatory metabolites in IgE-mediated food allergy and oral immunotherapy outcomes based on metabolomic profiling

Affiliations

Immunomodulatory metabolites in IgE-mediated food allergy and oral immunotherapy outcomes based on metabolomic profiling

Yamini V Virkud et al. Pediatr Allergy Immunol. 2024 Nov.

Abstract

Background: The immunometabolic mechanisms underlying variable responses to oral immunotherapy (OIT) in patients with IgE-mediated food allergy are unknown.

Objective: To identify novel pathways associated with tolerance in food allergy, we used metabolomic profiling to find pathways important for food allergy in multiethnic cohorts and responses to OIT.

Methods: Untargeted plasma metabolomics data were generated from the VDAART healthy infant cohort (N = 384), a Costa Rican cohort of children with asthma (N = 1040), and a peanut OIT trial (N = 20) evaluating sustained unresponsiveness (SU, protection that lasts after therapy) versus transient desensitization (TD, protection that ends immediately afterward). Generalized linear regression modeling and pathway enrichment analysis identified metabolites associated with food allergy and OIT outcomes.

Results: Compared with unaffected children, those with food allergy were more likely to have metabolomic profiles with altered histidines and increased bile acids. Eicosanoids (e.g., arachidonic acid derivatives) (q = 2.4 × 10⁻²⁰) and linoleic acid derivatives (q = 3.8 × 10⁻⁵) pathways decreased over time on OIT. Comparing SU versus TD revealed differing concentrations of bile acids (q = 4.1 × 10⁻⁸), eicosanoids (q = 7.9 × 10⁻⁷), and histidine pathways (q = .015). In particular, the bile acid lithocholate (4.97 [1.93, 16.14], p = .0027), the eicosanoid leukotriene B4 (3.21 [1.38, 8.38], p = .01), and the histidine metabolite urocanic acid (22.13 [3.98, 194.67], p = .0015) were higher in SU.

Conclusions: We observed distinct profiles of bile acids, histidines, and eicosanoids that vary among patients with food allergy, over time on OIT and between SU and TD. Participants with SU had higher levels of metabolites such as lithocholate and urocanic acid, which have immunomodulatory roles in key T-cell subsets, suggesting potential mechanisms of tolerance in immunotherapy.

Keywords: IgE‐mediated food allergy; OIT; arachidonic acid; bile acids; desensitization; eicosanoids; food allergy; histidines; immunotherapy; lithocholate; lithocholic acid; metabolomics; oral immunotherapy; peanut allergy; remission; secondary bile acids; sustained unresponsiveness; transient desensitization; urocanate; urocanic acid.


Conflict of interest statement

CONFLICT OF INTEREST STATEMENT

JLS is a scientific consultant to Precion Inc. and TruDiagnostic Inc. AAL contributes to UpToDate, Inc.—author of online education, royalties totaling not more than $3000 per year. STW receives royalties from UpToDate and is on the board of Histolix a digital pathology company. JCC has received research materials (inhaled steroids) from Merck, in order to provide medications free of cost to participants in an NIH-funded study, unrelated to the current work. The remaining authors have no conflicts of interest to disclose.

Figures

FIGURE 1
FIGURE 1
Overview of Cohort Study Design and Analysis in three studies. Top: To study the metabolomics of food allergy, two cohorts, the Genetics of Asthma in Costa Rica (GACRS) and the Vitamin D Antenatal Asthma Reduction Trial (VDAART) were used. Food allergy status was determined based on available clinical data (self-report for GACRS and detailed food allergy questionnaire for VDAART). Untargeted metabolomic profiles were compared between participants with food allergy and unaffected controls to identify key metabolites and subclasses of interest. Bottom: To study the metabolomics of OIT responses, we used the Peanut Oral Immunotherapy trial (PNOIT), where participants underwent 56 weeks of peanut immunotherapy, followed by 4 weeks of avoidance to determine who could maintain the protection of OIT after stopping (sustained unresponsiveness, SU) versus who lost protection soon after stopping (transient desensitization, TD), as determined by oral food challenges (OFC) to full servings of peanut. Untargeted metabolomics was performed on the SU and TD groups to determine metabolites that changed over time on OIT versus those that differed between SU and TD groups. Created with BioRender.com.
FIGURE 2
FIGURE 2
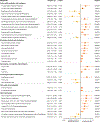
Metabolomic profiling of Food Allergy in the GACRS and VDAART pediatric populations identifies altered bile acid and histidine metabolic pathways. Plasma metabolites associated with food allergy using logistic regression within each cohort, adjusted for age (for VDAART and GACRS), sex (for VDAART and GACRS), and race (for VDAART only), identified 29 significant metabolites higher in participants with food allergy (orange) and nine significant metabolites higher in unaffected controls (yellow). Pathways with three or more unique metabolites included bile acids and histidine metabolism. Metabolomic profiling for each cohort was conducted in different laboratories, leading to some differences in annotation of metabolites. Metabolite IDs available in Table S2.
FIGURE 3
FIGURE 3
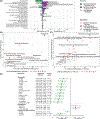
PNOIT: Metabolites associated with change over time in the entire cohort during OIT. (A) Subclasses of significant (p < .05), age-adjusted metabolites with the number of metabolites increasing (purple) and decreasing (green) based on linear regression modeling of samples at three timepoints (pre-OIT, early buildup, and post-OIT). The total number of detected nonsignificant metabolites within each subclass is denoted in gray. Pathway enrichment analyses show (B) enrichment ratios (ratio of observed significant metabolites divided by expected significant metabolites) of chemical subclasses plotted by the FDR-adjusted p-value plotted on a log10 scale, and (C) percent of significant metabolites divided by the total metabolites within the pathway plotted by the FDR-adjusted p-value plotted on a log10 scale. In (B) and (C), black line denotes q < .05, and key pathways of interest are labeled in magenta (bile acids, eicosanoids, linoleic acids, sphingolipids, and histidine metabolites). (D) Association of each metabolite with time on OIT using the above-described GLM models (coefficient represents the magnitude of increase or decrease in the scaled unit of metabolite concentration for every month on therapy). Only key metabolite pathways are reported here; see Figure S1A for all metabolites significantly associated with time and Figure S1B for all metabolites detected within the key pathways. di-HETE, di-hydroxy-eicosatetraenoic acid; HEPE, Hydroxy-eicosapentaenoic acid; HETE, hydroxy-eicosatetraenoic acid; HODE, hydroxyoctadecadienoic acid; HpODE, hydroperoxyoctadecadienoic acid; LTB, leukotriene B.
FIGURE 4
FIGURE 4
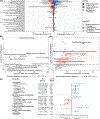
PNOIT: Metabolites differing between participants who develop sustained unresponsiveness (SU) compared to transient desensitization (TD), adjusted for time. (A) Subclasses of significant (p < .05), age-adjusted metabolites with the number of metabolites throughout therapy (pre-OIT, early buildup, and post-OIT) which were higher in either SU (blue) or TD (red). The total number of detected nonsignificant metabolites within each subclass is denoted in gray. Pathway enrichment analyses show (B) the ratio of observed significant metabolites divided by the number of expected metabolites within the chemical subclass plotted by the FDR-adjusted p-value plotted on a log10 scale, and (C) the percent of significant metabolites divided by the total metabolites within the biological pathway plotted by the FDR-adjusted p-value plotted on a log10 scale. In B and C, black line denotes q < .05, and key pathways of interest are labeled in magenta (bile acids, eicosanoids, linoleic acids, sphingolipids, and histidine metabolites). (D) Association of each metabolite with outcome (SU vs TD) on OIT, adjusted for time, using the above-described GLM models. Odds ratios (OR) represent the change in odds of remission for every increase in 1 scaled unit of metabolite concentration. Only key metabolite pathways are reported here, see Figure S2A for all metabolites significantly associated with time and Figure S2B for all metabolites detected within the key pathways. DHET, Dihydroxyeicosatrienoic acid; di-HETE, di-hydroxy-eicosatetraenoic acid; HEPE, hydroxy-eicosapentaenoic acid; HETE, hydroxy-eicosatetraenoic acid; HODE, hydroxyoctadecadienoic acid; HpODE, hydroperoxyoctadecadienoic acid; LTB, leukotriene B; sphingomyelin (SM).
FIGURE 5
FIGURE 5
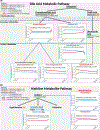
PNOIT: Overview of key metabolic pathways of interest and metabolite trajectories during OIT, between transient desensitization (TD, red) and sustained unresponsiveness (SU, blue). (A) Bile acid pathway. (B) Histidine pathway. (C) Omega 3 fatty acids (PUFAs). (D) Omega 6 fatty acids (PUFAs). Metabolites associated with food allergy from the VDAART and GACRS studies are denoted in small boxes colored by orange (higher in food allergy) or yellow (higher in unaffected controls). Metabolites associated with time on OIT in the entire cohort are denoted in small boxes in green (decreasing during OIT) or purple (increasing during OIT). Modified derivatives of the main metabolite are listed under the main metabolite. Only metabolites that significantly differ in association with food allergy and/or OIT are depicted, with major biosynthetic processes in thick arrows and simpler metabolic modifications in thin arrows. Graphs are only displayed for metabolites that differed significantly between SU and TD. Listed odds ratio and confidence interval (OR [95% CI]) statistics are summarized from logistic regression models presented in Figure 4D, analyzing of the OIT outcome (SU vs TD), with metabolite concentration as the predictor, adjusted for age and time on OIT (including three timepoints, pre-OIT, early buildup, and post-OIT). Error bars represent the standard error of the median. DHET, Dihydroxyeicosatrienoic acid; di-HETE, di-hydroxy-eicosatetraenoic acid; HEPE, hydroxy-eicosapentaenoic acid; HETE, hydroxy-eicosatetraenoic acid; HODE, hydroxyoctadecadienoic acid; HpODE, hydroperoxyoctadecadienoic acid; LTB, leukotriene B. Created with Biorender.com
FIGURE 5
FIGURE 5
PNOIT: Overview of key metabolic pathways of interest and metabolite trajectories during OIT, between transient desensitization (TD, red) and sustained unresponsiveness (SU, blue). (A) Bile acid pathway. (B) Histidine pathway. (C) Omega 3 fatty acids (PUFAs). (D) Omega 6 fatty acids (PUFAs). Metabolites associated with food allergy from the VDAART and GACRS studies are denoted in small boxes colored by orange (higher in food allergy) or yellow (higher in unaffected controls). Metabolites associated with time on OIT in the entire cohort are denoted in small boxes in green (decreasing during OIT) or purple (increasing during OIT). Modified derivatives of the main metabolite are listed under the main metabolite. Only metabolites that significantly differ in association with food allergy and/or OIT are depicted, with major biosynthetic processes in thick arrows and simpler metabolic modifications in thin arrows. Graphs are only displayed for metabolites that differed significantly between SU and TD. Listed odds ratio and confidence interval (OR [95% CI]) statistics are summarized from logistic regression models presented in Figure 4D, analyzing of the OIT outcome (SU vs TD), with metabolite concentration as the predictor, adjusted for age and time on OIT (including three timepoints, pre-OIT, early buildup, and post-OIT). Error bars represent the standard error of the median. DHET, Dihydroxyeicosatrienoic acid; di-HETE, di-hydroxy-eicosatetraenoic acid; HEPE, hydroxy-eicosapentaenoic acid; HETE, hydroxy-eicosatetraenoic acid; HODE, hydroxyoctadecadienoic acid; HpODE, hydroperoxyoctadecadienoic acid; LTB, leukotriene B. Created with Biorender.com

Update of

References

    1. Gupta RS, Warren CM, Smith BM, et al. Prevalence and severity of food allergies among US adults. JAMA Netw Open. 2019;2(1):e185630. doi:10.1001/jamanetworkopen.2018.5630 - DOI - PMC - PubMed
    1. Gupta RS, Warren CM, Smith BM, et al. The public health impact of parent-reported childhood food allergies in the United States. Pediatrics. 2018;142(6):e20181235. doi:10.1542/peds.2018-1235 - DOI - PMC - PubMed
    1. Branum AM, Lukacs SL. Food allergy among children in the United States. Pediatrics. 2009;124(6):1549–1555. doi:10.1542/peds.2009-1210 - DOI - PubMed
    1. Pepper AN, Assa’ad A, Blaiss M, et al. Consensus report from the Food Allergy Research & Education (FARE) 2019 Oral immunotherapy for food allergy summit. J Allergy Clin Immunol. 2020;146(2):244–249. doi:10.1016/j.jaci.2020.05.027 - DOI - PubMed
    1. Nowak-Wegrzyn A, Sampson HA. Future therapies for food allergies. J Allergy Clin Immunol. 2011;127(3):558–573. doi:10.1016/j.jaci.2010.12.1098 - DOI - PMC - PubMed

LinkOut - more resources