. 2025 Jan 6;224(1):e202406103.
doi: 10.1083/jcb.202406103. Epub 2024 Nov 12.

ER export via SURF4 uses diverse mechanisms of both client and coat engagement

Affiliations

ER export via SURF4 uses diverse mechanisms of both client and coat engagement

Julija Maldutyte et al. J Cell Biol. .

Abstract

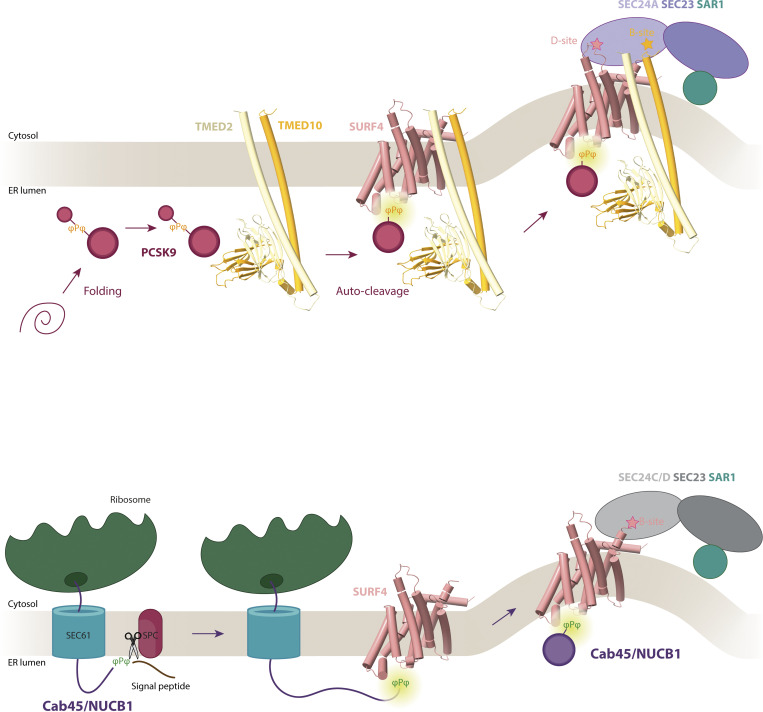
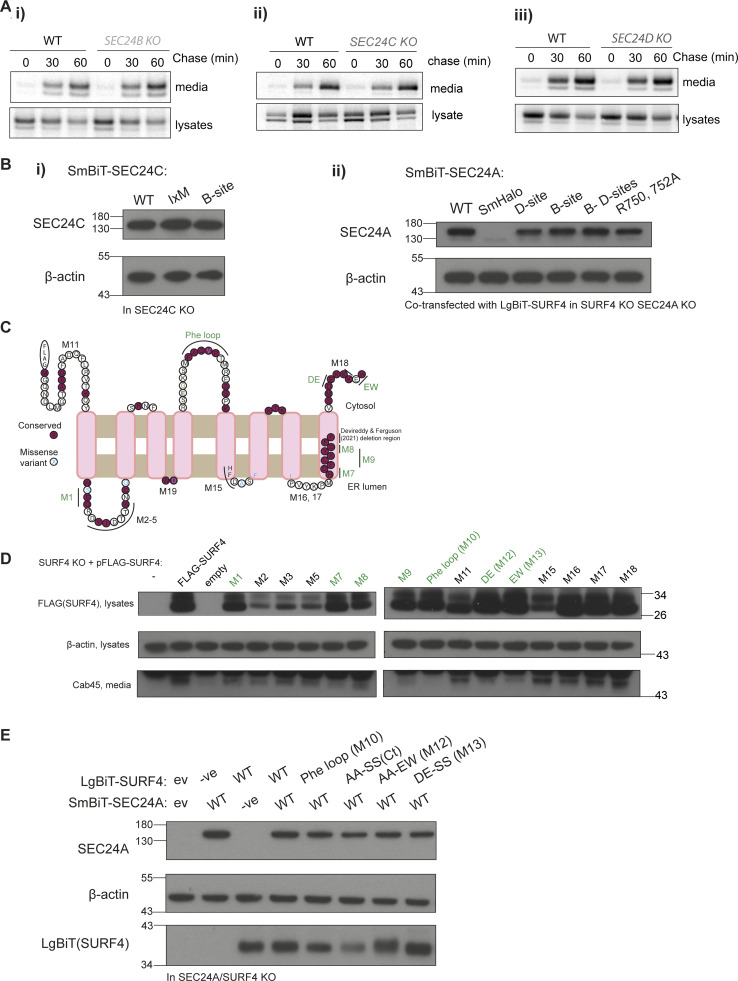
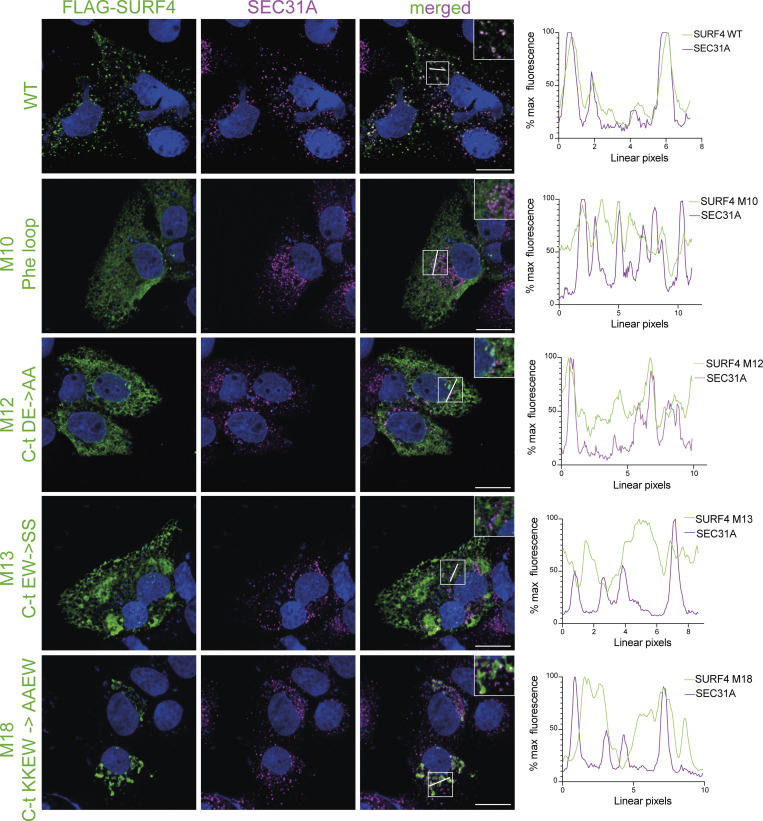
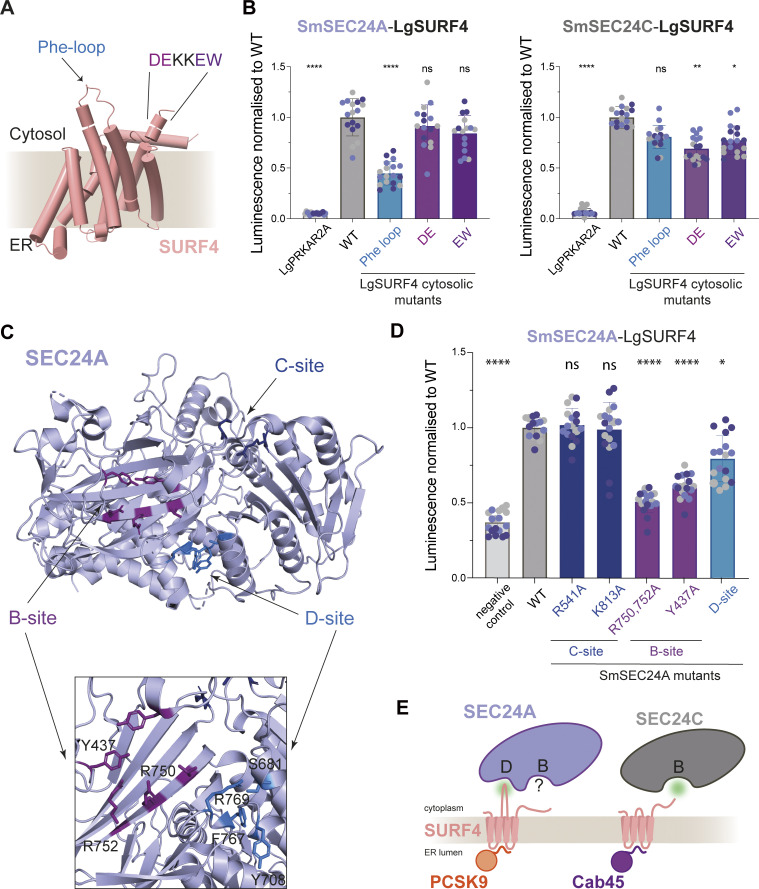
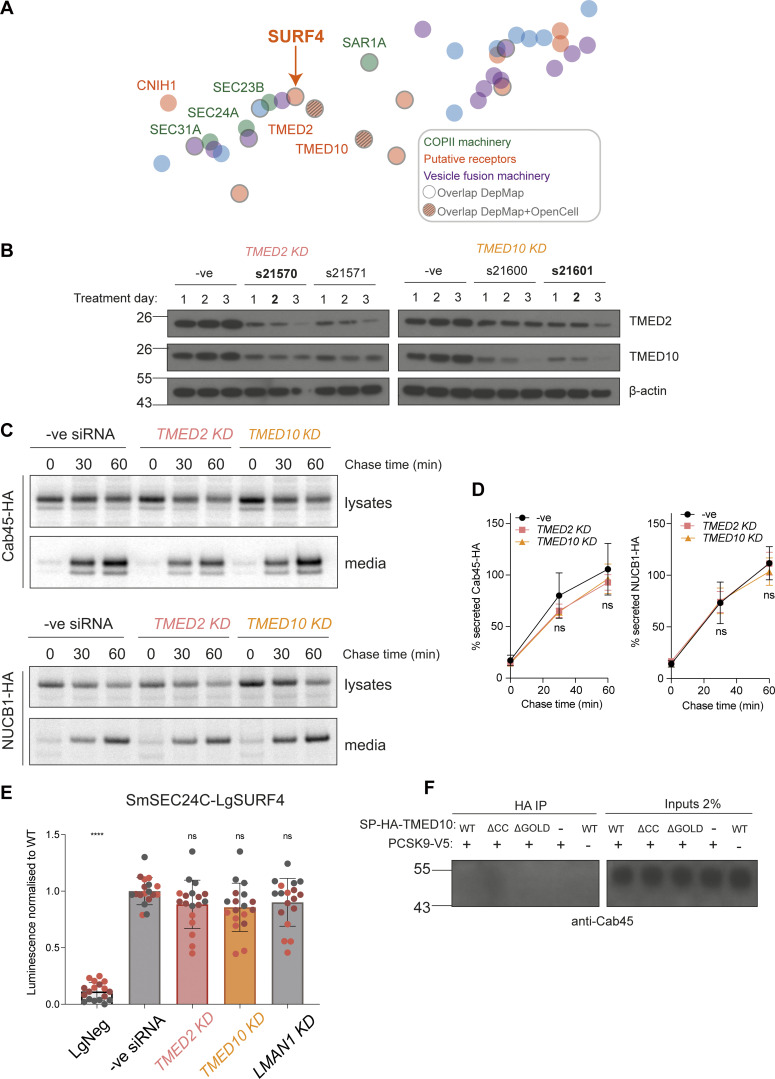
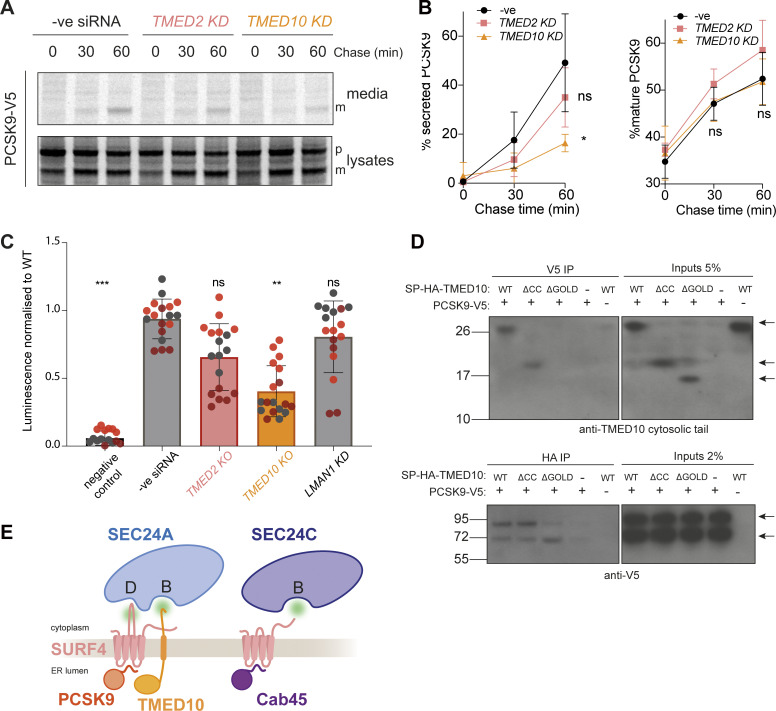
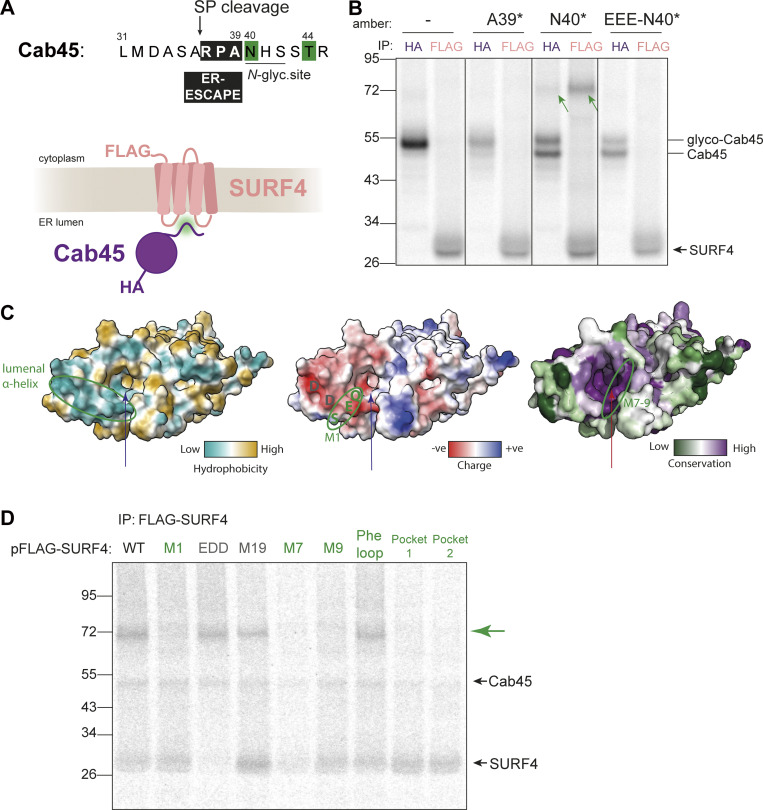
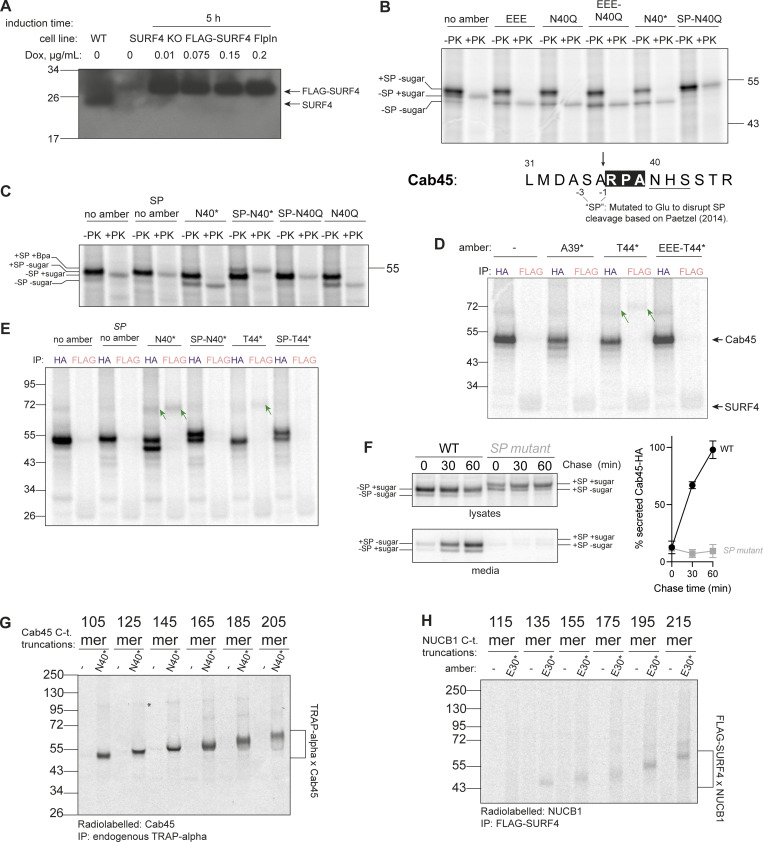
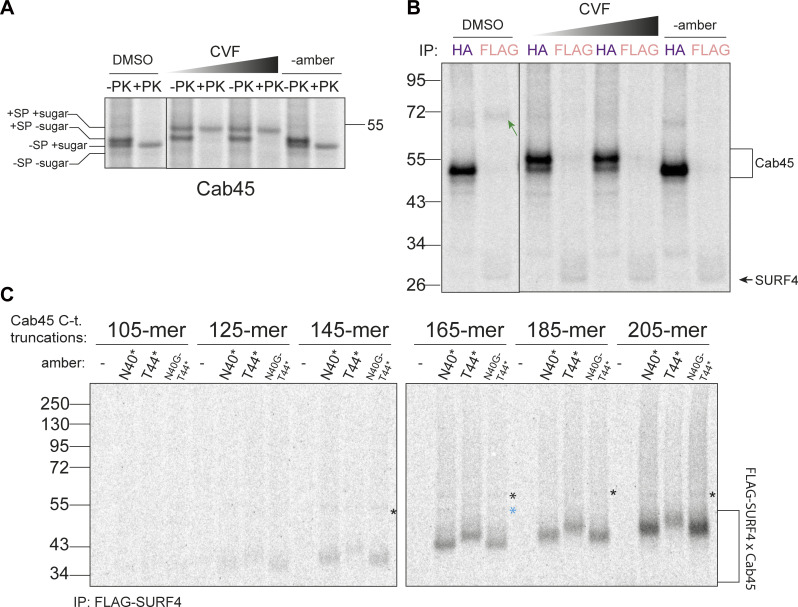
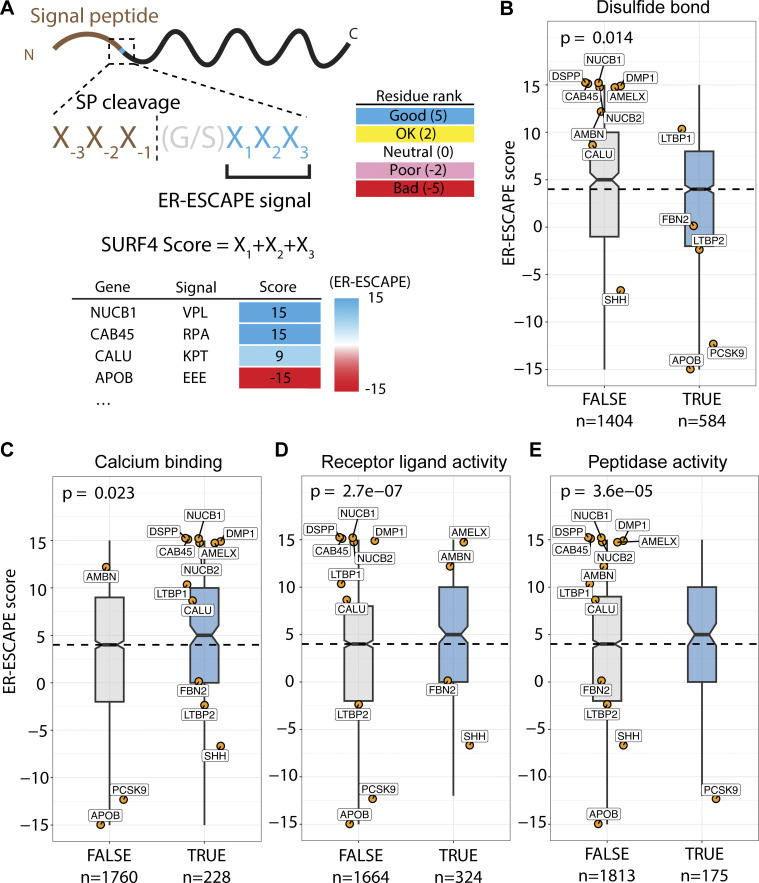
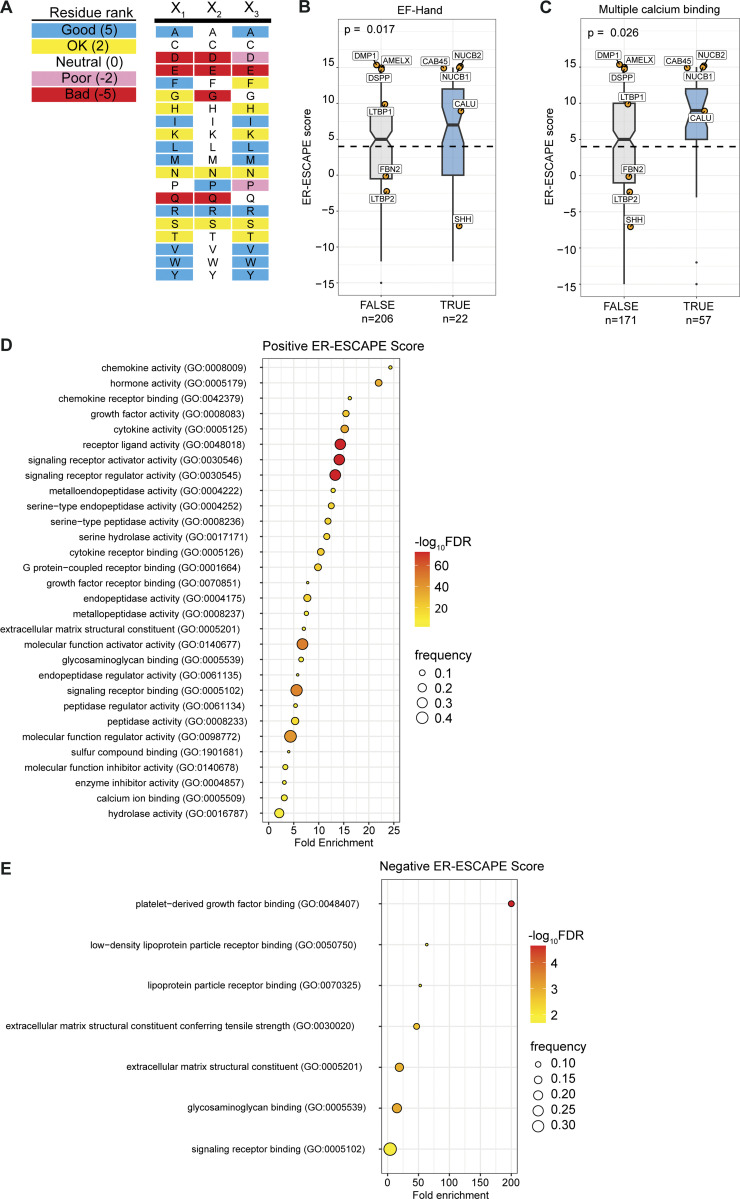
Protein secretion is an essential process that drives cell growth and communication. Enrichment of soluble secretory proteins into ER-derived transport carriers occurs via transmembrane cargo receptors that connect lumenal cargo to the cytosolic COPII coat. Here, we find that the cargo receptor, SURF4, recruits different SEC24 cargo adaptor paralogs of the COPII coat to export different cargoes. The secreted protease, PCSK9, requires both SURF4 and a co-receptor, TMED10, for export via SEC24A. In contrast, secretion of Cab45 and NUCB1 requires SEC24C/D. We further show that ER export signals of Cab45 and NUCB1 bind co-translationally to SURF4 via a lumenal pocket, contrasting prevailing models of receptor engagement only upon protein folding/maturation. Bioinformatics analyses suggest that strong SURF4-binding motifs are features of proteases, receptor-binding ligands, and Ca2+-binding proteins. We propose that certain classes of proteins are fast-tracked for rapid export to protect the health of the ER lumen.


Conflict of interest statement

Disclosures: The authors declare no competing interests exist.

Figures

None
Graphical abstract
Figure 1.
Figure 1.
SEC24C/D B-site drives Cab45 secretion. (A) Radiolabeled pulse-chase experiment testing Cab45 and NUCB1 secretion in WT and SEC24A KO cells. Transiently transfected HA-tagged proteins were immunoprecipitated from media and lysates at indicated time points after [35S]-Met/Cys addition and detected by SDS-PAGE and phosphorimage analysis. (B) Protein secretion shown in A was quantified from three independent experiments. (C) Radiolabeled pulse-chase experiment testing Cab45 secretion in WT and KO/KD cells as indicated. (D) Quantification of secretion experiments shown in B; n = 3. (E) Diagram of NanoBiT complementation assay to assess SURF4-SEC24 interactions. (F) NanoBiT luminescence measured upon co-expression of LgBiT-SURF4 with the indicated SmBiT-SEC24C mutants, normalized to WT values. Negative control was a smallBiT-PRKACA (activation of protein kinase A) fusion that controls for Small-BiT background complementation. (G) Crystal structure of SEC24C (PDB ID: 3EH2) showing the two binding sites tested in the NanoBiT assay. (H) NanoBiT luminescence was measured upon co-expression of LgBiT-SURF4 and SmBiT-SEC24C in the presence of the B-site-occluding small molecule, 4-PBA, normalized to WT. Negative control was largeBiT-PKAR2A (protein kinase cAMP-dependent type II regulatory subunit alpha) that controls for non-specific large-BiT binding. Six technical replicates were used in each of the three independent NanoBiT biological replicates, as indicated by differential coloring within superplots. Triangles represent mean and error bars represent SD. Statistical tests were one-way ANOVA with Dunnett’s correction for multiple testing. Data distribution was assumed to be normal but this was not formally tested. ns = not significant. * = P value <0.033, ** = P value <0.002, *** = P value <0.0002, **** = P value <0.0001. Source data are available for this figure: SourceData F1.
Figure S1.
Figure S1.
Cargo secretion in SEC24C KO, NanoBiT mutant stability and SURF4 mutagenesis. (A) Radiolabeled pulse-chase experiment testing Cab45 secretion in WT and SEC24 KO cells. Transiently transfected HA-tagged Cab45 was immunoprecipitated from media and lysates at indicated time points after [35S]-Met/Cys addition and detected by SDS-PAGE and phosphorimage analysis. n = 1. (B) Stability of indicated SEC24 constructs was tested in appropriate KO cells by immunoblotting for steady-state protein levels using the antibodies indicated. β-actin served as loading control. (C) SURF4 topology prediction based on trRosetta, TOPCONS, and other topology prediction algorithms (see Materials and methods), with conservation and disease variants mapped from gnomAD. Based on this prediction, mutants in cytosolic or lumenal regions were generated. Those labeled in green indicate defects in Cab45 secretion but stable expression of the mutant. (D) Immunoblots of steady-state FLAG-SURF4 and secreted Cab45 upon transient expression of FLAG-SURF4 WT and mutant constructs in HEK-293TREx SURF4 KO. Actin serves as a loading control for lysates. Mutants in green had reduced or no Cab45 secretion rescue in the media. (E) Stability of indicated SURF4 constructs was tested in appropriate KO cells by immunoblotting for steady-state protein levels using the antibodies indicated. β-actin served as a loading control. Source data are available for this figure: SourceData FS1.
Figure S2.
Figure S2.
FLAG-SURF4 WT and cytosolic mutant subcellular localization. FLAG-SURF4 WT and indicated mutants were transiently transfected into Huh7 SURF4 KO cells. Cells were fixed, immunostained using anti-FLAG and anti-SEC31A antibodies, and imaged on a confocal microscope. Plots indicate FLAG-SURF4 and SEC31A co-localization along the indicated line in each instance. Scale bar = 15 μm. Inset diameters are 16 µm.
Figure 2.
Figure 2.
Mutagenesis reveals complexity of SURF4 interactions with SEC24 paralogs. (A) AlphaFold2 model of SURF4, highlighting cytosolic regions important for SURF4-dependent cargo secretion identified by mutagenesis. (B) Luminescence values were measured upon co-expression of SmBiT-SEC24C or SmBiT-SEC24A with the indicated LgBiT-SURF4 mutants, normalized to WT values. (C) Crystal structure of SEC24A (PDB ID: 5VNO) showing the three binding sites tested in the NanoBiT assay; the neighboring B- and D-sites are zoomed in. (D) NanoBiT complementation measured upon co-expression of LgBiT-SURF4 and the indicated SmBiT-SEC24A mutants, normalized to WT. (E) Model summarizing secretion dissected by NanoBiT and pulse-chase. SEC24A engages SURF4 via a D-site-cytosolic loop interaction, whereas the B-site is important for PCSK9 secretion but not for SURF4 engagement. SEC24C engages C-terminal motifs of SURF4 via its B-site to drive Cab45 export. Statistical tests were one-way ANOVA with Dunnett’s correction for multiple testing. Data distribution was assumed to be normal but this was not formally tested. ns = not significant, * = P value <0.033, ** = P value <0.002, *** = P value <0.0002, **** = P value <0.0001. For each NanoBiT experiment, six technical replicates were used in each of the three independent biological replicates, as indicated by differential coloring within superplots. Triangles represent mean and error bars represent SD.
Figure S3.
Figure S3.
TMED2 and TMED10 do not participate in Cab45 or NUCB1 secretion. (A) Close-up view of the co-essentiality Browser’s neighborhood “ER-to-Golgi body transport”. Wainberg et al. (2021) visualized this co-essentiality by plotting strongly co-essential genes together, as determined by their generalized least squares method. Overlapping Depmap co-dependencies are outlined in grey and overlapping DepMap+OpenCell interactions have a grey grid added. (B) HEK-293TREx cells were treated with the indicated Silencer Select siRNAs for the indicated number of days, alongside a negative siRNA control. For each TMED treatment, lysates were blotted for both TMED2 and TMED10. Actin served as loading control. Conditions in bold were chosen for pulse-chase and NanoBiT experiments. (C) Radiolabeled pulse-chase of Cab45 and NUCB1. HEK-293TREx cells were transfected with the indicated siRNAs, then 24 h later transfected with a plasmid expressing Cab45-HA or NUCB1-HA, which were detected by pulse-chase and immunoprecipitation the following day. Protein secretion was quantified from autoradiographs following SDS-PAGE. Each pulse-chase experiment is representative of three biological replicates and is quantified in D. (E) SURF4/SEC24C double KO cells were transfected with the indicated siRNAs, then 24 h later were cotransfected with SmBiT-SEC24C and LgBiT-SURF4 NanoBiT constructs. Luciferase luminescence values were measured and normalized to WT. Triangles represent mean and error bars represent SD. (F) DSP-crosslinking co-immunoprecipitation of endogenous Cab45 from cells expressing SP-HA-TMED10 WT, coiled-coil, and GOLD domain deletion mutants. Statistical tests were one-way ANOVA with Dunnett’s correction for multiple testing. Data distribution was assumed to be normal but this was not formally tested. ns = not significant, **** = P value <0.0001. For each NanoBiT experiment, six technical replicates were used in each of the three independent biological replicates, as indicated by differential coloring within superplots. Triangles represent the mean and error bars represent SD. Source data are available for this figure: SourceData FS3.
Figure 3.
Figure 3.
TMED10 is required for efficient PCSK9 export. (A) Radiolabeled pulse-chase of PCSK9 secretion. HEK-293TREx cells were transfected with the indicated siRNAs, and after 24 h were transfected with a plasmid expressing PCSK9-V5, then subjected to pulse-chase analysis the following day. (B) Protein secretion was quantified from three biological replicates. (C) SURF4/SEC24 double KO cells were transfected with the indicated siRNAs, then after 24 h co-transfected with SmBiT-SEC24A and LgBiT-SURF4 NanoBiT constructs. Luciferase luminescence values were normalised to WT. Triangles represent mean and error bars represent SD. For each NanoBiT experiment, six technical replicates were used in each of the three independent biological replicates, as indicated by differential coloring within superplots. Triangles represent the mean and error bars represent SD. (D) DSP-crosslinking co-immunoprecipitation of PCSK9-V5 and SP-HA-TMED10 WT, coiled-coil and GOLD domain deletion mutants. The indicated constructs were co-transfected in TMED10 KO cells (- means empty pcDNA3.1 vector was used). Cells were collected, treated with DSP and cleared lysates co-immunoprecipitated overnight. Antibody to detect TMED10 signal was against TMED10 cytosolic tail. (E) A cartoon model illustrating the two mechanisms by which SURF4 relays cargo recruitment to the inner COPII coat. Statistical tests were one-way ANOVA with Dunnett’s correction for multiple testing. Data distribution was assumed to be normal but this was not formally tested. ns = not significant, * = P value <0.033, ** = P value <0.002, *** = P value <0.0002. Source data are available for this figure: SourceData F3.
Figure 4.
Figure 4.
ER-ESCAPE binds a conserved lumenal pocket of SURF4. (A) N-terminal amino acid sequence of Cab45. Numbering indicates amino acid positions from the N-terminus, including SP. An ER-ESCAPE motif (black box) follows a signal peptide cleavage site (arrow), followed by a putative N-glycosylation site. Green shading shows positions that were crosslinked to SURF4. (B) A site-specific photo-crosslinking experiment showing the dependence of Cab45-SURF4 interaction on ER-ESCAPE. HA and FLAG IPs were performed on UV-crosslinked semi-permeabilized cells. Green arrows indicate crosslinked species recovered by both Cab45-HA and FLAG-SURF4 IPs. Presumed migration of Cab45 species and SURF4 are indicated. (C) ER lumenal views of SURF4 AF2 structure predictions showing hydrophobicity, surface charge, and conservation scores (left to right). The long arrow points to the predicted pocket for ER-ESCAPE binding, the small arrow indicates another, smaller putative pocket. A lumenal α-helix previously shown to bind CW motifs, and M7-9 regions are circled. (D) IVT and site-specific photo-crosslinking of Cab45-N40* to SURF4 and its mutants. HEK-293TREx SURF4 KO cells were transfected with the indicated FLAG-SURF4 constructs 24 h prior to IVT. Further sample processing was performed as in B. SURF4 mutants in green are those that did not produce a cross-link with SURF4 (indicated by green arrow), and mutants in grey produced a crosslink. Source data are available for this figure: SourceData F4.
Figure S4.
Figure S4.
Co-translational and SP-dependent interaction of clients with SURF4. (A) Doxycycline induction test to optimize concentration for FLAG-SURF4 expression. A western blot of cell lysates, probed with an antibody for endogenous SURF4 is shown. (B) Proteinase K (PK) protection assay for various Cab45 constructs, examining the effects of indicated mutations at and near the SP cleavage, ER-ESCAPE and N-glycosylation sites with respect to glycosylation and SP cleavage. The size of PK-protected (i.e., ER membrane-enclosed) Cab45-40N* band is the same as that of a glycosylation mutant Cab45-N40Q (and Cab45-EEE [ER-ESCAPE mutation] as well as Cab45-EEE-N40Q), lower than that of Cab45 WT (no amber) and much lower than Cab45-SP-N40Q, whereby SP cleavage is disrupted (as per schematic below). This indicates that Bpa incorporation at position 40 (as well as ER-ESCAPE mutation into EEE) does not disrupt SP cleavage but instead prevents N-glycosylation. The higher Mw form of Cab45-40N* seen in Fig. 4 B IPs is therefore likely SP-uncleaved form that remains in close proximity to the ER membrane and therefore is IPed together. The gel was ran until 26 kDa marker ran out to have better separation of the different Cab45 intermediates. (C) Proteinase K (PK) protection assay of various Cab45 constructs examining the effects of indicated mutations at and near the SP cleavage, ER-ESCAPE and N-glycosylation sites with respect to membrane glycosylation and SP cleavage. The gel was ran until 17 kDa marker ran out to have better separation of the different Cab45 intermediates. (D) Site-specific Cab45-HA photo-crosslinking experiment showing Cab45-SURF4 direct interaction is ER-ESCAPE-dependent and still occurs with the N-glycan present. Semi-permeabilized cells were treated with S7 nuclease to reduce doxycycline-induced FLAG-SURF4 background. (E) Samples as in C, but Cab45-HA and FLAG-SURF4 IPs were performed from UV-crosslinked semi-permeabilized cells. Green arrows indicate Cab45-SURF4 cross-links. (F) n = 2. (G) Cab45 C-terminal truncations photo-crosslinked to TRAPα with Bpa placed at the N-glycosylation site of Cab45 (N40*). (H) NUCB1 C-terminal truncations photo-crosslinked to FLAG-SURF4 immunoprecipitated from UV-crosslinked semi-permeabilized cells. Source data are available for this figure: SourceData FS4.
Figure 5.
Figure 5.
Cab45-SURF4 interaction is SP cleavage-dependent and occurs co-translationally. (A) Proteinase K (PK) protection assay of Cab45-T44* or Cab45 with no amber suppression, treated with an increasing concentration of cavinafungin (CVF; 1 μM, 10 μM in DMSO [1% of IVT reaction volume]) or vehicle DMSO. Samples were taken from total lVT reactions. Positions of different species of Cab45 are indicated. (B) The same samples as in A but Cab45-HA and FLAG-SURF4 IPs were performed on UV-crosslinked semi-permeabilized cells. Green arrow indicates Cab45-SURF4 crosslink. (C) Cab45 C-terminal truncations were translated in vitro and photo-crosslinked to FLAG-SURF4. Following UV-crosslinking and FLAG-IP, cross-linked products were resolved by SDS-PAGE. * indicates a consistent cross-link that was later identified to be TRAPα (Fig. S4 G). Blue * indicates an unidentified crosslinked species. Source data are available for this figure: SourceData F5.
Figure 6.
Figure 6.
ER-ESCAPE strength correlates with cargo properties. (A) Schematic illustrating calculation of ER-ESCAPE score. Details on position-specific scoring matrix are included in Fig. S5 A. (B–E) Distribution of ER-ESCAPE scores of cargoes among different classes. Cargoes with (B) disulfide bond annotation have lower ER-ESCAPE scores, whereas cargoes with (C) calcium binding, (D) receptor ligand activity, and (E) peptidase functions have significantly higher ER-ESCAPE scores than the population median. In each plot, dashed lines represent median ER-ESCAPE score of the full dataset (n = 1988), boxes represent inter-quartile ranges, whiskers represent the range of distribution, notches represent 95% confidence interval of the median; curated SURF4 cargoes are highlighted as orange dots with gene names. Kruskal–Wallis test is used in each plot to test the significance and calculate a P value. The sample size is annotated in each plot below class labels.
Figure S5.
Figure S5.
ER-ESCAPE score determination and comparison of across protein properties, and Gene Ontology (GO) analysis. (A) Scoring matrix for calculating ER-ESCAPE score. (B) Among annotated calcium binding proteins in the curated soluble protein secretome, proteins with annotated EF-hand domains (PROSITE) have a significantly higher ER-ESCAPE score than those without EF-Hand annotation. (C) Among annotated calcium binding proteins in the curated soluble protein secretome, proteins with multiple calcium binding sites (according to UniProt binding site annotation) have a significantly higher ER-ESCAPE score than those with a single calcium binding site. Curated SURF4 cargoes are highlighted as orange dots with gene names. In each plot, the dashed line represents ER-ESCAPE score median of the whole dataset (n = 1988), boxes represent interquartile range, whiskers represent ranges of distribution, and notches represent 95% confidence interval of the median. Kruskal–Wallis test is used in each plot to test the significance and calculate P value. Sample size is annotated in each plot below class labels. (D and E) GO enrichment analysis for (D) high positive ER-ESCAPE score (ER-ESCAPE score = 15 or 12), or (E) negative ER-ESCAPE score (ER-ESCAPE score = −15 or −12). In each case, GO terms are sorted by fold enrichment, colored by negative logarithm of false discovery rate (FDR); the size of each dot corresponds to the frequency of observation for each term among the high-positive or negative group.

References

    1. Anantharaman, V., and Aravind L.. 2002. The GOLD domain, a novel protein module involved in Golgi function and secretion. Genome Biol. 3:research0023. 10.1186/gb-2002-3-5-research0023 - DOI - PMC - PubMed
    1. Appenzeller-Herzog, C., Nyfeler B., Burkhard P., Santamaria I., Lopez-Otin C., and Hauri H.-P.. 2005. Carbohydrate- and conformation-dependent cargo capture for ER-exit. Mol. Biol. Cell. 16:1258–1267. 10.1091/mbc.e04-08-0708 - DOI - PMC - PubMed
    1. Appenzeller-Herzog, C., Roche A.C., Nufer O., and Hauri H.P.. 2004. pH-induced conversion of the transport lectin ERGIC-53 triggers glycoprotein release. J. Biol. Chem. 279:12943–12950. 10.1074/jbc.M313245200 - DOI - PubMed
    1. Ashkenazy, H., Abadi S., Martz E., Chay O., Mayrose I., Pupko T., and Ben-Tal N.. 2016. ConSurf 2016: An improved methodology to estimate and visualize evolutionary conservation in macromolecules. Nucleic Acids Res. 44:W344–W350. 10.1093/nar/gkw408 - DOI - PMC - PubMed
    1. Bare, Y., Matusek T., Vriz S., Deffieu M.S., Thérond P.P., and Gaudin R.. 2023. TMED10 mediates the loading of neosynthesised Sonic Hedgehog in COPII vesicles for efficient secretion and signalling. Cell. Mol. Life Sci. 80:266. 10.1007/s00018-023-04918-1 - DOI - PMC - PubMed

MeSH terms

LinkOut - more resources