. 2024 Nov 12:13:RP97674.
doi: 10.7554/eLife.97674.

Contributions of mirror-image hair cell orientation to mouse otolith organ and zebrafish neuromast function

Affiliations

Contributions of mirror-image hair cell orientation to mouse otolith organ and zebrafish neuromast function

Kazuya Ono et al. Elife. .

Abstract

Otolith organs in the inner ear and neuromasts in the fish lateral-line harbor two populations of hair cells oriented to detect stimuli in opposing directions. The underlying mechanism is highly conserved: the transcription factor EMX2 is regionally expressed in just one hair cell population and acts through the receptor GPR156 to reverse cell orientation relative to the other population. In mouse and zebrafish, loss of Emx2 results in sensory organs that harbor only one hair cell orientation and are not innervated properly. In zebrafish, Emx2 also confers hair cells with reduced mechanosensory properties. Here, we leverage mouse and zebrafish models lacking GPR156 to determine how detecting stimuli of opposing directions serves vestibular function, and whether GPR156 has other roles besides orienting hair cells. We find that otolith organs in Gpr156 mouse mutants have normal zonal organization and normal type I-II hair cell distribution and mechano-electrical transduction properties. In contrast, gpr156 zebrafish mutants lack the smaller mechanically evoked signals that characterize Emx2-positive hair cells. Loss of GPR156 does not affect orientation-selectivity of afferents in mouse utricle or zebrafish neuromasts. Consistent with normal otolith organ anatomy and afferent selectivity, Gpr156 mutant mice do not show overt vestibular dysfunction. Instead, performance on two tests that engage otolith organs is significantly altered - swimming and off-vertical-axis rotation. We conclude that GPR156 relays hair cell orientation and transduction information downstream of EMX2, but not selectivity for direction-specific afferents. These results clarify how molecular mechanisms that confer bi-directionality to sensory organs contribute to function, from single hair cell physiology to animal behavior.

Keywords: afferent innervation; cell polarity; developmental biology; hair cells; inner ear; lateral line; mechano-electrical transduction; mouse; neuroscience; zebrafish.


Conflict of interest statement

KO, AJ, NH, AJ, HC, MD, RE, KC, KK, BT No competing interests declared

Figures
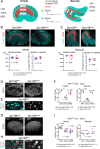
Figure 1.
Figure 1.. Normal striola and hair cell type organization in Gpr156 mutants.
(A) Diagrams showing general macular organization and the regions analyzed in (B–I) (LES, MES: lateral and medial extrastriola, respectively; ANT: anterior, POST: posterior). Each region is 130x50 µm in the utricle and 150x40 µm in the saccule. White chevrons indicate HC orientation. (B–C) P28 utricles (B) and saccules (C) immunolabeled with oncomodulin (OCM) to reveal the striolar region and phalloidin to reveal F-actin (F-ACT)-rich hair bundles. Graphs report striolar surface area and striolar HC density based on OCM labeling and show no change in mutants compared to heterozygote littermate controls. All points are graphed along with 25–75% boxplots (external bars: minimum and maximum, internal bar: median, cross: mean). Mann-Whitney U test. (D–F) P28 maculae immunolabeled with SPP1 to reveal type I HCs. Low magnification of the utricle (D), high magnification view showing SPP1 at the utricle HC neck (E), and quantification per region in utricle and saccule (F). (G–I) P28 maculae immunolabeled with SOX2 to reveal type II HCs. Low magnification of the utricle (G), high magnification view showing SOX2 in the utricle HC nucleus (H), and quantification per region in utricle and saccule (I). (F), (I): Two-way ANOVA with Sidak’s multiple comparisons. N, n: number of animals and HCs, respectively. UTR, utricle. Scale bars: 100 µm (B–C, D, G), 10 µm (E, H).
Figure 2.
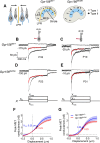
Figure 2.. No effects of Gpr156 deletion on mechanosensitivity were detected in LES hair cells.
(A) Leftrmal reversed bundle polarity at the LPR. Arrows, Directions of hair bundle motion that produce a depolarizing receptor potential. Right, Maps of recordings from LES zone, lateral to the LPR in heterozygotes, and similar location in null mutants, but without bundle reversal (arrows). (B–E) Exemplar IMET recordings from voltage-clamped LES HCs of different type (I vs. II, columns) and genotype (het vs. null, rows), and ranging in age from P10 to P31. XY scales for all 4 are in D. Each panel shows IMET current (average of 3 traces) evoked by 3 of many iterated bundle displacements (bottom of D, E): negatively and positively saturating stimuli (Xmin, Xmax) plus a step to ~ X1/2 (midpoint) of the operating range. Red traces, fits of current decay for step to X1/2 with Equations 2 or 3 (Methods). Voltage was clamped with the indicated holding currents at –94 mV (type I) and –84 mV (type II). (F,G) G(X) relations from type I (F) and type II (G) HCs. G, was peak MET conductance taken at the onset of each of 20 or 40 displacement steps (X), iterated by 100 nm or 35 nm, respectively, and averaged across 3 repeated stimulus families. Mean ± SEM; n=5–8 cells. Fitted G(X) parameters are statistically similar for Gpr156del/+ and Gpr156del/del HCs (see Supplementary file 2). Filled circles, X1/2 values from fits. Xmax: 1.1–1.3 µm. Xmin; –0.2 to –0.45 µm.
Figure 3.
Figure 3.. No effects of Gpr156 deletion on basolateral voltage-dependent conductances were detected in LES HCs.
(A–D) Exemplar voltage-dependent currents from lateral extrastriolar (LES) type I (A, C) and type II (B, D) HCs of Gpr156del/+ (A, B) and Gpr156del/del (C, D) utricles. There are significant differences between HC types, but these differences are seen in both Gpr156del/+ (A, B) and Gpr156del/del utricles (C, D). A pre-pulse from holding potential to –124 mV shows the usual type I-type II difference in K+ conductances at or near resting potential: the prepulse deactivates gK,L in type I cells (A,C), and activates a small inwardly rectifying current in type II cells (B, D). Following the pre-pulse, test steps were iterated in 5 mV increments from –124 mV to –54 mV (type I) or from –124 mV to +6 mV (type II), activating currents with very different time course and voltage dependence. (E, F) G(V) relations measured from tail currents at the end of the iterated voltage steps show that gK,L activated positive to –114 mV (E) while type II delayed rectifying currents activated positive to –64 mV (F).
Figure 4.
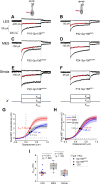
Figure 4.. Displacement sensitivity and time course of step-evoked transduction currents in each zone were not strongly affected by Gpr156 deletion.
(A–F) Exemplar IMET recordings from voltage-clamped HCs of different genotype, HC type (columns), and epithelial zone (rows). IMET current families (averages of 3) evoked by 3 of many iterated bundle displacements (E, F), bottom: negatively and positively saturating stimuli plus the step closest to the midpoint (X1/2) of the G(X) relation. Xmax: 1.08–1.32 µm. Xmin: –0.2 to –0.45 µm. Red traces, fits of current decay with Equations 2 or 3 (Methods). Holding potentials, –94 mV (type I) and –84 mV (type II). (G–H) Averaged peak (onset) GMET(X) relations for type I (G) and type II (H) HCs. Data from 5 to 9 HCs of each type were fitted with the Boltzmann functions, which were averaged to produce mean curves shown (± SEM). X1/2 values (filled circles) are given. I Mean maximum GMET of type I HCs was larger in MES than in LES or striola, but there was not a significant effect of genotype. Black circles, 2 striolar type I HCs from CD1 mice.
Figure 5.
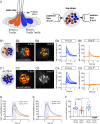
Figure 5.. Gpr156 impacted the mechanosensitive properties of lateral-line HCs.
(A) Schematic on the left shows a lateral-line neuromast from the side. HCs that detect anterior (P to A) and posterior (A to P) flow are color coded in blue and orange respectively. Posterior-sensitive HCs do not express Emx2 and rely primarily on the MET channel subunits Tmc2a and Tmc2b. In contrast, anterior-sensitive HCs express Emx2 and rely primary on Tmc2b for mechanosensation. Schematic on the right shows a plane taken through the apical hair bundle plane, viewed top-down. The directional sensitivity of each HC is dictated by the location of the kinocilium, which is indicated by the circle on the side of each hair bundle. This apical plane is one used to monitor mechanosensitive-calcium signals in lateral-line hair bundles. The pipettes on each side of the hair bundles show the direction of flow delivered to stimulate the two populations of HCs. (B1–B5) Representative example of evoked-mechanosensitive calcium signals in hair bundles of a control neuromast during a 500 ms anterior (B2) or a 500 ms posterior (B3) directed stimulus. Spatial patterns of GCaMP6s signals during stimulation (B2–B3) are colorized according to the ∆F heat map and superimposed onto a baseline GCaMP6s image. In B1, the colored circles indicate the respective hair bundle orientation observed from calcium imaging (A to P, orange; P to A, blue; no response, gray). ROIs were placed on each hair bundle to generate the ∆F/F GCaMP6s traces from individual hair bundles responding to P to A (B4) and A to P (B5) directed flow. (C1–C5) Representative example of evoked-mechanosensitive calcium signals in hair bundles of a gpr156 mutant neuromast during a 500 ms P to A (C2) or a 500 ms A to P (C3) directed stimulus. Spatial patterns of GCaMP6s signals during stimulation (C2–C3) are colorized according to the ∆F heat map in B2 and superimposed onto a baseline GCaMP6s image. In C1, the colored circles indicate the respective hair bundle orientation observed from calcium imaging (P to A, blue). ROIs were placed on all hair bundle to generate the ∆F/F GCaMP6s traces from individual hair bundles during P to A (C4) and A to P (C5) directed stimuli. (D–F) Quantification of the average increase in GCaMP6s per neuromast for P to A and A to P responding hair bundles. Traces in D and E show the average GCaMP6s response per neuromast in P to A and A to P hair-bundle populations (mean ± SEM is shown in D–E, n=9 control and 10 gpr156 neuromasts). The magnitude of the GCaMP6s data in D–E is plotted to compare the average GCaMP6s increase for P to A and A to P hair bundles for each neuromast in F. In control neuromasts, the GCaMP6s increase in the hair bundles responding to P to A flow was larger compared to those responding to A to P flow. In gpr156 mutants the GCaMP6s increase in hair bundles responding to P to A flow was significantly larger than control A to P cells, but not different than control P to A cells. **p=0.0043 and p=0.561, paired and unpaired t-test respectively. Scale bar is 5 μm in B3.
Figure 6.
Figure 6.. Afferent innervation patterns near the LES/S zone boundary were not substantially disturbed by Gpr156 deletion.
Afferent receptive fields (green) were labeled by diffusion of fluorescent dye (AlexaFluor) from whole-cell recording pipettes into calyces (asterisks) and throughout the terminal arbor, for (A–D) Gpr156del/+ controls and (E–H) Gpr156del/del mutants. Counterstained with anti-calbindin (Calb1) antibody to show the striola (magenta). Top right, Schematic of the utricle with magenta striola; black dots, approximate location of each labelled calyx shown. All labeled afferents had a thick, medial-projecting neurite that branched to form up to two calyces and many bouton contacts. Anti-βII-spectrin labeling (A, A’) leaves an unlabeled hole where the kinocilium is, allowing determination of bundle orientation black arrows outlined in white, (A) and, in Gpr156del/+ controls, the LPR (dotted white line). (A) In one control afferent, the receptive field straddled the LPR (A’, A’’), with 1 calyx on a type I HC in the LES (white arrow) and some boutons contacting type II HCs, as terminals or en passant, in the calbindin+ striola (white arrowheads). (B, C). In all other fills, the labeled LES arbors innervated only LES HCs. (C) Arrow, A thin branch extended from the fiber below the epithelium. (D) A receptive field labeled by filling a striolar calyx included 2 calyces and some bouton endings, all restricted to the calbindin+ striola (this afferent is white because of the merge of AlexaFluor and calbindin stains). (E–G) Afferent terminal fields of LES calyces from Gpr156del/del utricles largely remained in the calbindin region (LES) (E), Figure 6—video 2. (H) A striolar (calbindin+) calyx in a Gpr156del/del mouse made multiple boutons entirely in the calbindin+ area (striola). Scale bar: 20 µm L, lateral; P, posterior.
Figure 7.
Figure 7.. LES afferent innervation pattern was comparable for Gpr156del/+ and Gpr156del/del utricles.
(A) P30 utricles where oncomodulin (OCM) labels striolar HCs and Advillin-positive afferents are labeled by EGFP in Advillin-Cre; TIGRE; Gpr156 animals. Advillin-Cre neurons specifically innervated lateral HCs and orientation-based segregation was not altered in Gpr156del/del mutants. (B) Close-up views at the LES-striola border (XY and YZ views). The vast majority of HCs innervated by EGFP-positive neurons were in the the LES but Advillin-positive neurons also innervated OCM+ HCs in the lateral striola in both control and Gpr156 mutants. (C) Close-up view where basal bodies are labeled with pericentrin (PCNT) to reveal HC orientation (arrowheads). Lateral striolar HCs innervated by Advillin neurons were consistently oriented medially, showing that innervation from Advillin neurons strictly segregates with HC orientation, and not with striolar characteristics (OCM expression). Yellow dotted lines in A mark the outline of the utricle. Scale bars: 100 µm (A) 10 µm (B–C).
Figure 8.
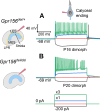
Figure 8.. The excitability of LES afferents was not significantly affected by Gpr156 deletion.
Exemplary voltage responses of control (A) and null (B) afferents to injected steps of current. We recorded from the large calyceal endings as a way to access these dimorphic afferents, which, like most LES afferents, made contact with both type I and type II HCs. For current steps (bottom) at 3×Ithresh (×3, green), both genotypes produced sustained firing, considered typical of regular afferents innervating LES and MES. Here Ithresh (blue trace) was 100 pA for Gpr156del/+ afferent and 250 pA for Gpr156del/del afferent, but overall there was no significant difference in current threshold with genotype.
Figure 9.
Figure 9.. Gpr156 was not required for lateral-line afferents to select Emx2+ or Emx2- hair cells.
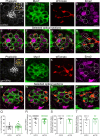
(A–H) Images of a control neuromast innervated by a single afferent fiber that contacts Emx2(-) cells at + dpf. (A) Phalloidin label reveals 16 hair bundles (8 A to P and 8 P to A hair bundles). Z-stack projections show all HCs labeled with Myo7a (B) a single afferent fiber expressing tdTomato (C) and Emx2(+and -) HCs (D). (E–H) Selected optical sections of (B–D) highlight the single afferent contacting individual Emx2(-) HCs. (I–P) Images of a gpr156 mutant neuromast innervated by a single afferent fiber that contacts Emx2(-) cells. (I) Phalloidin label revealed 14 hair bundles (13 A to P and 1 P to A hair bundles). Z-stack projections show all HCs labeled with Myo7a (J) a single afferent fiber expressing tdTomato (K) and Emx2(+ and -) HCs (L). M–O Selected optical sections of (J–L) highlight a single afferent in a gpr156 mutants contacting individual Emx2(-) HCs. (Q) In both controls and gpr156 mutants, each afferent fiber contacted the same number of HCs per neuromast. R The overall selectivity of afferent fibers for Emx2(+ or -) HCs were similarly high in gpr156 mutant and controls. (S–T) The selectivity of afferent fibers for Emx2(+) or Emx2(-) HCs was similarly high in both gpr156 mutants and controls. Arrows in A and I indicate the orientation of the hair bundles in each example. SEM is shown in Q-T. An unpaired t-test was used for comparisons. Scale bar = 5 µm.
Figure 9—figure supplement 1.
Figure 9—figure supplement 1.. Gpr156 was not required for lateral-line afferents to select Emx2+ HCs.
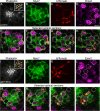
(A–H) Images of a control neuromast innervated by a single afferent fiber that contacts Emx2+ cells. (A) Phalloidin label reveals 14 hair bundles (7 A to P and 7 P to A hair bundles). Z-stack projections show all HCs labeled with Myo7a (B) a single afferent fiber expressing tdTomato (C) and Emx2+ and Emx2- HCs (D). (E–H) Selected optical sections of (B–D) highlight the single afferent contacting individual Emx2+ HCs. (I–P) Images of a gpr156 mutant neuromast innervated by a single afferent fiber that contacts Emx2+ cells. (I) Phalloidin label revealed 14 hair bundles (12 A to P and 1 P to A hair bundles, 1 at 90°). Z-stack projections show all HCs labeled with Myo7a (J) a single afferent fiber expressing tdTomato (K) and Emx2+ and Emx2- HCs (L). M–O Selected optical sections of (J–L) highlight a single afferent in a gpr156 mutants contacting individual Emx2+ HCs. Arrows in A and I indicate the orientation of the hair bundles in each example. Scale bar: 5 µm.
Figure 10.
Figure 10.. Grp156 was not required for pairing of pre- and post-synapses in lateral-line hair cells.
(A–C) Images neuromasts immunolabeled with Maguk and Ribeye b to stain HC post- and pre-synapses, respectively at 5 dpf. (A) Example of an immunostain of a control neuromast showing three complete synapses to the right. (B) Image of an emx2 mutant neuromast that shows complete synapses, as well as unpaired pre- and postsynapses, shown to the right. (C) Image of a gpr156 mutant neuromast, with complete synapses shown to the right. (D) Quantification revealed the same number of complete synapses per HC in emx2 and gpr156 mutants compared to controls. (E–F) In gpr156 mutants, quantification revealed there is no difference in the number of unpaired pre- or post-synapses per neuromast compared to controls. In emx2 mutants, there were significantly more pre- or post-synapses per neuromast compared to controls. SEM is shown in D–F. Scale bar = 5 µm, 0.5 µm for insets. Unpaired t-test were used to make comparisons. *p<0.05, ****p<0.0001.
Figure 11.
Figure 11.. Gpr156 mutant mice failed to swim and maintain their balance in water.
(A) Time taken to traverse the balance beam for control and Gpr156del/del mice. N is 33 and 30 for control (green) and Gpr156del/del (red) mice respectively. (B) Time taken to rescue an animal immediately after the animal exhibited underwater tumbling. N is 14 and 20 for control (green) and Gpr156del/del (red) mice respectively. ***p<0.001.
Figure 11—figure supplement 1.
Figure 11—figure supplement 1.. No resting head tremor was observed in Gpr156del/del mice.
Comparison of power spectra density of head movements at rest in translational axes and rotational axes between control and Gpr156del/del. N is 8 and 7 for control and Gpr156del/del mice, respectively. Error bars: SEM.
Figure 11—figure supplement 2.
Figure 11—figure supplement 2.. Gpr156del/del mice scored normally on several basic standard behavioral tests.
Comparison of assigned scores between Gpr156del/del and control mice show no impairment in (A) air righting, (B) contact inhibition, (C) tail hanging. N is 9 and 7 for control and Gpr156del/del mice respectively. Error bars: SEM.
Figure 12.
Figure 12.. VOR and OKR responses were normal but OVAR responses were altered in Gpr156del/delmice.
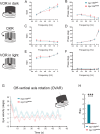
(A–B) VORd gain and phase (mean ± SEM) plotted as a function of frequency for control and Gpr156del/del mice. N is 8 and 7 for control (green) and Gpr156del/del KO (red) mice respectively. (C–D) OKR gain and phase (mean ± SEM) plotted as a function of frequency for control and Gpr156del/del mice. (E–F) VORl gain and phase (mean ± SEM) plotted as a function of frequency for control and Gpr156del/del mice. (G) Average eye velocities (mean ± SEM) during 72s-long off-vertical axis rotation for control and Gpr156del/del mice. N is 8 and 7 for control (green) and Gpr156-/- (red) mice respectively. (H) OVAR bias during the steady state (mean ± SEM) for control and Gpr156del/del mice. ***p<0.001.
Figure 12—figure supplement 1.
Figure 12—figure supplement 1.. VOR learning was unimpaired in Gpr156del/del mice.
(A) VORd gain (mean ± SEM) before and after the VOR gain-down training plotted as a function of frequency for control mice (N=7). (B) VORd gain (mean ± SEM) before and after the VOR gain-down training plotted as a function of frequency for Gpr156del/del mice (N=7). (C) Percent change in VOR gain for control and Gpr156del/del. *p<0.05, ***p<0.001.

Update of

Similar articles

References

    1. Beraneck M, Cullen KE. Activity of vestibular nuclei neurons during vestibular and optokinetic stimulation in the alert mouse. Journal of Neurophysiology. 2007;98:1549–1565. doi: 10.1152/jn.00590.2007. - DOI - PubMed
    1. Beraneck M, Bojados M, Le Séac’h A, Jamon M, Vidal P-P. Ontogeny of mouse vestibulo-ocular reflex following genetic or environmental alteration of gravity sensing. PLOS ONE. 2012;7:e40414. doi: 10.1371/journal.pone.0040414. - DOI - PMC - PubMed
    1. Chitnis AB, Nogare DD, Matsuda M. Building the posterior lateral line system in zebrafish. Developmental Neurobiology. 2012;72:234–255. doi: 10.1002/dneu.20962. - DOI - PMC - PubMed
    1. Chou SW, Chen Z, Zhu S, Davis RW, Hu J, Liu L, Fernando CA, Kindig K, Brown WC, Stepanyan R, McDermott BM., Jr A molecular basis for water motion detection by the mechanosensory lateral line of zebrafish. Nature Communications. 2017;8:2234. doi: 10.1038/s41467-017-01604-2. - DOI - PMC - PubMed
    1. Corns LF, Johnson SL, Kros CJ, Marcotti W. Calcium entry into stereocilia drives adaptation of the mechanoelectrical transducer current of mammalian cochlear hair cells. PNAS. 2014;111:14918–14923. doi: 10.1073/pnas.1409920111. - DOI - PMC - PubMed

MeSH terms

LinkOut - more resources