. 2024 Nov 12;135(1):e181342.
doi: 10.1172/JCI181342.

In utero human cytomegalovirus infection expands NK-like FcγRIII+CD8+ T cells that mediate Fc antibody functions

Affiliations

In utero human cytomegalovirus infection expands NK-like FcγRIII+CD8+ T cells that mediate Fc antibody functions

Eleanor C Semmes et al. J Clin Invest. .

Abstract

Human cytomegalovirus (HCMV) profoundly impacts host T and NK cells across the lifespan, yet how this common congenital infection modulates developing fetal immune cell compartments remains underexplored. Using cord blood from neonates with and without congenital HCMV (cCMV) infection, we identify an expansion of Fcγ receptor III-expressing (FcγRIII-expressing) CD8+ T cells following HCMV exposure in utero. Most FcγRIII+CD8+ T cells express the canonical αβ T cell receptor (TCR), but a proportion express noncanonical γδ TCR. FcγRIII+CD8+ T cells are highly differentiated and have increased expression of NK cell markers and cytolytic molecules. Transcriptional analysis reveals FcγRIII+CD8+ T cells upregulate T-bet and downregulate BCL11B, known transcription factors that govern T/NK cell fate. We show that FcγRIII+CD8+ T cells mediate antibody-dependent IFN-γ production and degranulation against IgG-opsonized target cells, similar to NK cell antibody-dependent cellular cytotoxicity (ADCC). FcγRIII+CD8+ T cell Fc effector functions were further enhanced by IL-15, as has been observed in neonatal NK cells. Our study reveals that FcγRIII+CD8+ T cells elicited in utero by HCMV infection can execute Fc-mediated effector functions bridging cellular and humoral immunity and may be a promising target for antibody-based therapeutics and vaccination in early life.

Keywords: Immunoglobulins; Immunology; Infectious disease; NK cells; T cells.


Figures

Figure 1
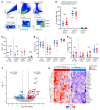
Figure 1. Cord blood donor phenotyping reveals distinct immune landscape in cCMV-infected versus uninfected neonates.
Flow cytometry phenotyping of umbilical cord blood from cCMV-infected (cCMV+, red circles, n = 59) and cCMV-uninfected (cCMV, blue triangles, n = 135) neonates was performed by the CCBB at the time of donation. (A) Case-control study overview. (BG) Frequencies and total immune cell counts (per cord blood collection unit) from CCBB cord blood phenotyping. (H and I) PCA of 18 immune cell parameters from CCBB phenotyping. (H) Scatterplot of PC1 and PC2. (I) Immune cell parameter loading variables ordered by magnitude of contribution to PC1 (positive loading variables shown in red due to clustering with cCMV+ samples, negative loading variables shown in blue due to clustering with cCMV samples). FDR-corrected P values for Mann-Whitney U test. *P < 0.05; ****P < 0.0001.
Figure 2
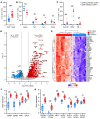
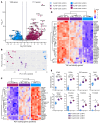
Figure 2. CD56negFcγRIII/CD16+ and NKG2C+ NK cells expand in cord blood from cCMV-infected neonates.
NK cell immunophenotypes and transcriptional profiles were compared in cord blood from cCMV-infected (cCMV+, red circles) versus cCMV-uninfected (cCMV, blue diamonds) neonates. (A) NK cell gating strategy. (B) Frequencies of NK cell subsets in cCMV+ (n = 21) versus cCMV (n = 20) neonates. (C) Frequency of total NK cells and NK cell subsets expressing CD57 in cCMV+ (n = 8) versus cCMV (n = 8) neonates. (D and E) Frequency of total NK cells and NK cell subsets expressing (D) NKG2A and (E) NKG2C in cCMV+ (n = 21) versus cCMV (n = 20) neonates. (F and G) RNA-Seq analysis of FAC-sorted NK cells from cCMV+ (n = 13) and cCMV (n = 12) neonates. (F) Volcano plot of differentially expressed genes (P < 0.01, log2foldchange +/– 1.2). Red circles indicate genes enriched in cCMV+, blue circles indicate genes enriched in cCMV. (G) Heatmap of top 23 enriched genes (FDR P < 0.1, log2foldchange > 1.2). z score shows gene expression based on rlog-transformed data. FDR-corrected P values for Mann-Whitney U test. *P < 0.05, ***P < 0.001.
Figure 3
Figure 3. CD8+ T cells upregulate cytotoxicity and NK cell genes in cord blood from cCMV-infected neonates.
(A and B) CD8+ T cell immunophenotypes were compared in cord blood from cCMV-infected (cCMV+, red circles, n = 21) versus cCMV-uninfected (cCMV, blue diamonds, n = 20) neonates. (A and B) Frequency of total, naive, Tcm, Tem, and Temra CD8+ T cells. (C) Frequency of CD8+ T cells expressing HLA-DR, CD57, and PD-1 in cCMV+ (n = 8) versus cCMV (n = 8) neonates. (DG) RNA-Seq analysis of FAC-sorted total CD8+ T cells from cCMV+ (n = 13) and cCMV (n = 11) neonates. (D) Volcano plot demonstrating differentially expressed genes (P < 0.01, log2foldchange +/– 1.2). Red circles indicate genes enriched in cCMV+, blue circles indicate genes enriched in cCMV, and gray circles indicate genes whose expression did not differ significantly. (E) Heatmap of top 40 enriched genes (FDR P < 0.1, log2foldchange > 3.0). (F and G) Expression of genes encoding (F) cytolytic molecules and (G) NK-associated cell markers. z score shows gene expression based on rlog-transformed data. FDR-corrected P values for Mann-Whitney U test. *P < 0.05; **P < 0.01; ***P < 0.001.
Figure 4
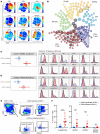
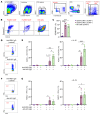
Figure 4. CD8+ T cells expressing NK cell receptors FcγRIII and NKG2A/C expand in cord blood from cCMV-infected neonates.
(AD) CITRUS analysis of flow cytometry data was used to identify immune cell populations with differing abundance in cord blood from cCMV-infected (n = 13) versus cCMV-uninfected (n = 12) neonates. (A) t-SNE-CUDA dimensionality reduction of flow cytometry data prior to CITRUS. (B) CITRUS cluster map with black outlines and shaded areas indicating clusters that differed significantly (FDR P < 0.01) between cCMV+ and cCMV groups. Clusters colored by CD8+ T cells (purple), CD4+ T cells (red), NK cells (green), B cells (yellow), monocytes/macrophages (MO/Mϕ; orange) and dendritic cells (DCs; blue) based on marker expression (General Lineage CITRUS in the Supplemental Material). (C and D) Select clusters (black arrows in panel B) of CD8+ T cells expressing NK cell markers. Dot plots indicate cluster abundance in cCMV+ (red circles) versus cCMV (blue circles) neonates. Histograms indicate fluorescent marker expression of select cluster (pink) relative to background (blue). (E) Gating strategy to identify CD8+ T cells expressing NK cell markers. (F) Frequency of FcγRIII and NKG2A/C expression on CD8+ T cells from cCMV+ (red circles, n = 21) versus cCMV (blue diamonds, n = 20) neonates. FDR-corrected P values for Mann-Whitney U test. ***P < 0.001.
Figure 5
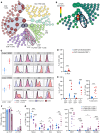
Figure 5. FcγRIII+ CD8+ T cells include canonical αβ and unconventional γδ T cell populations.
(AG) Immunophenotypes in cord blood from cCMV-infected (n = 8, circles) versus uninfected (n = 8, diamonds) neonates. (A and B) CITRUS cluster map with gray outlines and shaded areas indicating immune cell clusters that differed significantly (FDR P < 0.01) between groups. Clusters colored by CD8+ T cells (purple, plum shade for increased FcγRIII expression), CD4+ T cells (red), NK cells (green), and non-T/NK cells (yellow, aqua) based on marker expression (NK T CITRUS in the Supplemental Material). (B) Expression of γδ TCR with black outlines showing FcγRIII+ CD8+ T cell clusters. (C) FcγRIII+ CD8+ T cell clusters (arrows in panel A). Dot plots indicate cluster abundance in cord blood from cCMV+ (red) versus cCMV (blue) neonates. Histograms indicate fluorescent marker expression of select cluster (pink) relative to background (blue). (D and E) γδ T cells in cord blood from cCMV+ (red) versus cCMV (blue) neonates. (D) Frequency of total γδ T cells and (E) γδ T cells expressing CD8/CD4 and FcγRIII. (F) Expression of αβ and γδ TCR and (G) differentiation/functional markers (F) on FcγRIII (cCMV+ purple; cCMV blue) and FcγRIII+ (plum) CD8+ T cells. FDR-corrected P values for Mann-Whitney U test (D and E) and ANOVA followed by Tukey’s post hoc test (F and G). *P < 0.05; **P < 0.01; ***P < 0.001; ****P < 0.0001.
Figure 6
Figure 6. FcγRIII+ CD8+ T cells in cord blood from cCMV-infected neonates upregulate NK cell identity genes.
(AE) Transcriptome analysis of FAC-sorted FcγRIII+ and FcγRIII CD8+ T cells from cCMV-infected (n = 8) and cCMV-uninfected (n = 7) neonates. (A) Volcano plot of differentially expressed genes in FcγRIII+ versus FcγRIIICD8+ T cells (P < 0.01, log2foldchange +/– 1.2). Plum circles indicate genes enriched in FcγRIII+CD8+ T cells (cCMV+ only), blue circles indicate genes enriched in FcγRIIICD8+ T cells (cCMV only). (B) PCA of top 500 differentially expressed genes in FcγRIII+ versus FcγRIIICD8+ T cells. (C) Heatmap of top 25 PC1 loading genes (panel B). (D) Heatmap of NK cell identity genes. (E) Cytotoxicity and FcγR gene expression levels. z score shows gene expression based on rlog-transformed data. FDR-corrected P values for ANOVA followed by Tukey’s post hoc test. *P < 0.05; **P < 0.01; ***P < 0.001; ****P < 0.0001.
Figure 7
Figure 7. TFs expressed by FcγRIII+CD8+ T cells suggest shift from T to NK identity.
(AD) RNA-Seq analysis of TF expression from FAC-sorted FcγRIII+CD8+ T cells (n = 8, plum), FcγRIIICD8+ T cells (n = 8, dark purple), and NK cells (n = 13, green) in cord blood from cCMV-infected neonates. (A and B) Heatmap and volcano plot showing top downregulated (left) and upregulated (right) TFs (FDR P <0.05, log2foldchange +/– 1.2) in FcγRIII+ versus FcγRIIICD8+ T cells. (B) Volcano plot of all differentially expressed genes with TFs labeled. (C) PCA of top 500 differentially expressed genes in CD8+ T and NK cells. (D) Boxplots show normalized gene expression levels of TFs. z score shows gene expression based on rlog-transformed data.
Figure 8
Figure 8. Cord blood FcγRIII+ CD8+ T cells and NK cells mediate ADCC functions.
(AG) Degranulation (CD107a positivity) and IFN-γ production following antibody stimulation with anti-RSV IgG (nonspecific antibody) or anti-HIV IgG (target cell specific antibody) were measured as markers of ADCC in cord blood from cCMV-infected (n = 5) and cCMV-uninfected (n = 5, Supplemental Figure 9) in 2 independent experiments. (A) Gating strategy to identify NK cells and CD8+ T cells with and without FcγRIII expression. (B) Gating strategy for granzyme B and PRF1 expression. (C) Percent of population coexpressing granzyme B and PRF1. (DG) ADCC activity in FcγRIIICD8+ T cells (dark purple), FcγRIII+CD8+ T cells (plum), and NK cells (light green) from cCMV-infected infants. (D and E) T cell and NK degranulation (CD107a positivity) following antibody stimulation with and without IL-15 pretreatment. (F and G) T cell and NK IFN-γ production following antibody stimulation with and without IL-15 pretreatment. FDR-corrected P values for ANOVA followed by Tukey’s post hoc test. *P < 0.05; **P < 0.01; ***P < 0.001; ****P < 0.0001.

Update of

References

    1. Cadwell K. The virome in host health and disease. Immunity. 2015;42(5):805–813. doi: 10.1016/j.immuni.2015.05.003. - DOI - PMC - PubMed
    1. Davis MM, Brodin P. Rebooting human immunology. Annu Rev Immunol. 2018;36:843–864. doi: 10.1146/annurev-immunol-042617-053206. - DOI - PMC - PubMed
    1. Zuhair M, et al. Estimation of the worldwide seroprevalence of cytomegalovirus: a systematic review and meta-analysis. Rev Med Virol. 2019;29(3):e2034. doi: 10.1002/rmv.2034. - DOI - PubMed
    1. Brodin P, et al. Variation in the human immune system is largely driven by non-heritable influences. Cell. 2015;160(1–2):37–47. doi: 10.1016/j.cell.2014.12.020. - DOI - PMC - PubMed
    1. Semmes EC, et al. Cytomegalovirus as an immunomodulator across the lifespan. Curr Opin Virol. 2020;44:112–120. doi: 10.1016/j.coviro.2020.07.013. - DOI - PMC - PubMed

MeSH terms