. 2024 Nov 12;135(1):e182939.
doi: 10.1172/JCI182939.

Inflammatory crosstalk impairs phagocytic receptors and aggravates atherosclerosis in clonal hematopoiesis in mice

Affiliations

Inflammatory crosstalk impairs phagocytic receptors and aggravates atherosclerosis in clonal hematopoiesis in mice

Wenli Liu et al. J Clin Invest. .

Abstract

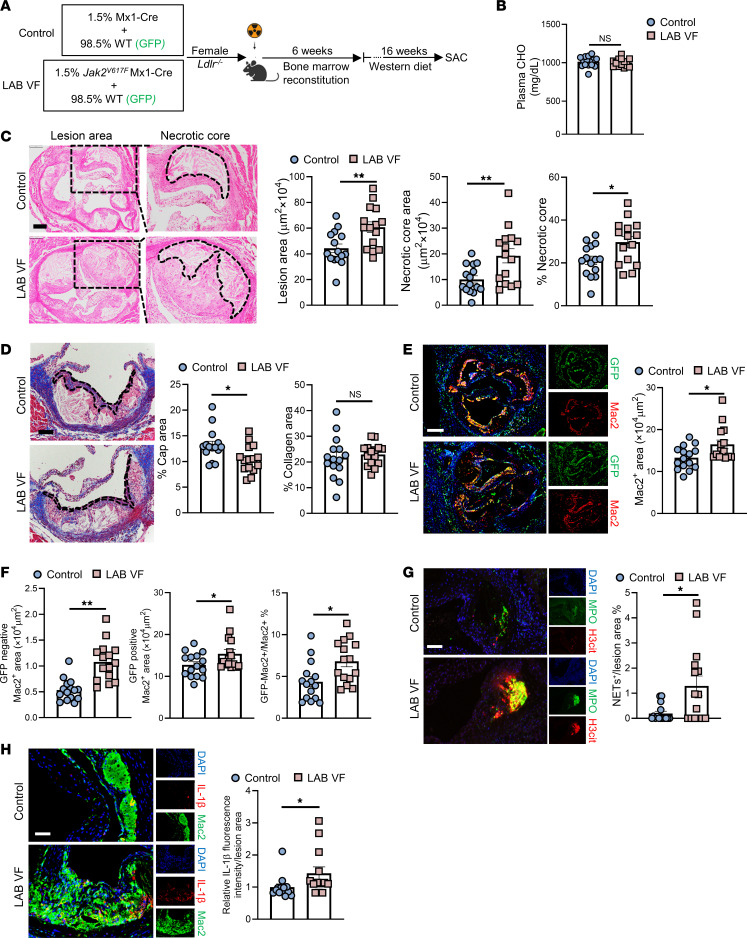
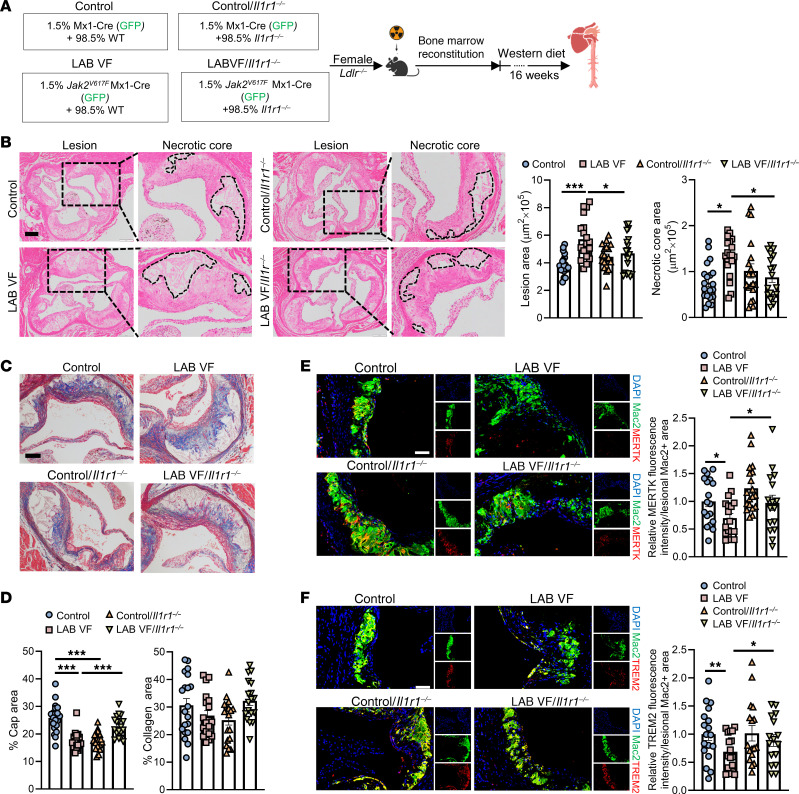
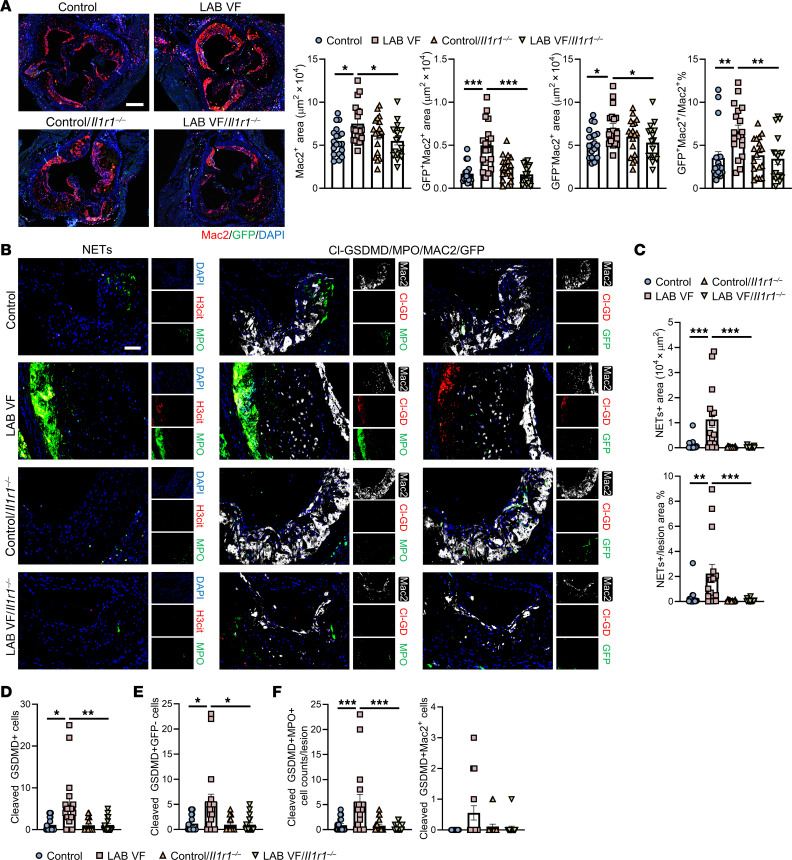
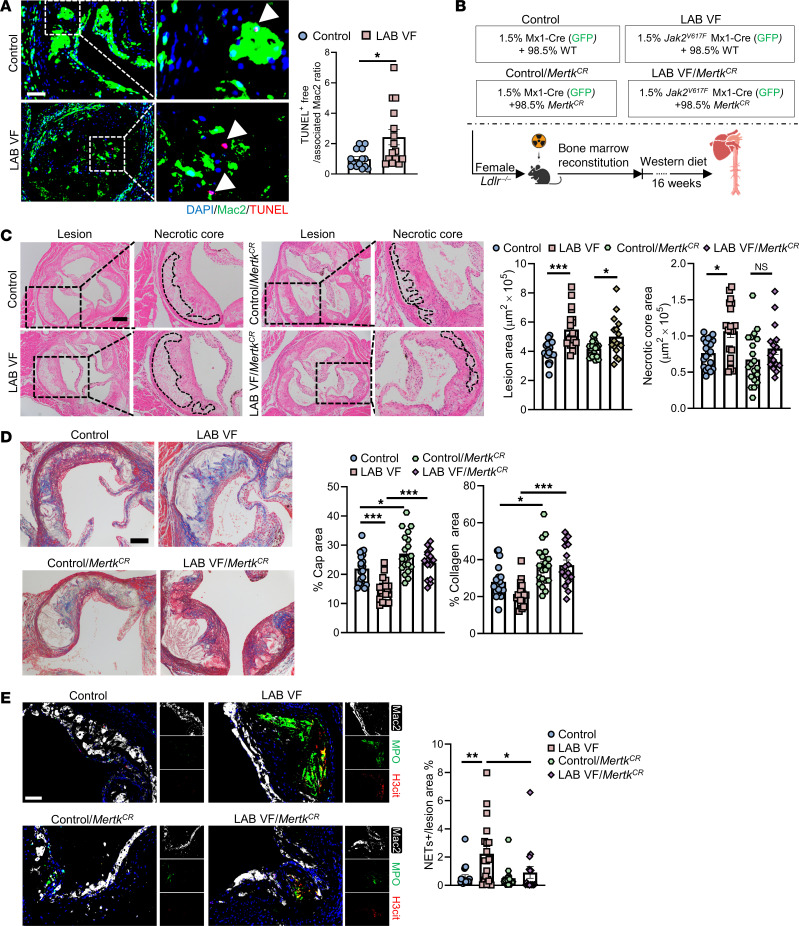
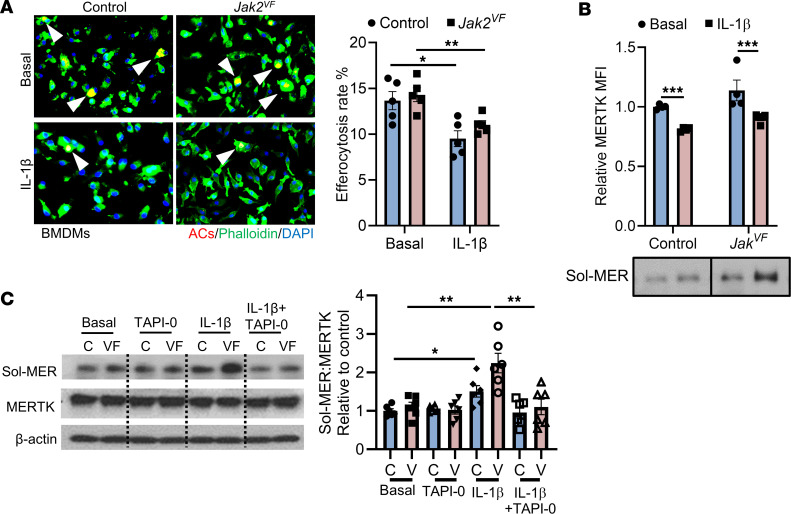
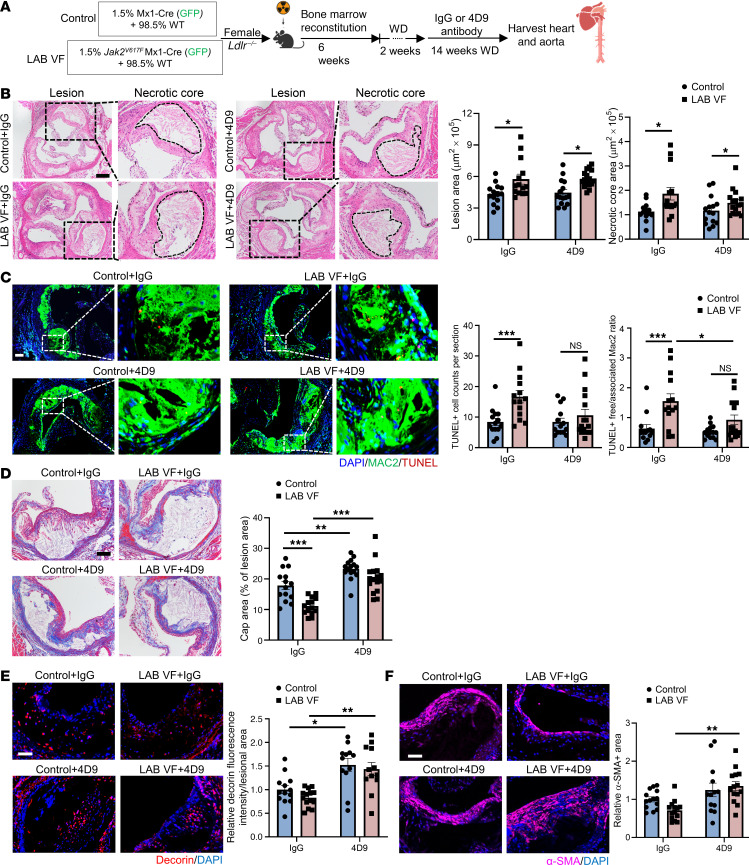
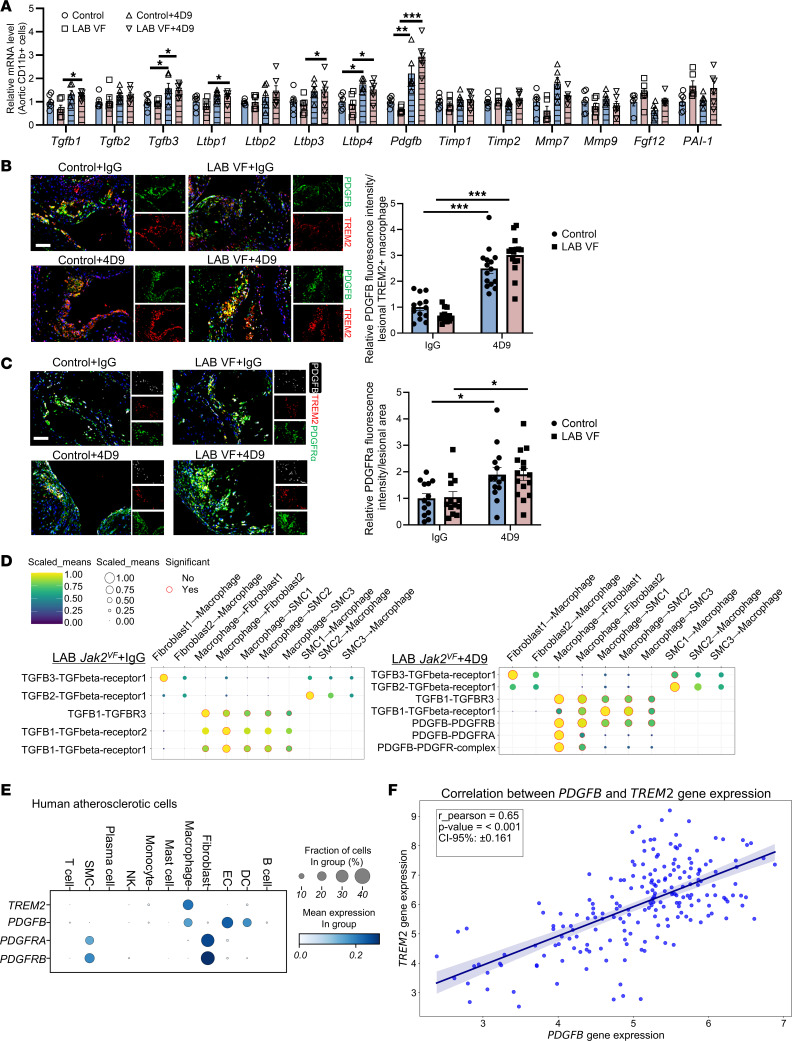
Clonal hematopoiesis (CH) increases inflammasome-linked atherosclerosis, but the mechanisms by which CH mutant cells transmit inflammatory signals to nonmutant cells are largely unknown. To address this question, we transplanted 1.5% Jak2V617F (Jak2VF) bone marrow (BM) cells with 98.5% WT BM cells into hyperlipidemic Ldlr-/- mice. Low-allele-burden (LAB) mice showed accelerated atherosclerosis with increased features of plaque instability, decreased levels of the macrophage phagocytic receptors c-Mer tyrosine kinase (MERTK) and triggering receptor expressed on myeloid cells 2 (TREM2), and increased neutrophil extracellular traps (NETs). These changes were reversed when Jak2VF BM was transplanted with Il1r1-/- BM. LAB mice with noncleavable MERTK in WT BM showed improvements in necrotic core and fibrous cap formation and reduced NETs. An agonistic TREM2 antibody (4D9) markedly increased fibrous caps in both control and LAB mice, eliminating the difference between the groups. Mechanistically, 4D9 increased TREM2+PDGFB+ macrophages and PDGF receptor-α+ fibroblast-like cells in the cap region. TREM2 and PDGFB mRNA levels were positively correlated in human carotid plaques and coexpressed in macrophages. In summary, low frequencies of Jak2VF mutations promoted atherosclerosis via IL-1 signaling from Jak2VF to WT macrophages and neutrophils, promoting cleavage of phagocytic receptors and features of plaque instability. Therapeutic approaches that stabilize MERTK or TREM2 could promote plaque stabilization, especially in CH- and inflammasome-driven atherosclerosis.

Keywords: Atherosclerosis; Vascular biology.


Conflict of interest statement

Conflict of interest: ART is a consultant for CSL Behring and is on the scientific advisory board of Staten Biotech and Beren Therapeutics. CH and KS collaborate with Denali Therapeutics on the generation and characterization of TREM2 agonistic antibodies. CH has a cooperation contract with Denali involving the generation of agonistic TREM2 antibodies, as well as analysis of their mechanisms of action. He is not an advisor of Denali and he does not receive any personal salary. He also does not own any stocks in Denali. CH and KS received inventor royalties from DZNE for codeveloping 4D9. CH and KS are listed as inventors on pending TREM2 patents for which they have not received any payments. CH is a member of the advisory board of AviadoBio and Cure Ventures.

Figures

Figure 1
Figure 1. Accelerated atherogenesis and plaque instability in LAB Jak2VF CH mice.
(A) Experimental design. (B) Plasma cholesterol (CHO) levels. (C) Representative H&E staining and quantification of the lesion and necrotic core areas in aortic root sections. Necrotic core regions are indicated by dotted lines. Scale bar: 200 μm. Original magnification, ×100. (D) Aortic root sections were stained with Masson’s trichrome for the fibrous cap (outlined by dashed lines) and collagen content area and then quantified as the ratio of the total lesion area. Scale bar: 100 μm. (E and F) Representative immunofluorescence staining of macrophages (anti-Mac2) and GFP and quantification of the absolute Mac2+ area, the GFPMac2+ (Mx1-Cre or Jak2VF macrophages) area, and the GFP+Mac2+ area (WT macrophages), as well as the GFPMac2+ area as the percentage of the total Mac2+ area in aortic root sections. Scale bar: 250 μm. Original magnification, ×50. (G) Representative immunofluorescence staining for H3cit and MPO and quantification of the double-positive area (NETosis) as a percentage of the lesion area. Scale bar: 200 μm. Original magnification, ×200. (H) Representative immunofluorescence staining for IL-1β and anti-Mac2 (macrophages) and quantification of the fluorescence intensity of IL-1β were performed and normalized to the lesion area. Scale bar: 50 μm. Original magnification, ×100. Data are presented as the mean ± SEM. n = 15 (BG), n = 13 (H). *P < 0.05 and **P < 0.01, by unpaired, 2-tailed Student’s t test.
Figure 2
Figure 2. Accelerated atherogenesis in LAB mice is reversed by IL-1R1 deficiency in non-Jak2VF cells.
(A) Experimental design. (B) Representative H&E staining and quantification of the lesion and necrotic core areas in aortic root sections. Necrotic core regions are indicated by dashed lines. Scale bar: 200 μm. Original magnification, ×100. (C and D) Aortic root sections were stained with Masson’s trichrome for the fibrous cap and collagen content area and quantified as the ratio of total lesion area. Scale bar: 100 μm. Original magnification, ×200. (E and F) Representative immunofluorescence staining for MERTK (E) or TREM2 (F) and anti-Mac2 (macrophages). The fluorescence intensity of MERTK (E) and TREM2 (F) was quantified and normalized by the lesional macrophage area. Scale bars: 50 μm. Original magnification, ×200. Data are presented as the mean ± SEM. n = 20 (control), n = 19 (LAB VF), n = 19 (control/II1r–/–), n = 18 (LAB VF/II1r–/–) (B and D); n = 18 (control), n = 18 (LAB VF), n = 19 (control/II1r–/–), n = 16 (LAB VF/II1r–/–) (E); n = 18 (control), n = 17 (LAB VF),n = 17 ( control/II1r–/–), n = 16 (LAB VF/II1r–/–) (F). *P < 0.05, **P < 0.01, and ***P < 0.001, by 2-way ANOVA.
Figure 3
Figure 3. Increased macrophage infiltration, NETosis, and neutrophil inflammasome activation in lesions of LAB mice, all of which are reversed by IL-1R deficiency in non-Jak2VF cells.
(A) Representative immunofluorescence staining for anti-Mac2 (macrophages) and GFP, and quantification of the absolute Mac2+ area, GFP+Mac2+ (Mx1-Cre or Jak2VF macrophages) area, GFPMac2+ area, and GFP+Mac2+ area as the percentage of the total Mac2+ area in aortic root sections. Scale bar: 250 μm. Original magnification, ×50. (B) Representative immunofluorescence staining for H3cit and MPO (NETosis), cleaved gasdermin D, anti-MPO (neutrophils), anti-Mac2 (macrophages), and GFP in the lesions. Scale bar: 100 μm. Original magnification, ×50. (C) Quantification of absolute area of NETosis+ area and as the percentage of the lesion area. (D) Quantification of cleaved GSDMD+ cell counts in the aortic root lesions. (E) Quantification of cleaved-GSDMD+GFP cell counts in the aortic root lesions. (F) Quantification of cleaved-GSDMD+MPO+ or Mac2+ cell counts in the aortic root lesions. Data are presented as the mean ± SEM. n = 19 (control), n = 18 (LAB VF), n=18 (control/II1r–/–), n = 17 (LAB VF/II1r–/–) (A); n = 18 (control), n = 15 (LAB VF), n = 16 (control/II1r–/–), n = 17 (LAB VF/II1r–/–) (C); n = 18 (control), n = 18 (LAB VF), n = 18 (control/II1r–/–), n = 16 (LAB VF/II1r–/–) (D and E); n = 18 mice per group (F). *P < 0.05, **P < 0.01, and ***P < 0.001, by 2-way ANOVA.
Figure 4
Figure 4. Presence of MertkCR cells alleviates plaque necrosis in LAB mice.
(A) Staining of macrophages, TUNEL and quantification of efferocytosis (ratio of TUNEL+-free cells to macrophage-associated TUNEL+ cells) in aortic root sections. Arrowheads show TUNEL+ cells. Scale bar: 50 μm. Original magnification, ×200 (enlarged insets). (B) Experimental design. (C) Representative H&E staining and quantification of the lesion area and necrotic core area in aortic root sections. Necrotic core regions are indicated by dashed lines. Scale bar: 200 μm. Original magnification, ×100 (enlarged insets). (D) Aortic root sections were stained with Masson’s trichrome for the fibrous cap and collagen content area and quantified as the ratio of the total lesion area. Scale bar: 100 μm. Original magnification, ×200 (enlarged insets). (E) Representative immunofluorescence staining for H3cit, MPO (NETosis), and Mac2 and quantification of the ratio of the double-positive area (NETs) area to the lesion area. Scale bar: 50 μm. Original magnification, ×200. *P < 0.05, **P < 0.01, and ***P < 0.001, by 2-way ANOVA. Data are presented as mean ± SEM. n =14 (control), n = 15 (LAB VF) (A); n = 20 (control), n = 19 (LAB VF), n = 20 (control/MertkCR), n = 16 (LAB VF/MertkCR) (C and D); n = 20 (control), n = 19 (LAB VF), n = 19 (control/MertkCR), n = 16 (LAB VF/MertkCR) (E). *P < 0.05, **P < 0.01, and ***P < 0.001, by unpaired, 2-tailed Student’s t test (A) or 2-way ANOVA (C and E).
Figure 5
Figure 5. IL-1β promotes MERTK cleavage through activation of P38/ADAM17 signaling.
(A) BMDMs from Mx1-Cre (control) and Jak2VF mice were pretreated or not with IL-1β (25 ng/mL) for 6 hours and then incubated with PKH26-labeled ACs (red) for 45 minutes at a 5:1 AC/macrophage ratio. Phalloidin (green) was used to label F-actin in cells. Bar graph shows quantification of the efferocytosis of macrophages (arrowheads) relative to the percentage of total macrophages. n = 5 independent experiments. (B) BMDMs from Mx1-Cre (control [C]) and Jak2VF (VF) mice were treated with or not with IL-1β (25 ng/mL) for 6 hours, followed by assays for cell-surface MERTK by flow cytometry and soluble MERTK (Sol-MER) levels in culture media by Western blotting (the lanes were run on the same gel but were noncontiguous). n = 4 independent experiments. (C) BMDMs were treated or not with the ADAM17 inhibitor TAPI-0 (5 μM) or IL-1β (25 ng/mL) for 6 hours and then assayed for cellular MERTK and soluble MERTK in culture media by Western blotting. n = 6 independent experiments. Data are presented as the mean ± SEM. *P < 0.05, **P < 0.01, and ***P < 0.001, by 2-way ANOVA.
Figure 6
Figure 6. The TREM2 activating antibody 4D9 enhances plaque stability by increasing the thickness of fibrous caps.
(A) Experimental design. (B) Representative H&E staining and quantification of the lesion area and necrotic core area in aortic root sections. Necrotic core regions are indicated by dashed lines. Scale bar: 200 μm. Original magnification, ×100 (enlarged insets). (C) Staining of macrophages and for TUNEL and quantification of efferocytosis (ratio of TUNEL+-free cells to macrophage-associated TUNEL+ cells) in aortic root sections. Scale bar: 50 μm. Original magnification, ×100 (enlarged insets). (D) Aortic root sections were stained with Masson’s trichrome for the fibrous cap and quantified as the ratio of the total lesion area. Scale bar: 75 μm. Original magnification, ×200 (enlarged insets). (E) Representative immunofluorescence staining for decorin and quantification of the fluorescence intensity of decorin were performed and normalized to the lesion area. Scale bar: 50 μm. Original magnification, ×200 (enlarged insets). (F) Immunofluorescence staining for α-SMA and quantification of the relative α-SMA+ area in lesions. Scale bar: 50 μm. Data are presented as the mean ± SEM. n = 14 (control+IgG), n = 14 (LAB VF+IgG), : n = 15 (control+4D9), n = 1 (LAB VF+4D9) (B and D); n = 13 (control+IgG), n = 12 (LAB VF+IgG), n = 14 (control+4D9), n = 12 (LAB VF+4D9) (E); n = 14 (control+IgG), n = 13 (LAB VF+IgG), n = 14 (control+4D9), n = 14 (LAB VF+4D9) (F). *P < 0.05, **P < 0.01, and ***P < 0.001, by 2-way ANOVA.
Figure 7
Figure 7. 4D9-mediated TREM2 activation promotes fibrogenesis through macrophage Pdgfb–fibroblast Pdgfra crosstalk.
(A) Relative mRNA of fibrogenic genes in isolated aortic CD11b+ cells in mice. n = 6, each replicate represents pooled digested aortic cells from 2–3 mice. (B) Representative immunofluorescence staining for PDGFB, TREM2, and anti-Mac2 (macrophages). The fluorescence intensity of PDGFB was quantified and normalized by the lesional TREM2+ macrophage area. Scale bar: 50 μm. Original magnification, ×200 (enlarged insets). (C) Representative immunofluorescence staining for TREM2, PDGFB, and PDGFRa. The fluorescence intensity of PDGFRa was quantified and normalized by the lesion area. Scale bar: 50 μm. Original magnification, ×200 (enlarged insets). (D) Dot plot of ligand-receptor interactions between macrophage and SMC/fibroblast subpopulations. Ligand and cognate receptors are shown on the y axis. Circle size denotes the P value (permutation test); color (yellow, high; blue, low) denotes the average ligand and receptor expression levels in interacting subpopulations. (E) scRNA-Seq analysis of human atherosclerotic tissue shows the distribution of TREM2, PDGFB, PDGFRA, and PDGFRB transcripts in all major vascular cell types. (F) Pearson’s correlation analysis was performed on 202 atherosclerotic tissue samples and shows the correlation between TREM2 and PDGFB. Data are presented as the mean ± SEM. n = 13 (control+IgG), n = 13 (LAB VF+IgG), n = 14 (control+4D9), n = 15 (LAB VF+4D9) (B and C). *P < 0.05 and ***P < 0.001, by 2-way ANOVA (A and C).

Comment in

  • Clonal hematopoiesis JAKs up plaque formation

References

    1. Heron M. Deaths: Leading Causes for 2015. Natl Vital Stat Rep. 2017;66(5):1–76. - PubMed
    1. Vallejo-Vaz AJ, et al. Triglyceride-rich lipoprotein cholesterol and risk of cardiovascular events among patients receiving statin therapy in the TNT trial. Circulation. 2018;138(8):770–781. doi: 10.1161/CIRCULATIONAHA.117.032318. - DOI - PubMed
    1. Cannon CP, et al. Ezetimibe added to statin therapy after acute coronary syndromes. N Engl J Med. 2015;372(25):2387–2397. doi: 10.1056/NEJMoa1410489. - DOI - PubMed
    1. Sabatine MS, et al. Evolocumab and clinical outcomes in patients with cardiovascular disease. N Engl J Med. 2017;376(18):1713–1722. doi: 10.1056/NEJMoa1615664. - DOI - PubMed
    1. Ridker PM, et al. Antiinflammatory therapy with canakinumab for atherosclerotic disease. N Engl J Med. 2017;377(12):1119–1131. doi: 10.1056/NEJMoa1707914. - DOI - PubMed

MeSH terms

LinkOut - more resources