. 2024 Dec 20;9(24):e158127.
doi: 10.1172/jci.insight.158127.

Sphingosine 1-phosphate receptor 1signaling in macrophages reduces atherosclerosis in LDL receptor-deficient mice

Affiliations

Sphingosine 1-phosphate receptor 1signaling in macrophages reduces atherosclerosis in LDL receptor-deficient mice

Francesco Potì et al. JCI Insight. .

Abstract

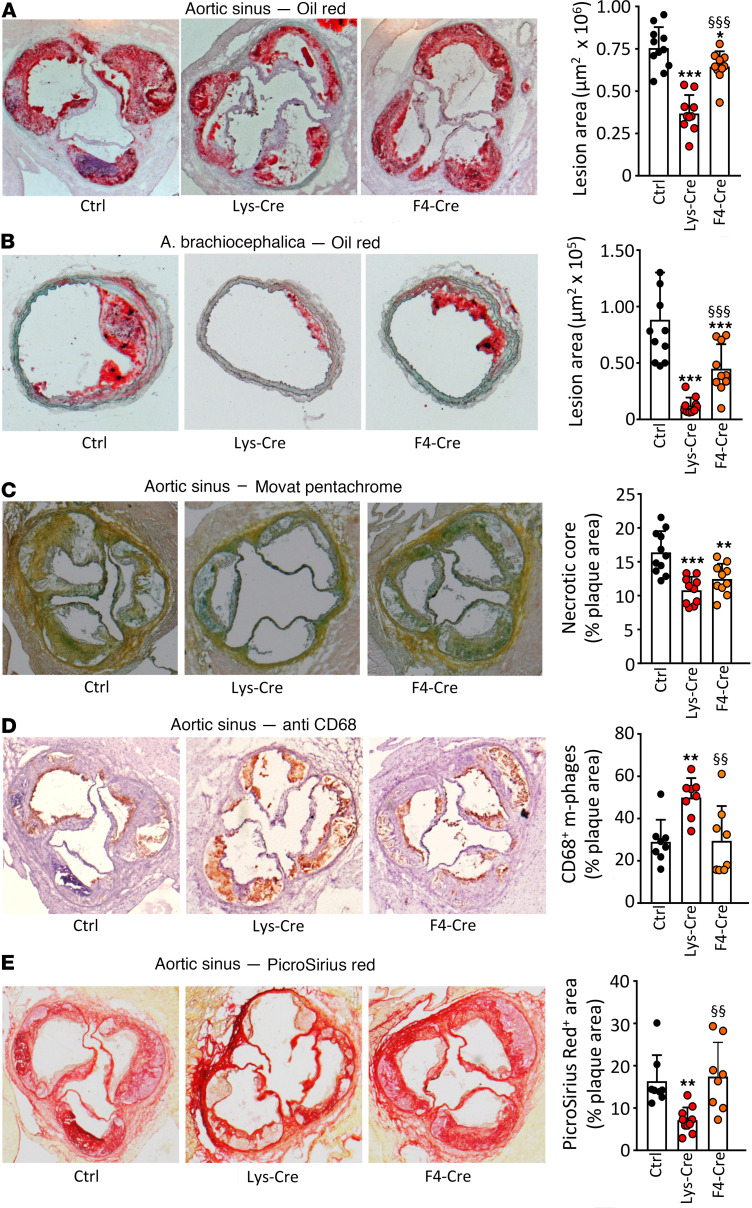
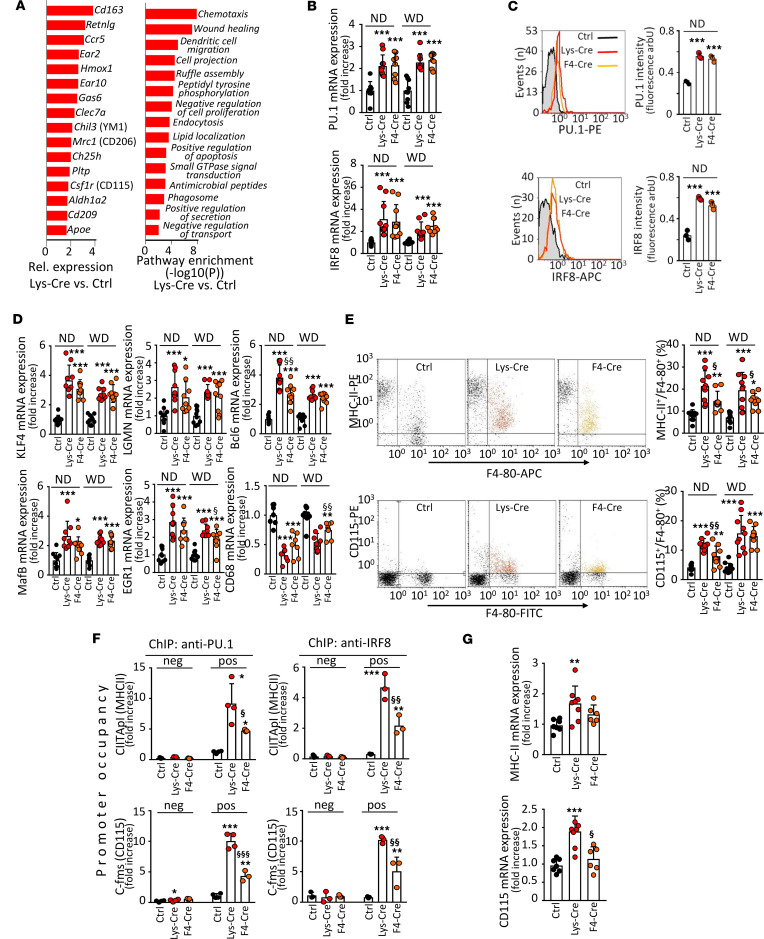
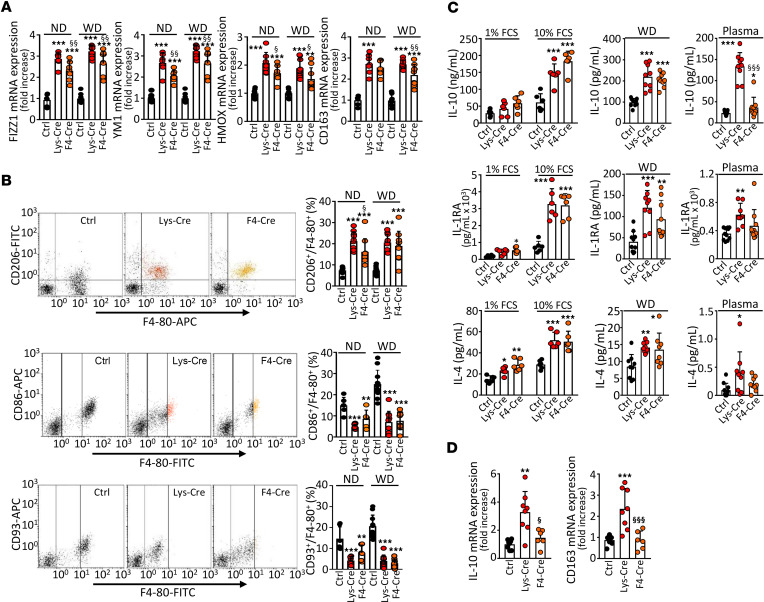
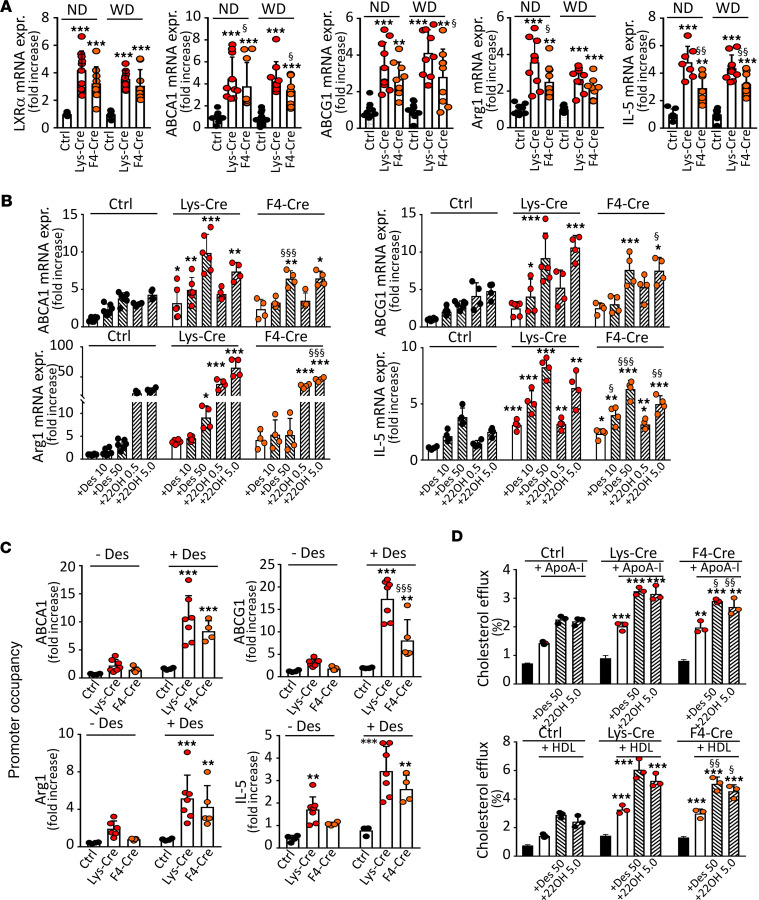
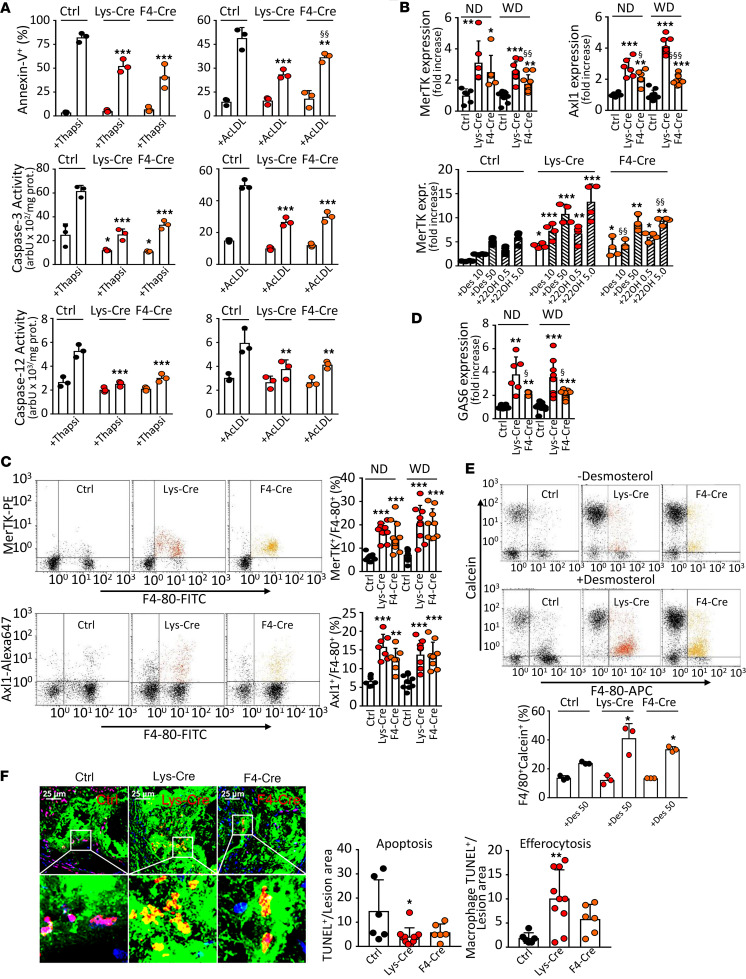
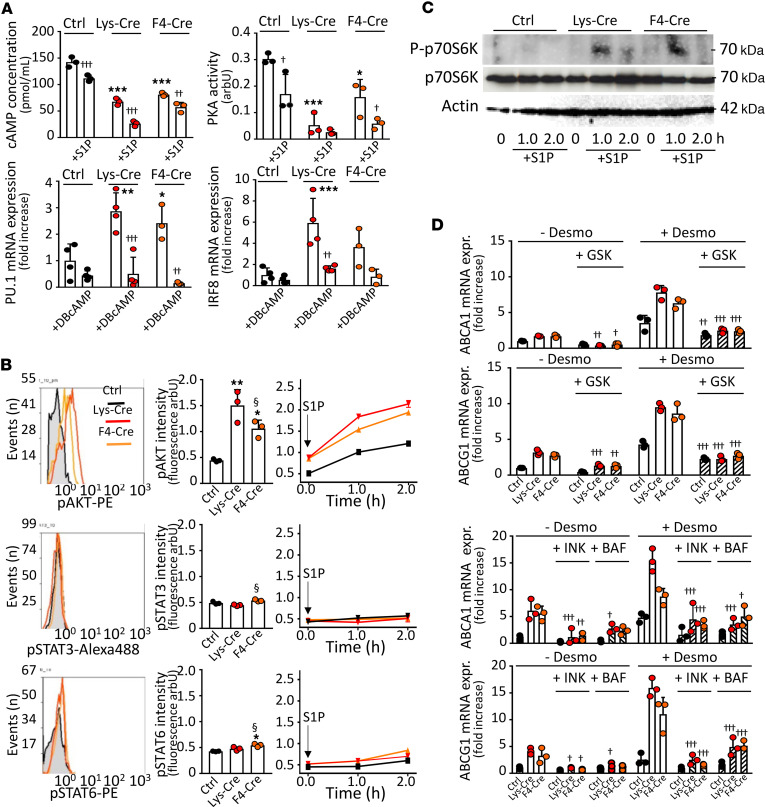
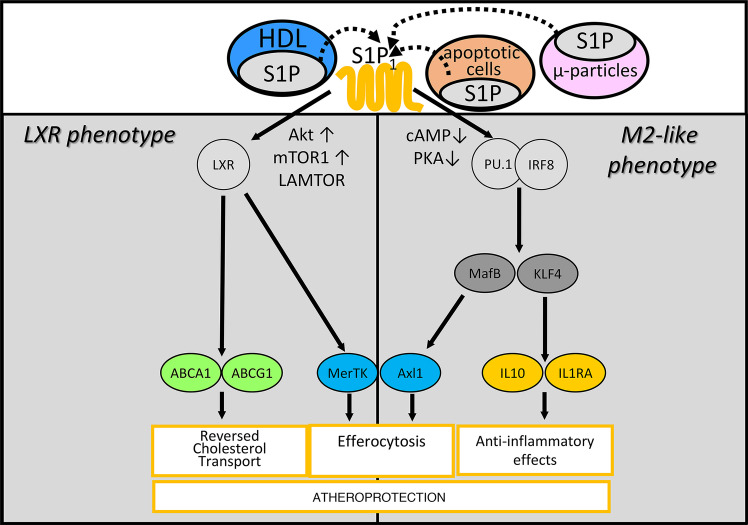
Sphingosine 1-phosphate (S1P) is a lysosphingolipid with antiatherogenic properties, but mechanisms underlying its effects remain unclear. We here investigated atherosclerosis development in cholesterol-rich diet-fed LDL receptor-deficient mice with high or low overexpression levels of S1P receptor 1 (S1P1) in macrophages. S1P1-overexpressing macrophages showed increased activity of transcription factors PU.1, interferon regulatory factor 8 (IRF8), and liver X receptor (LXR) and were skewed toward an M2-distinct phenotype characterized by enhanced production of IL-10, IL-1RA, and IL-5; increased ATP-binding cassette transporter A1- and G1-dependent cholesterol efflux; increased expression of MerTK and efferocytosis; and reduced apoptosis due to elevated B cell lymphoma 6 and Maf bZIP B. A similar macrophage phenotype was observed in mice administered S1P1-selective agonist KRP203. Mechanistically, the enhanced PU.1, IRF8, and LXR activity in S1P1-overexpressing macrophages led to downregulation of the cAMP-dependent PKA and activation of the signaling cascade encompassing protein kinases AKT and mTOR complex 1 as well as the late endosomal/lysosomal adaptor MAPK and mTOR activator 1. Atherosclerotic lesions in aortic roots and brachiocephalic arteries were profoundly or moderately reduced in mice with high and low S1P1 overexpression in macrophages, respectively. We conclude that S1P1 signaling polarizes macrophages toward an antiatherogenic functional phenotype and countervails the development of atherosclerosis in mice.

Keywords: Atherosclerosis; Inflammation; Lipoproteins; Macrophages; Vascular biology.


Figures

Figure 1
Figure 1. S1P1 overexpression in macrophages and monocytes retards atherosclerotic lesion development and alters plaque morphology in Ldlr–/– mice.
Aortic root (A and CE) and brachiocephalic arteries (B) from WD-fed Ldlr–/– mice transplanted with S1pr1-KI (Ctrl, n = 11), S1pr1-LysMCre (Lys-Cre, n = 10), or S1pr1-F4/80Cre (F4-Cre, n = 10) BM were used for morphometry (A and B) or stained for necrotic core analysis (Movat pentachrome, C), macrophages (anti-CD68, D), or collagen (Picrosirius red, E). Bar graphs show the necrotic core extent or the macrophage or collagen content in plaques expressed as the percentage of lesion area. * - P < 0.05, ** - P < 0.01, *** - P < 0.001 (Lys-Cre vs. Ctrl or F4-Cre vs. Ctrl), §§ - P < 0.01, §§§ - P < 0.001 (Lys-Cre vs. F4-Cre, 1-way ANOVA except B: Kruskal-Wallis h test).
Figure 2
Figure 2. S1P1 overexpression in macrophages enhances expression and activation of PU.1 and interferon regulatory factor-8.
PMs from either S1pr1-KI (Ctrl, n = 7–10), S1pr1-LysMCre (Lys-Cre, n = 7–10), or S1pr1-F4/80Cre (F4-Cre, n = 7–10) on normal diet (ND) or Ldlr–/– mice transplanted with S1pr1-KI (n = 10), S1pr1-LysMCre (n = 9), or S1pr1-F4/80Cre (n = 9) BM on WD. (A) Gene expression in PMs from Lys-Cre and Ctrl mice (n = 3–4 for each group) assessed with microarrays. Left panel: expression pattern showing elevated genes controlled by PU.1/interferon regulatory factor-8 (IRF8) (colony-stimulating factor-1 receptor [Csf1r], Clec7a, Mrc1) and liver X receptor (LXR) (phospholipid transfer protein [Pltp], Ch25h, Apoe) in S1pr1-LysMCre mice. Right panel: enrichment analysis of upregulated transcripts in S1pr1-LysMCre mice. Chil3, chitinase 3-like; Hmox, heme oxygenase. (B) Pu1 and Irf8 expression by quantitative PCR (qPCR). mRNA normalized to Gapdh and shown relative to S1pr1-KI. (C) Intracellular stainings for PU.1 (top panels) and IRF8 (bottom panels) analyzed by flow cytometry (n = 3 for each group). (D) qPCR of PU.1 and IRF8 signature genes. (E) CD115 and MHC-II analyzed by flow cytometry. (F) PU.1 and IRF8 occupancy at Cfms (Cd115) and Mhc2ta (CIITApI, MHC-II) promoters analyzed by ChIP. Primers amplifying at –0.2 kb and +4.5 kb for Cfms and –74 bp and –3.0 kb for CIITApI used as positive binding sites and negative controls (n = 3–4 for each group). (G) CD115 and MHC-II mRNA expression in aortas of WD-fed Ldlr–/– mice receiving S1pr1-KI, S1pr1-LysMCre, or S1pr1-F4/80Cre BM. * - P < 0.05, ** - P < 0.01, *** - P < 0.001 (Lys-Cre vs. Ctrl or F4-Cre vs. Ctrl), § - P < 0.05, §§ - P < 0.01, §§§ - P < 0.001 (Lys-Cre vs. F4-Cre, 1-way or 2-way ANOVA except B IRF8 and D CIITApI/anti-PU.1: Kruskal-Wallis h test).
Figure 3
Figure 3. S1P1 overexpression in macrophages promotes antiinflammatory polarization.
PMs from either S1pr1-KI (Ctrl, n = 6–10), S1pr1-LysMCre (Lys-Cre, n = 6–10), or S1pr1-F4/80Cre (F4-Cre, n = 6–9) on ND or Ldlr–/– mice transplanted with S1pr1-KI (n = 9–11), S1pr1-LysMCre (n = 9–10), or S1pr1-F4/80Cre (n = 9–10) BM on WD. (A) qPCR of antiinflammatory signature genes. mRNA normalized to Gapdh and presented relative to S1pr1-KI. (B) CD206 (antiinflammatory marker) and CD86 and CD93 (pro-inflammatory markers) analyzed by flow cytometry. (C) PMs incubated for 24 hours in media containing 1% FCS (ND-fed mice, n = 6 for each group, left panels) or 10% FCS (ND- and WD-fed mice, left and central panels). Cytokines in media and plasmas (WD-fed mice, n = 8–11 for each group, central and right panels) determined by ELISA. (D) Cytokine mRNA expression in aortas by qPCR (n = 6–8 for each group). * - P < 0.05, ** - P < 0.01, *** - P < 0.001 (Lys-Cre vs. Ctrl or F4-Cre vs. Ctrl, § - P < 0.05, §§ - P < 0.01, §§§ - P < 0.001 (Lys-Cre vs. F4-Cre, 1-way ANOVA except C IL-10/Plasma and C IL-4/Plasma: Kruskal-Wallis h test).
Figure 4
Figure 4. S1P1 overexpression in macrophages enhances expression and activation of LXRα.
PMs from either S1pr1-KI (Ctrl, n = 7–10), S1pr1-LysMCre (Lys-Cre, n = 7–10), or S1pr1-F4/80Cre (F4-Cre, n = 7–10) mice on ND or Ldlr–/– mice transplanted with S1pr1-KI (n = 10), S1pr1-LysMCre (n = 9), or S1pr1-F4/80Cre (n = 9) BM on WD. (A) qPCR of Lxra and LXR signature genes. mRNA normalized to Gapdh and presented relative to S1pr1-KI. (B) PMs from ND-fed mice incubated for 24 hours in media with desmosterol (Des, 10 or 50 μmol/L) or 22-hydroxycholesterol/9-cis-retinoic acid (22OH, 0.5 and 5.0 μg/mL). qPCR of LXR signature genes (n = 4–6 for each group). (C) LXR occupancy at Abca1, Abcg1, Arg1, and Il5 promoters by ChIP in PMs from ND-fed mice incubated for 24 hours with or without desmosterol (50 μmol/L). Primers amplifying at –85 bb and –4.0 kb for Abca1, –0.1 kb and –3.2 kb for Abcg1, –0.7 kb and –1.6 kb for Arg1, and –0.2 kb and –1.0 kb for Il5 used as positive binding sites and negative controls (n = 4–7 for each group). (D) PMs from ND-fed mice loaded with [1,2-3H]-cholesterol (n = 3 for each group) were incubated for 4 hours with apoA-I (10.0 μg/mL) or HDL (12.5 μg/mL). * - P < 0.05, ** - P < 0.01, *** - P < 0.001 (Lys-Cre vs. Ctrl or F4-Cre vs. Ctrl), § - P < 0.05, §§ - P < 0.01, §§§ - P < 0.001 (Lys-Cre vs. F4-Cre, 1-way or 2-way ANOVA except A Lxra/WD and A Abca1/ND: Kruskal-Wallis h test).
Figure 5
Figure 5. S1P1 overexpression in macrophages inhibits ER stress–dependent apoptosis and enhances efferocytosis.
PMs from S1pr1-KI (Ctrl, n = 6–10), S1pr1-LysMCre (Lys-Cre, n = 6–10), or S1pr1-F4/80Cre (F4-Cre, n = 6–10) mice on ND or Ldlr–/– mice transplanted with S1pr1-KI (n = 10–11), S1pr1-LysMCre (n = 9), or S1pr1-F4/80Cre (n = 9) BM on WD. (A) PMs from ND-fed mice exposed for 24 hours to thapsigargin/fucoidan (Thapsi, 0.5 μmol/L and 25.0 μg/mL) or acetylated LDL (AcLDL, 100.0 μg/mL). Percentage of apoptotic (annexin V positive) cells and caspase-3 and -12 activities (n = 3 for each group). (B) qPCR of Mertk and Axl1 mRNA normalized to Gapdh and presented relative to S1pr1-KI. Lower panel: Mertk in PMs from ND-fed mice incubated for 24 hours with desmosterol (10 or 50 μmol/L) or 22-hydroxycholesterol/9-cis-retinoic acid (0.5 and 5.0 μg/mL, n = 4 for each group). (C) MerTK and Axl1 analyzed by flow cytometry. (D) qPCR of Gas6. (E) Dot plots showing efferocytosis of apoptotic RAW264.7 cells (ATCC) by PMs from ND-fed mice incubated for 24 hours with or without desmosterol (50 μmol/L). RAW264.7 cells and PMs were labeled with calcein and anti–F4/80-FITC (n = 3 for each group). (F) Aortic root section images with apoptotic cells labeled by TUNEL (red), macrophages by anti–MOMA-2 (green), and nuclei by DAPI (blue). Apoptotic cells appear violet (red on blue), and efferocytotic cells appear yellow (red on green, n = 5–10 for each group). The side of the square inset box measures 36 µm. * - P < 0.05, ** - P < 0.01, *** - P < 0.001 (Lys-Cre vs. Ctrl or F4-Cre vs. Ctrl), § - P < 0.05, §§ - P < 0.01, §§§ - P < 0.001 (Lys-Cre vs. F4-Cre, 1-way or 2-way ANOVA except B Axl1/WD, D ND and WD, and F Apoptosis: Kruskal-Wallis h test).
Figure 6
Figure 6. Stimulatory effects of S1P1 overexpression are mediated by PKA and AKT.
PMs from S1pr1-KI (Ctrl, n = 3–4), S1pr1-LysMCre (Lys-Cre, n = 3–4), or S1pr1-F4/80Cre (F4-Cre, n = 3–4) mice on ND were established in culture. (A) Cells were exposed to S1P (1.0 μmol/L) for 2 hours (upper panels) or dibutyryl-cAMP (DBcAMP) (0.25 mmol/L) for 24 hours (lower panels). cAMP levels and PKA activity were measured using enzyme immunoassay or Pep-Tag assay. Pu1 and Irf8 expressions were analyzed by qPCR. (B and C) PMs were analyzed for kinase activities or exposed to S1P (1.0 μmol/L) for indicated times. Intracellular stainings for phospho-AKT, phospho-STAT3, and phospho-STAT6 analyzed by flow cytometry (B). For mTOR1 activity, PMs lysates probed with antibodies against total and phosphorylated (P) p70S6 kinase (C). Blots representative for 2 independent experiments. (D) Cells were exposed for 30 minutes to GSK690693 (10.0 μmol/L), INK128 (0.2 μmol/L), or bafilomycin (1.0 μmol/L) prior to incubation with desmosterol (50 μmol/L) for 24 hours. Abca1 and Abcg1 genes analyzed by qPCR. Shown are results from 3 independent experiments. - P < 0.05, †† - P < 0.01, ††† - P < 0.001 with vs. without treatment with activator/inhibitor, * - P < 0.05, ** - P < 0.01, *** - P < 0.001 (Lys-Cre vs. Ctrl or F4-Cre vs. Ctrl), § - P < 0.05 (Lys-Cre vs. F4-Cre, 1-way or 2-way ANOVA).
Figure 7
Figure 7. Proposed molecular mechanisms underlying atheroprotective effects of S1P1 signaling in macrophages.
Two signaling pathways are triggered by S1P upon interaction with S1P1 in macrophages: First, lowering intracellular cAMP and PKA activity enhances the function of IRF8 and PU.1, which facilitates the development of an M2-like macrophage phenotype characterized by the increased production of antiinflammatory cytokines. Second, stimulation of AKT and mTOR1 fosters LXR activity and thereby promotes ABCA1– and G1–dependent reversed cholesterol transport. By elevating MerTK and Axl1 both pathways facilitate efferocytosis. The combined effect is the attenuation of the development of atherosclerotic lesions.

References

    1. Kano K, et al. Lysophospholipid mediators in health and disease. Annu Rev Pathol. 2022;17:459–483. doi: 10.1146/annurev-pathol-050420-025929. - DOI - PMC - PubMed
    1. Cannavo A, et al. Sphingosine kinases and sphingosine 1-phosphate receptors: signaling and actions in the cardiovascular system. Front Pharmacol. 2017;8:556. doi: 10.3389/fphar.2017.00556. - DOI - PMC - PubMed
    1. Engelbrecht E, et al. Lysolipids in vascular development, biology, and disease. Arterioscler Thromb Vasc Biol. 2021;41(2):564–584. doi: 10.1161/ATVBAHA.120.305565. - DOI - PMC - PubMed
    1. Marciniak A, et al. An update on sphingosine-1-phosphate receptor 1 modulators. Bioorg Med Chem Lett. 2018;28(23–24):3585–3591. doi: 10.1016/j.bmcl.2018.10.042. - DOI - PMC - PubMed
    1. Li N, Zhang F. Implication of sphingosine-1-phosphate in cardiovascular regulation. Front Biosci. 2016;21(7):1296–1131. doi: 10.2741/4458. - DOI - PMC - PubMed

MeSH terms

LinkOut - more resources