. 2024 Nov 12;134(24):e163648.
doi: 10.1172/JCI163648.

Nicotinamide and pyridoxine stimulate muscle stem cell expansion and enhance regenerative capacity during aging

Affiliations

Nicotinamide and pyridoxine stimulate muscle stem cell expansion and enhance regenerative capacity during aging

Sara Ancel et al. J Clin Invest. .

Abstract

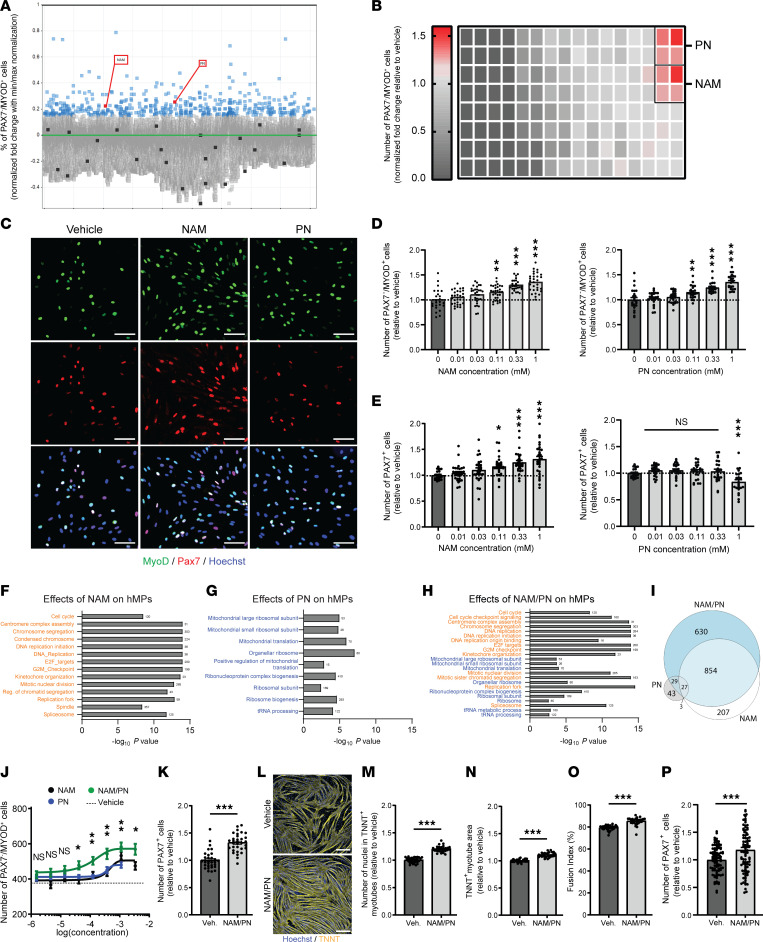
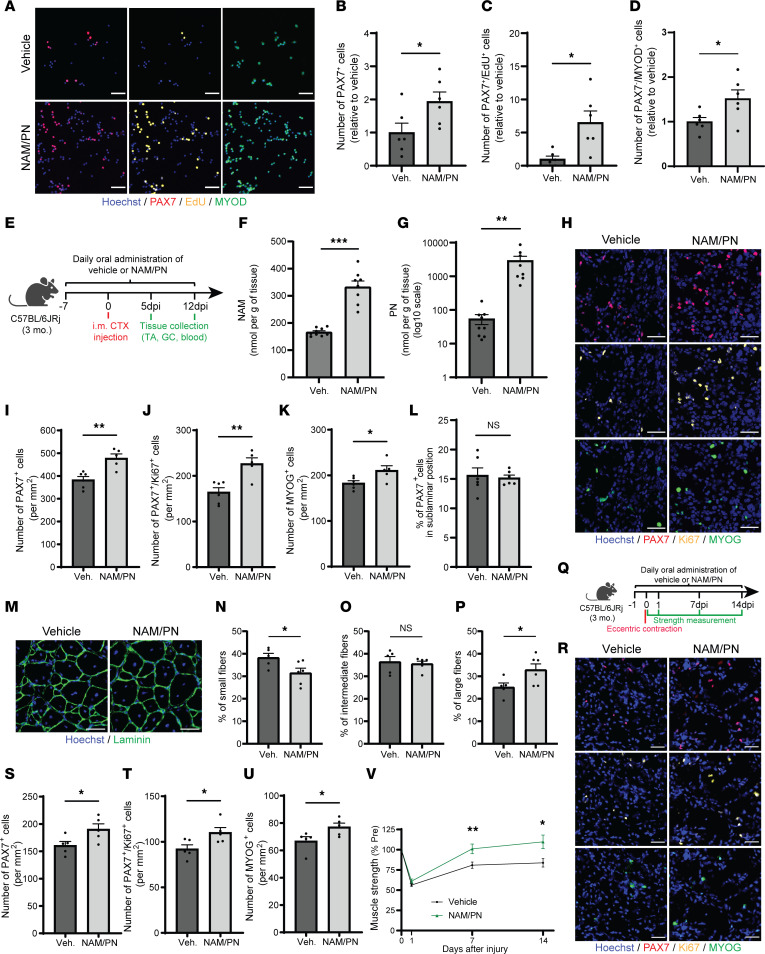
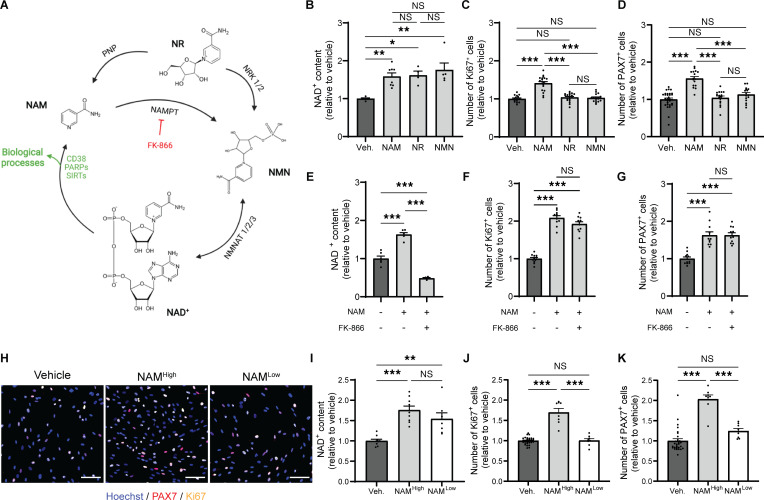
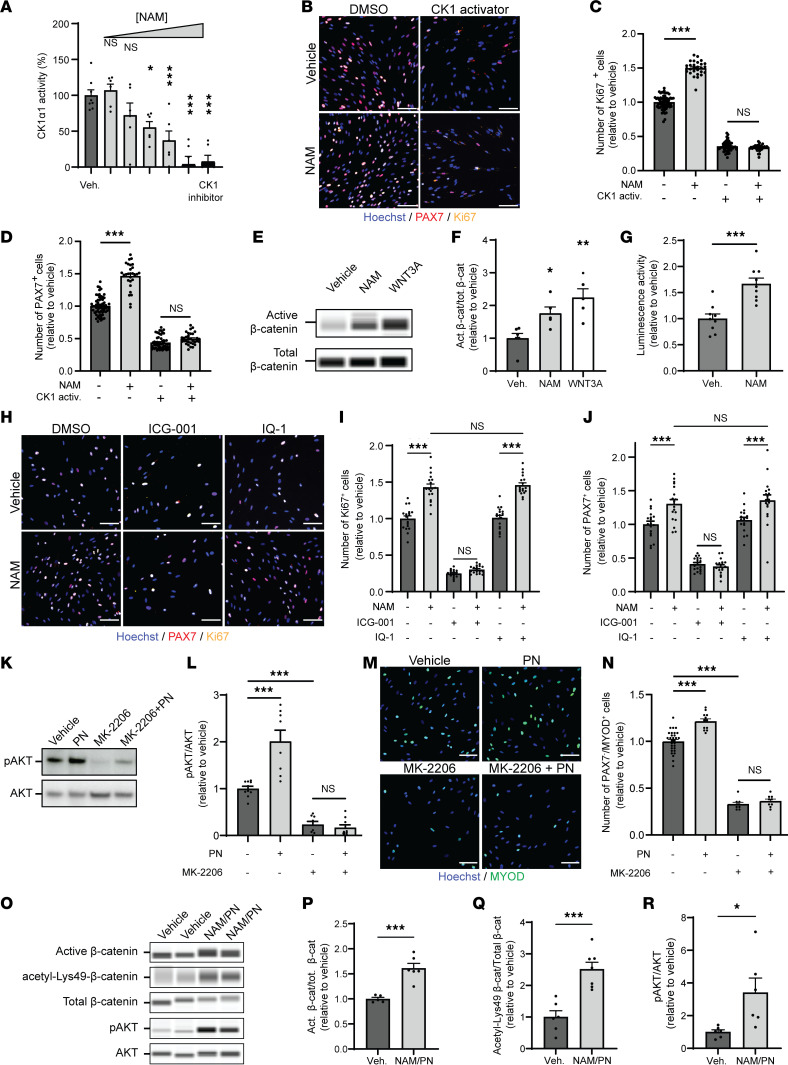
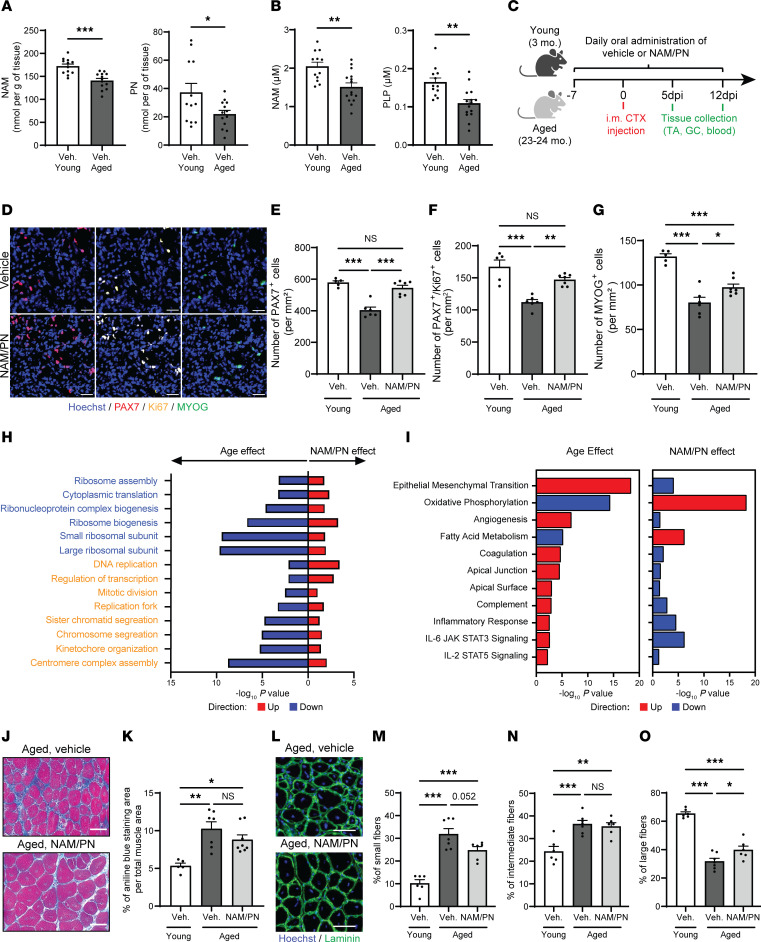
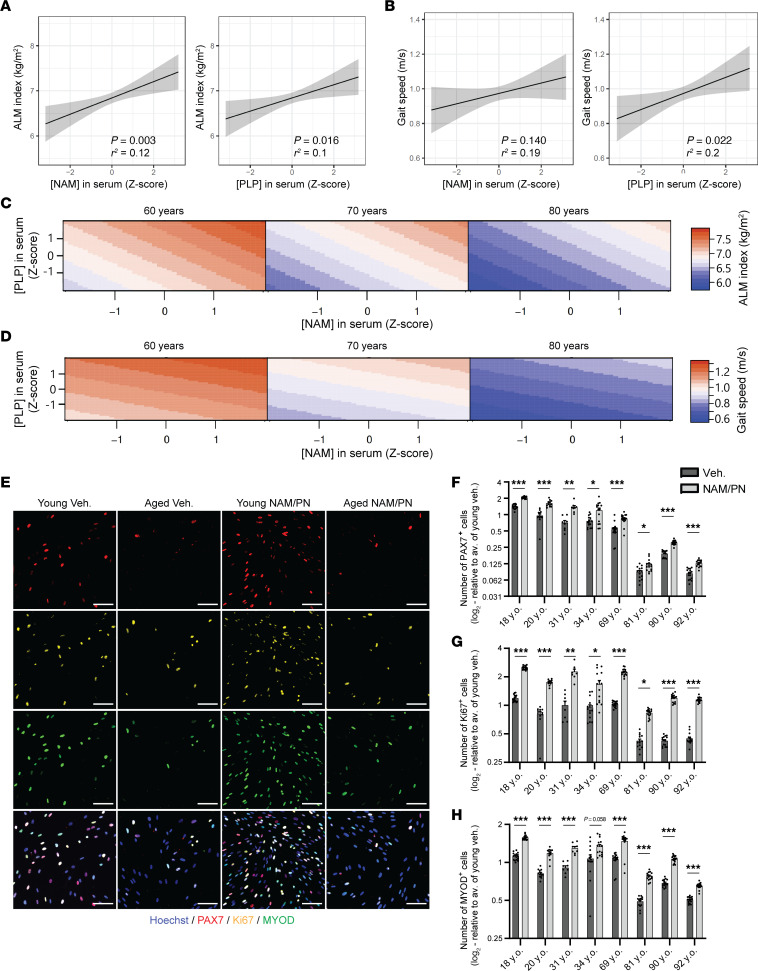
Skeletal muscle relies on resident muscle stem cells (MuSCs) for growth and repair. Aging and muscle diseases impair MuSC function, leading to stem cell exhaustion and regenerative decline that contribute to the progressive loss of skeletal muscle mass and strength. In the absence of clinically available nutritional solutions specifically targeting MuSCs, we used a human myogenic progenitor high-content imaging screen of natural molecules from food to identify nicotinamide (NAM) and pyridoxine (PN) as bioactive nutrients that stimulate MuSCs and have a history of safe human use. NAM and PN synergize via CK1-mediated cytoplasmic β-catenin activation and AKT signaling to promote amplification and differentiation of MuSCs. Oral treatment with a combination of NAM and PN accelerated muscle regeneration in vivo by stimulating MuSCs, increased muscle strength during recovery, and overcame MuSC dysfunction and regenerative failure during aging. Levels of NAM and bioactive PN spontaneously declined during aging in model organisms and interindependently associated with muscle mass and walking speed in a cohort of 186 aged people. Collectively, our results establish the NAM/PN combination as a nutritional intervention that stimulates MuSCs, enhances muscle regeneration, and alleviates age-related muscle decline with a direct opportunity for clinical translation.

Keywords: Adult stem cells; Epidemiology; Muscle biology; Skeletal muscle; Stem cells.


Figures

Figure 1
Figure 1. A high-content screen identifies NAM and PN as activators of hMP amplification and differentiation.
(A) Percentage of PAX7MYOD+ hMPs after 72-hour treatment with 50,000 bioactive molecules. Min-max normalization between negative (black line) and positive control (LY363947, green line) was performed. Blue, compounds with normalized effect size >15%; black, GRAS molecules; red, GRAS hits. (B) Relative number of PAX7MYOD+ cells in hMPs treated with GRAS-classified molecules. n = 2–4 cell culture replicates from N = 2 donors. (C) Representative images of hMPs treated with vehicle, NAM, or PN for 72 hours. Scale bar: 100 μm. (D and E) Dose response of NAM and PN on the relative number of PAX7MYOD+ (D) and PAX7+ (E) hMPs treated with vehicle, NAM, or PN for 72 hours. n ≥ 21 cell culture replicates from N = 2 donors. (FH) Gene set enrichment analysis of upregulated gene sets in hMPs treated with NAM (F), PN (G), or the NAM/PN combination (H) compared with vehicle. False discovery rate, 10%. N = 5 donors. (I) Venn diagram of upregulated genes using 5% FDR multiple testing correction. (J) Dose response of NAM, PN, and the NAM/PN combination on PAX7MYOD+ hMPs. n ≥ 6 cell culture replicates from 1 donor. (K) Quantification of PAX7+ hMPs after vehicle and NAM/PN combination treatment. n ≥ 32 cell culture replicates from 1 donor. (LO) Representative images (L) and quantification of nuclei within myotubes (M), myotube area (N), and fusion index (O) in hMPs treated with vehicle or NAM/PN combination during proliferation and differentiation. Scale bar: 500 μm. n ≥ 28 cell culture replicates for each condition from 1 donor. (P) Quantification of PAX7+ hMPs after vehicle and NAM/PN combination treatment after myotube differentiation induction. n ≥ 92 cell culture replicates from 1 donor. Data are shown as the mean ± SEM. *P < 0.05; **P < 0.01; ***P < 0.001 with 1-way ANOVA followed by post hoc Dunnett’s (D and E) or Tukey’s (J) multiple comparison test and 2-tailed unpaired Student’s t tests (K and MP).
Figure 2
Figure 2. The combination of NAM and PN enhances MuSC function in vivo and increases muscle strength during regeneration.
(AD) Representative immunofluorescence images and quantification of FACS-isolated mouse MuSCs treated with vehicle or NAM/PN combination ex vivo for 4 days. n = 6 cell culture replicates with cells pooled from N = 4 mice. (E) Cardiotoxin-induced muscle regeneration in young mice treated orally with NAM/PN combination or vehicle. (F and G) NAM and PN concentrations quantified by LC-MS/MS in uninjured gastrocnemius (GC) muscles from young vehicle- (N = 9) and NAM/PN combination–treated (N = 8) mice. (HK) Representative immunofluorescence images (H) and quantification of PAX7+ (I), PAX7+Ki67+ (J), and MYOGENIN+ (K) cells in tibialis anterior (TA) cross-sections from vehicle- (N = 6) and NAM/PN combination–treated (N = 5) mice at 5 dpi. (L) Number of PAX7+ sublaminar MuSCs in TA cross-sections from vehicle- (N = 6) and NAM/PN combination–treated (N = 6) mice at 12 dpi. (MP) Representative immunofluorescence images (M) and quantification of minimum ferret of small (33 μm) (N), intermediate (>33 μm and 43 μm) (O), and large (>43 μm) (P) regenerating myofibers in TA cross-sections from vehicle- (N = 5) and NAM/PN combination–treated (N = 6) mice at 12 dpi. (Q) Eccentric contraction–induced (EC-induced) muscle regeneration after electrically evoked lengthening contractions of plantar flexor (PF) muscles in young vehicle- and NAM/PN combination–treated mice. (R–U) Representative immunofluorescence (R) and quantification of PAX7+ (S), Ki67+ (T), and MYOGENIN+ (U) cells in GC muscle from vehicle- (N = 5) and NAM/PN combination–treated (N = 5) mice 7 days after the EC protocol. (V) Quantification of muscle strength (single twitch peak torque) in PF muscles before and 1, 7, and 14 days after EC-induced injury. N = 12 mice. Data are shown as the mean ± SEM. *P < 0.05; **P < 0.01; ***P < 0.001 with 2-tailed unpaired Student’s t tests (BD, F, G, IL, NP, and SV). Scale bars: 50 μm.
Figure 3
Figure 3. Nicotinamide promotes human myogenic progenitor proliferation independently of NAD+ metabolism.
(A) Scheme of mammalian NAD+ biosynthesis from various NAD+ precursors. NAD+, nicotinamide adenine dinucleotide; NR, nicotinamide riboside; NMN, nicotinamide mononucleotide; NAMPT, nicotinamide phosphoribosyl transferase; NMNAT, nicotinamide mononucleotide adenylyl transferase; NRK, nicotinamide riboside kinase; PNP, purine nucleoside phosphorylase. (BD) NAD+ content (B) and number of Ki67+ (C) and PAX7+ (D) human myogenic progenitors (hMPs) after treatment with vehicle or different NAD+ precursors. n ≥ 4 and n ≥ 15 cell culture replicates per condition from N = 2 donors for B and for C and D, respectively. (EG) NAD+ content (E) and number of Ki67+ (F) and PAX7+ (G) hMPs after treatment with NAM and the NAMPT inhibitor FK-866. n ≥ 4 and n ≥ 11 cell culture replicates per condition from N = 2 donors for E and for F and G, respectively. (HK) Representative images (H), NAD+ levels (I), and number of Ki67+ (J) and PAX7+ (K) hMPs after treatment with NAM at low (100 μM) and high (1 mM) doses. Scale bar: 100 μm. n ≥ 7 (I) and n ≥ 8 (J and K) cell culture replicates from 1 donor. Data are shown as the mean ± SEM. *P < 0.05; **P < 0.01; ***P < 0.001 with 1-way ANOVA with post hoc Tukey’s multiple comparison test (bG and iK).
Figure 4
Figure 4. NAM and PN stimulate hMPs through β-catenin and AKT signaling, respectively.
(A) Dose response of NAM on CK1α1 activity (1 μM to 20 mM). n ≥ 6 replicates. (BD) Representative immunofluorescence images (B) and quantification of Ki67+ (C) and PAX7+ (D) hMPs after treatment with NAM and/or CK1α activator. n ≥ 16 cell culture replicates from 1 donor. (E and F) Representative capillary immunoassays (E) and quantification (F) of nonphosphorylated β-catenin protein levels in NAM-treated hMPs. WNT3A was used as positive control of β-catenin activation. n ≥ 5 cell culture replicates from N = 2 donors. (G) Luciferase activity of primary mouse MuSCs cotransfected with a TopFlash β-catenin luciferase reporter gene and treated with vehicle or NAM. n = 9 cell culture replicates. (HJ) Representative immunofluorescence images (H) and quantification of Ki67+ (I) and PAX7+ (J) hMPs after treatment with NAM and/or the β-catenin nuclear inhibitors ICG-001 and IQ-1. n ≥ 18 cell culture replicates from 1 donor. (K and L) Representative immunoblot images (K) and quantification (L) of hMPs treated with PN and/or the AKT inhibitor MK-2206. n ≥ 8 cell culture replicates from 1 donor. (M and N) Representative immunofluorescence images (M) and quantification of MYOD+ hMPs (N) following treatment with PN and/or MK-2206. n ≥ 9 cell culture replicates from 1 donor. (OR) Representative capillary immunoassays (O) and quantification of active nonphosphorylated β-catenin protein levels (P), Lys49 acetylation of β-catenin (Q), and pAKT/AKT ratio (R) in MuSCs from regenerating muscles following oral NAM and PN supplementation in young mice. N ≥ 5 mice for each condition. Mouse MuSCs were freshly isolated from regenerating mouse TA, GC, and QD muscles at 5 dpi. Data are shown as the mean ± SEM. *P < 0.05; **P < 0.01; ***P < 0.001 with 1-way ANOVA with post hoc Dunnett’s (A and F), Šidák’s multiple comparisons adjustment (C, D, I, J, L, and N), or 2-tailed unpaired Student’s t test (G, P, Q, and R). Scale bars: 100 μm.
Figure 5
Figure 5. NAM and PN restore MuSC function and enhance regeneration in aged skeletal muscle.
(A and B) Gastrocnemius (A) and plasma (B) concentrations of NAM and PN or NAM and PLP by LC-MS/MS in young and aged mice. N ≥ 12 mice per group.(C) Experimental scheme of CTX-induced muscle regeneration in young and aged mice treated with The NAM/PN combination or vehicle. (DG) Representative immunofluorescence images (D) and quantification of PAX7+ (E), PAX7+Ki67+ (F), and MYOGENIN+ (G) cells on tibialis anterior (TA) cross-sections from young (N = 5) and aged vehicle- (N = 6) and NAM/PN combination–treated (N = 7) mice at 5 dpi. (H) Gene set enrichment analysis curated from Gene Ontology:Biological Process (GO:BP) gene sets (https://www.gsea-msigdb.org/gsea/msigdb) of freshly isolated MuSCs from young and aged mice (age effect) and of aged MuSCs treated ex vivo with vehicle or the NAM/PN combination (treatment effect) (N = 6). (I) Gene set enrichment analysis of curated Hallmarks gene sets of regenerating GC muscles of young vs. aged mice and of vehicle- vs. NAM/PN combination–treated aged mice 5 dpi (N = 6). False discovery rate, 10%. (J and K) Representative images (J) and quantification (K) of fibrotic aniline blue+ area from a Masson’s trichrome staining of TA cross-sections from young (N = 5) and aged vehicle- (N = 7) and NAM/PN combination–treated (N = 8) mice at 12 dpi. (LO) Representative immunofluorescence images (L), quantification of minimum ferret myofiber size of small (22 μm) (M), intermediate (>22 μm and 32 μm) (N), and large (>32 μm) (O) regenerating myofibers in TA cross-sections from young (N = 6) and aged vehicle- (N = 7) and NAM/PN combination–treated (N = 6) mice at 12 dpi. Data are shown as the mean ± SEM. *P < 0.05; **P < 0.01; ***P < 0.001 with 2-tailed unpaired Student’s t test (A and B) and 1-way ANOVA followed by post hoc Tukey’s (EG, K, and MO) multiple comparison tests. Scale bars: 50 μm.
Figure 6
Figure 6. Nicotinamide and pyridoxine associate with muscle mass and function in aged humans and restore the myogenic capacity of aged hMPs.
(AD) LC-MS/MS analyses of NAM and pyridoxal-5′-phosphate (PLP; bioactive pyridoxine) in the sera of men aged >60 years (N = 186 participants). Appendicular lean mass index (ALMi) (A) and gait speed (B) were correlated to serum concentrations of NAM and PLP using a linear regression model adjusted for age. Regression line (black) and 95% confidence interval (CI) (gray). Estimated outcomes of the combined effect of NAM and PLP on ALMi (C) and gait speed (D) were modeled at different ages using a multiple linear regression model adjusted for age. (EH) Representative immunofluorescence images (E) and quantification of PAX7+ (F), Ki67+ (G), and MYOD+ (H) hMPs. n ≥ 8 cell culture replicates from N = 8 donors aged from 18 to 92 years following 72 hours of treatment with vehicle or the NAM/PN combination. Data are shown as the mean ± SEM. **P < 0.01; ***P < 0.001 with Brown-Forsythe and Welch’s ANOVA tests with Dunnett’s T3 multiple-comparison in 8 donors (FH). Data are shown as the mean ± SEM. Scale bar: 100 μm.

References

    1. Dumont NA, et al. Satellite cells and skeletal muscle regeneration. Compr Physiol. 2015;5(3):1027–1059. doi: 10.1002/cphy.c140068. - DOI - PubMed
    1. Mackey AL, et al. Assessment of satellite cell number and activity status in human skeletal muscle biopsies. Muscle Nerve. 2009;40(3):455–465. doi: 10.1002/mus.21369. - DOI - PubMed
    1. Ancel S, et al. Muscle stem cell quiescence: controlling stemness by staying asleep. Trends Cell Biol. 2021;31(7):556–568. doi: 10.1016/j.tcb.2021.02.006. - DOI - PubMed
    1. Keefe AC, et al. Muscle stem cells contribute to myofibres in sedentary adult mice. Nat Commun. 2015;6(1):7087. doi: 10.1038/ncomms8087. - DOI - PMC - PubMed
    1. Snijders T, et al. Satellite cells in human skeletal muscle plasticity. Front Physiol. 2015;6:283. doi: 10.3389/fphys.2015.00283. - DOI - PMC - PubMed