. 2024 Nov 12;20(11):e1011468.
doi: 10.1371/journal.pgen.1011468. eCollection 2024 Nov.

Inositol pyrophosphate catabolism by three families of phosphatases regulates plant growth and development

Affiliations

Inositol pyrophosphate catabolism by three families of phosphatases regulates plant growth and development

Florian Laurent et al. PLoS Genet. .

Abstract

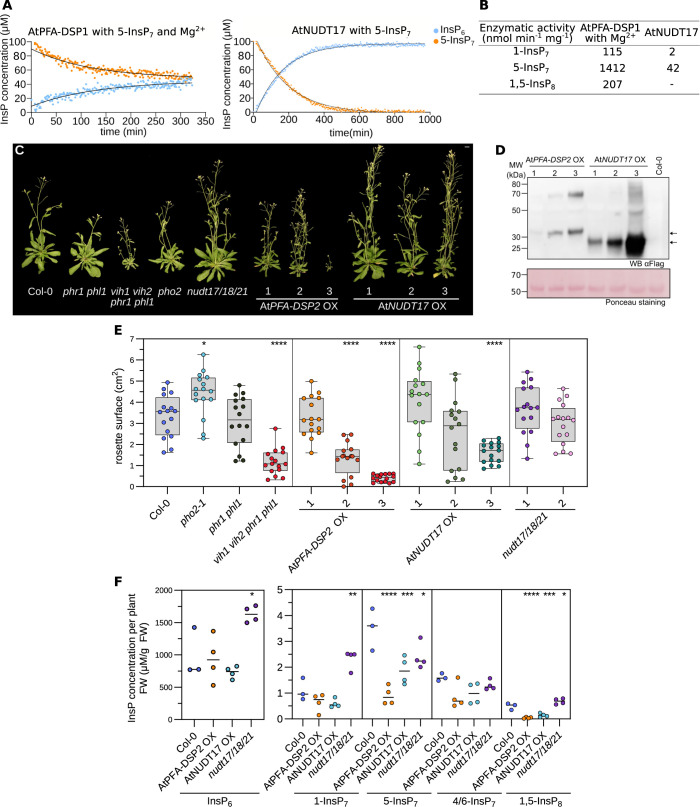
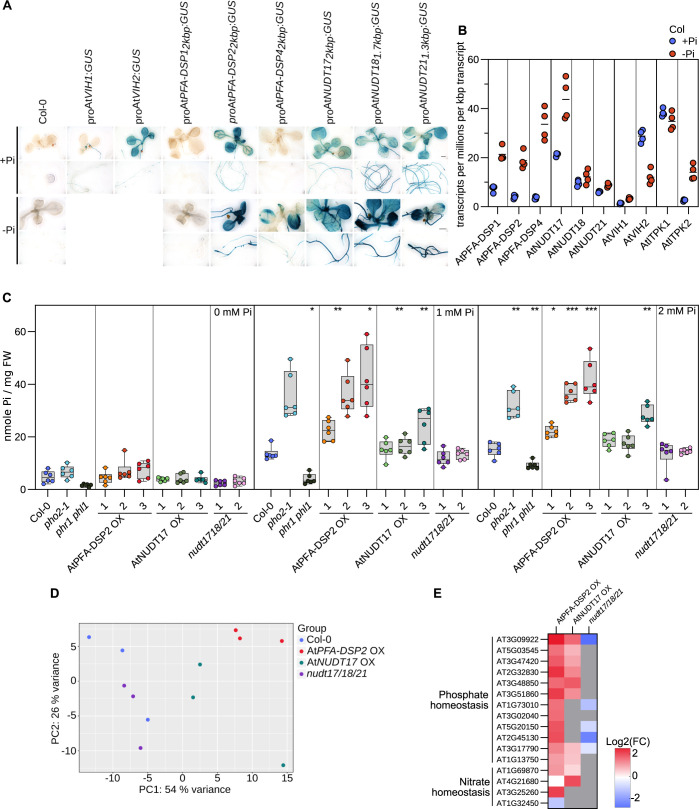
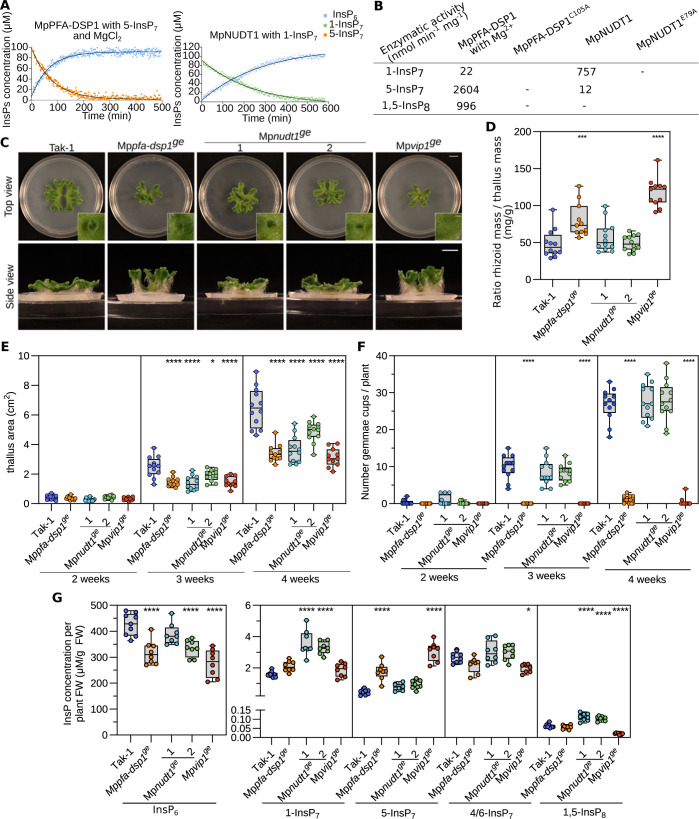
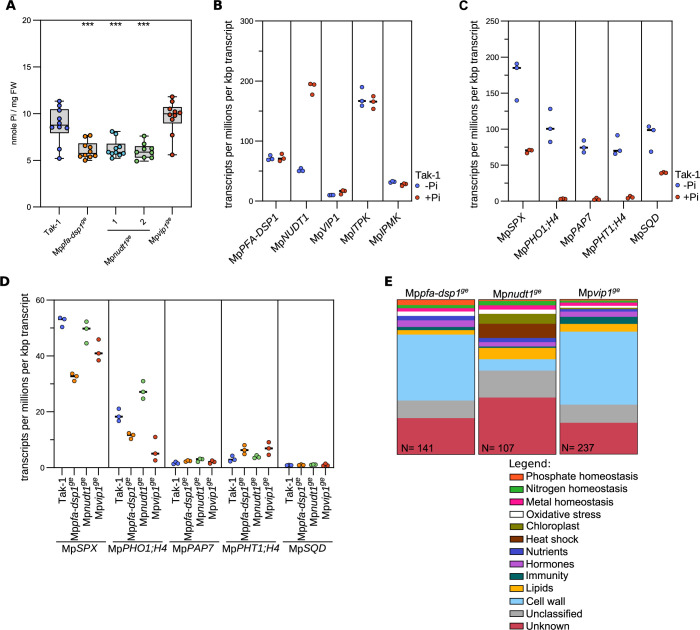
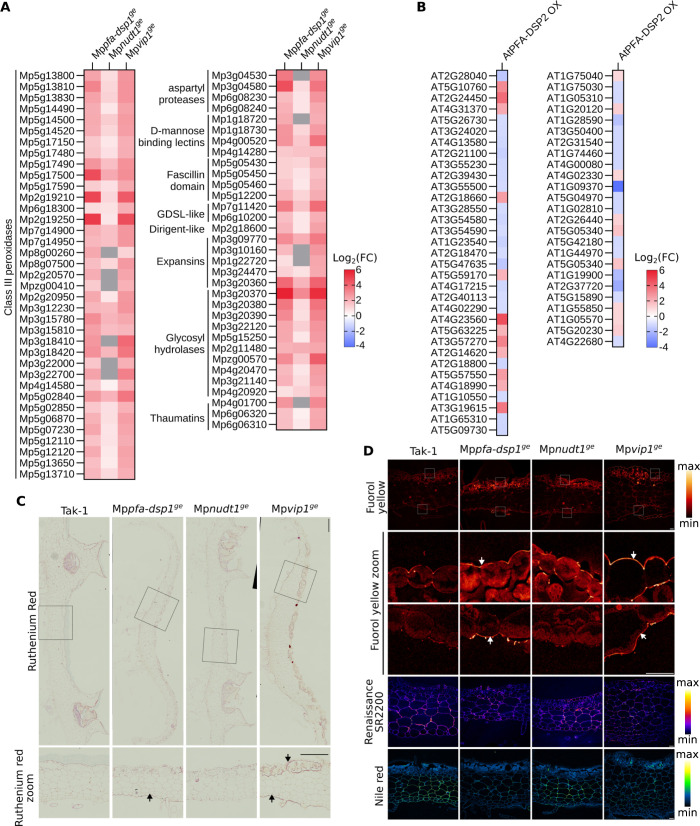
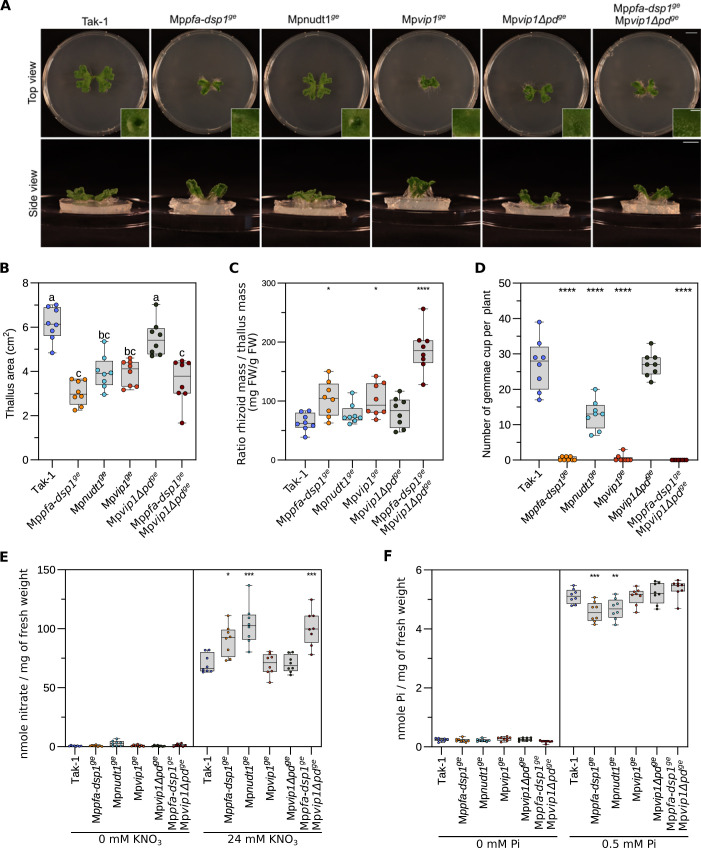
Inositol pyrophosphates (PP-InsPs) are nutrient messengers whose cellular levels are precisely regulated. Diphosphoinositol pentakisphosphate kinases (PPIP5Ks) generate the active signaling molecule 1,5-InsP8. PPIP5Ks harbor phosphatase domains that hydrolyze PP-InsPs. Plant and Fungi Atypical Dual Specificity Phosphatases (PFA-DSPs) and NUDIX phosphatases (NUDTs) are also involved in PP-InsP degradation. Here, we analyze the relative contributions of the three different phosphatase families to plant PP-InsP catabolism. We report the biochemical characterization of inositol pyrophosphate phosphatases from Arabidopsis and Marchantia polymorpha. Overexpression of different PFA-DSP and NUDT enzymes affects PP-InsP levels and leads to stunted growth phenotypes in Arabidopsis. nudt17/18/21 knock-out mutants have altered PP-InsP pools and gene expression patterns, but no apparent growth defects. In contrast, Marchantia polymorpha Mppfa-dsp1ge, Mpnudt1ge and Mpvip1ge mutants display severe growth and developmental phenotypes and associated changes in cellular PP-InsP levels. Analysis of Mppfa-dsp1geand Mpvip1ge mutants supports a role for PP-InsPs in Marchantia phosphate signaling, and additional functions in nitrate homeostasis and cell wall biogenesis. Simultaneous elimination of two phosphatase activities enhanced the observed growth phenotypes. Taken together, PPIP5K, PFA-DSP and NUDT inositol pyrophosphate phosphatases regulate growth and development by collectively shaping plant PP-InsP pools.


Conflict of interest statement

The authors have declared that no competing interests exist.

Figures

Fig 1
Fig 1. Overexpression of inositol pyrophosphate phosphatases restricts Arabidopsis growth and alters PP-InsP levels.
(A) NMR-based inositol phosphatase assays. Shown are time course experiments of AtPFA-DSP1 and AtNUDT17 using 100 μM of [13C6] 5-InsP7 as substrate. Pseudo-2D spin-echo difference experiments were used and the relative intensity changes of the C2 peaks of InsP6 and 5-InsP7 as function of time were quantified. (B) Table summaries of the enzymatic activities of AtPFA-DSP1 and AtNUDT17 vs. PP-InsPs substrates. (C) Growth phenotypes of 4-week-old nudt17/18/21, AtPFA-DSP2 OX and AtNUDT17 OX plants. phr1 phl1, vih1 vih2 phr1 phl1, pho2 mutants and Col-0 plants of the same age are shown as controls. Plants were germinated on ½MS for one week before transferring to soil for additional 3 weeks. Scale bar = 1 cm. (D) Western blot of AtPFA-DSP2 OX and AtNUDT17 OX plants vs. the Col-0 control. AtPFA-DSP2-Flag has a calculated molecular mass of ~31 kDa and AtNUDT17-Flag of ~24 kDa. A Ponceau stain is shown as loading control below. Arrows indicate the expected sizes of AtPFA-DSP2 (top) and AtNUDT17 (bottom). (E) Rosette surface areas of 3-week-old nudt17/18/21, AtPFA-DSP2 OX and AtNUDT17 OX plants, controls as in (C). Different genotypes are shown in different colors, independent transgenic T3 lines per genotype in different color shadings. Multiple comparisons of the genotypes vs. wild-type (Col-0) were performed using a Dunnett [105] test as implemented in the R package multcomp [106] (**** p < 0.001, *** p < 0.005, ** p < 0.01, * p < 0.05). (F) Whole tissue InsP6 and PP-InsP quantification of 2-week-old Col-0, nudt17/18/21, AtPFA-DSP2 OX and AtNUDT17 OX seedlings. (PP-)InsPs were extracted with titanium oxide beads and then quantified by CE-ESI-MS. Multiple comparisons of the genotypes vs. wild-type (Col-0) were performed using a Dunnett [105] test as implemented in the R package multcomp [106] (**** p < 0.001, *** p < 0.005, ** p < 0.01, * p < 0.05).
Fig 2
Fig 2. AtPFA-DSPs and AtNUDTs contribute to Pi homeostasis in Arabidopsis.
(A) Promoter β-glucuronidase (GUS) reporter assay for 2-week-old proAtPFA-DSP1::GUS proAtPFA-DSP2::GUS, proAtPFA-DSP4::GUS, proAtNUDT17::GUS, proAtNUDT18::GUS and proAtNUDT21::GUS seedlings. The previously reported proAtVIH1::GUS and proAtVIH2::GUS lines [9] are shown alongside. (B) Quantification of AtPFA-DSP1/2/4, AtNUDT17/18/21, AtVIH1/2 and AtITPK1/2 transcripts from RNA-seq experiments performed on 2-week-old Col-0 seedling grown in either no phosphate (-Pi) or in 1 mM K2HPO4/KH2PO4 (+Pi). Counts were normalized by the number of reads in each dataset and by the length of each transcript. (C) Total Pi concentrations of 2-week-old nudt17/18/21, AtPFA-DSP2 OX and AtNUDT17 OX seedlings grown in different Pi conditions. phr1 phl1, vih1 vih2 phr1 phl1, pho2 and Col-0 plants were used as control. For each genotype and condition, 6 biological replicates from 3–4 pooled seedlings were used, technical triplicates were done for the standards and duplicates for all samples. Different genotypes are shown in different colors, independent transgenic T3 lines per genotype in different color shadings. A Dunnett test was performed to assess the statistical difference of the genotypes in comparison to Col-0 (**** p < 0.001, *** p < 0.005, ** p < 0.01, * p < 0.05). (D) Principal component analysis (PCA) of an RNA-seq experiment comparing 2-week-old nudt1/18/21, AtPFA-DSP2 OX and AtNUDT17 OX seedlings grown under Pi-sufficient conditions to the Col-0 reference. The read variance analysis was performed with DESeq2 and displayed with ggplot2 in R. (E) Heatmap of differentially expressed genes (DEGs) involved in Pi or nitrogen homeostasis using the RNA-seq data from (D). Known marker genes significantly different from Col-0 involved in Pi or nitrogen homeostasis are displayed. Grey boxes = not differentially expressed compared to the Col-0 control.
Fig 3
Fig 3. Inositol pyrophosphate phosphatases regulate Marchantia growth, development, and PP-InsP pools.
(A) Pseudo-2D spin-echo difference NMR time course experiments for MpPFA-DSP1 and MpNUDT1 inositol phosphatase activities, using 100 μM of [13C6]5-InsP7 or [13C6]1-InsP7 as substrate, respectively. (B) Table summaries of the enzymatic activities of MpPFA-DSP1 and MpNUDT1 vs. PP-InsPs substrates. (C) Representative top and side views of 4-week-old Tak-1, Mppfa-dsp1ge, Mpnudt1ge and Mpvip1ge plants. Plants were grown from gemmae on ½B5 plates in continuous light at 22°C. Scale bar = 1 cm. Single gemmae cups are shown alongside, scale bar = 0.1 cm. (D) Rhizoids mass normalized to thallus mass of 4-week-old Tak-1, Mppfa-dsp1ge, Mpnudt1ge and Mpvip1ge plants. Rhizoids were manually peeled with forceps. The weight of the rhizoids was normalized by the thallus weight of the same plant. Statistical significance was assessed with a Dunnett test with Tak-1 as reference (**** p < 0.001, *** p < 0.005, ** p < 0.01, * p < 0.05). (E) Thallus surface areas of Tak-1, Mppfa-dsp1ge, Mpnudt1ge and Mpvip1ge mutant lines in time course experiments. Plants were grown from gemmae on ½B5 plates in continuous light with 22°C and one plant per round Petri dish as shown in (C). For each genotype, 12 plants were analyzed. Statistical significance was assessed with a Dunnett test with Tak-1 as reference at each time point (**** p < 0.001, *** p < 0.005, ** p < 0.01, * p < 0.05). (F) Number of gemmae cups as a function of time for Tak-1, Mppfa-dsp1ge, Mpnudt1ge and Mpvip1ge. Statistical significance was assessed with a Dunnett test with Tak-1 as reference at each time point (**** p < 0.001, *** p < 0.005, ** p < 0.01, * p < 0.05). (G) InsP6 and PP-InsPs levels of 3-week-old Tak-1, Mppfa-dsp1ge, Mpnudt1ge and Mpvip1ge plants. (PP-)InsPs were extracted with titanium oxide beads and then quantified by CE-ESI-MS. Multiple comparisons of the genotypes vs. Tak1-1 were performed using a Dunnett test [105] as implemented in the R package multcomp [106] (**** p < 0.001, *** p < 0.005, ** p < 0.01, * p < 0.05).
Fig 4
Fig 4. PSI gene expression and Pi homeostasis are affected in Mppfa-dsp1ge and Mpnudt1ge mutants.
(A) Total Pi levels of 3-week-old Tak-1, Mppfa-dsp1ge, Mpnudt1ge and Mpvip1ge plants grown under Pi-sufficient conditions. Technical triplicates were done for the standards and duplicates for all samples. Statistical significance was assessed with a Dunnett test with Tak-1 as reference (**** p < 0.001, *** p < 0.005, ** p < 0.01, * p < 0.05). (B) Quantification of the PP-InsP-metabolizing MpPFA-DSP1, MpNUDT1, MpVIP1, MpITPK1 and MpIPMK enzyme transcripts from RNA-seq experiments performed on 2-week-old Tak-1 plants grown in either no phosphate (-Pi) or in 0.5 mM K2HPO4/KH2PO4 (+Pi). Counts were normalized by the number of reads in each dataset and by the length of each transcript. (C) Identification of PSI marker in Marchantia polymorpha comparing 2-week-old Tak-1 plants grown in -Pi and +Pi conditions as in (B). (D) Gene expression of the PSI marker genes defined in (C) comparing 3-week-old Mppfa-dsp1ge, Mpnudt1ge and Mpvip1ge grown under Pi-sufficient conditions to Tak-1. (E) Manually curated gene-ontology classification of differentially expressed genes (DEGs) of 3-week-old Mppfa-dsp1ge, Mpnudt1ge and Mpvip1ge mutant lines vs. Tak-1. DEGs with |log2(FC)|>2 and p < 0.05 were considered differentially expressed.
Fig 5
Fig 5. Cell wall composition is altered in Mppfa-dsp1ge and Mpvip1ge mutant plants.
(A) Heatmap of differentially expressed genes (DEGs) in 3-week-old Mppfa-dsp1ge, Mpnudt1ge and Mpvip1ge plants grown under Pi-sufficient conditions vs. Tak-1. Genes significantly different from Tak-1 and putatively involved in cell wall homeostasis are displayed. Grey boxes = not differentially expressed. (B) Heatmap of DEGs of 2-week-old AtPFA-DSP2 OX plants vs. Col-0. (C) Fixed transverse cross-sections at the level of gemmae cups from 3-weeks-old Tak-1, Mppfa-dsp1ge, Mpnudt1ge and Mpvip1ge plants, stained with ruthenium red. Enlarged views of ruthenium red-stained sections are below their respective genotypes. Scale bars: 500 μm (top panels) and 10 μm (bottom panels). Regions in Mppfa-dsp1ge or Mpvip1ge enriched in cell wall material compared to Tak-1 are marked by arrows. (D) From top to bottom: fluorol yellow-stained sections, enlarged view of fluorol yellow-stained dorsal side, enlarged view of fluorol yellow-stained ventral side (scale bar = 40 μm), total view of the Renaissance SR2200-stained cross-sections (scale bar = 50 μm) and total view of the nile red-stained cross-sections (scale bar = 50 μm). Lookup tables for fluorol yellow, Renaissance SR2200 and nile red stainings are shown alongside. Regions in Mppfa-dsp1ge or Mpvip1ge enriched in cell wall material compared to Tak-1 are marked by arrows.
Fig 6
Fig 6. PP-InsP catabolic enzymes contribute to Pi and nitrate homeostasis in Marchantia.
(A) Growth phenotypes of 3-week-old Tak-1, Mppfa-dsp1ge, Mpnudt1ge, Mpvip1ge, MpvipΔpdge and Mpvip1ge MpvipΔpdge plants grown from single gemmae on ½B5 plates in continuous light at 22°C. Scale bar = 1 cm. Representative single gemmae cups are shown alongside, scale bar = 0.1 cm. (B) Quantification of projected thallus surface areas of 3-week-old Tak-1, Mppfa-dsp1ge, Mpnudt1ge, Mpvip1ge, MpvipΔpdge and Mpvip1ge MpvipΔpdge plants. Tukey-type all-pairs comparisons between the genotypes [107] were performed in the R package multcomp [106]. (C) Rhizoid mass normalized to thallus mass of 4-week-old Tak-1, Mppfa-dsp1ge, Mpnudt1ge, Mpvip1ge, MpvipΔpdge and Mpvip1ge MpvipΔpdge plants. Rhizoids were manually peeled with forceps. The weight of the rhizoids was normalized by the thallus weight of the same plant. Statistical significance was assessed with a Dunnett test with Tak-1 as reference (**** p < 0.001, *** p < 0.005, ** p < 0.01, * p < 0.05). (D) Number of gemmae cups of 4-week-old Tak-1, Mppfa-dsp1ge, Mpnudt1ge, Mpvip1ge, MpvipΔpdge and Mpvip1ge MpvipΔpdge plants. Statistical significance was assessed with a Dunnett test with Tak-1 as reference (**** p < 0.001, *** p < 0.005, ** p < 0.01, * p < 0.05). (E) Nitrate quantification of 2-week-old Tak-1, Mppfa-dsp1ge, Mpnudt1ge, Mpvip1ge, MpvipΔpdge and Mpvip1ge MpvipΔpdge plant lines grown under nitrate starvation or control conditions. 8 plants were used per genotype. Nitrate was quantified using the Miranda spectrophotometric method [104]. Technical triplicates were done for the standards and duplicates for all samples. Statistical significance was assessed with a Dunnett test with Tak-1 as reference (**** p < 0.001, *** p < 0.005, ** p < 0.01, * p < 0.05). (F) Total Pi levels of 2-week-old Tak-1, Mppfa-dsp1ge, Mpnudt1ge, Mpvip1ge, MpvipΔpdge and Mpvip1ge MpvipΔpdge plants grown in Pi-starvation or Pi-sufficient (0.5 mM K2HPO4/KH2PO4) conditions. Technical triplicates were done for the standards and duplicates for all samples. Statistical significance was assessed with a Dunnett test with Tak-1 as reference (**** p < 0.001, *** p < 0.005, ** p < 0.01, * p < 0.05).

References

    1. Shears SB. Intimate connections: Inositol pyrophosphates at the interface of metabolic regulation and cell signaling. Journal Cellular Physiology. 2018;233: 1897–1912. doi: 10.1002/jcp.26017 - DOI - PMC - PubMed
    1. Azevedo C, Saiardi A. Eukaryotic Phosphate Homeostasis: The Inositol Pyrophosphate Perspective. Trends Biochem Sci. 2017;42: 219–231. doi: 10.1016/j.tibs.2016.10.008 - DOI - PubMed
    1. Wild R, Gerasimaite R, Jung J-Y, Truffault V, Pavlovic I, Schmidt A, et al.. Control of eukaryotic phosphate homeostasis by inositol polyphosphate sensor domains. Science. 2016;352: 986–990. doi: 10.1126/science.aad9858 - DOI - PubMed
    1. Chabert V, Kim G-D, Qiu D, Liu G, Michaillat Mayer L, Jamsheer K M, et al.. Inositol pyrophosphate dynamics reveals control of the yeast phosphate starvation program through 1,5-IP8 and the SPX domain of Pho81. Elife. 2023;12: RP87956. doi: 10.7554/eLife.87956 - DOI - PMC - PubMed
    1. Guan Z, Chen J, Liu R, Chen Y, Xing Q, Du Z, et al.. The cytoplasmic synthesis and coupled membrane translocation of eukaryotic polyphosphate by signal-activated VTC complex. Nat Commun. 2023;14: 718. doi: 10.1038/s41467-023-36466-4 - DOI - PMC - PubMed

MeSH terms

Substances

LinkOut - more resources