. 2024 Nov 19;121(47):e2410789121.
doi: 10.1073/pnas.2410789121. Epub 2024 Nov 12.

Hierarchical behavior control by a single class of interneurons

Affiliations

Hierarchical behavior control by a single class of interneurons

Jing Huo et al. Proc Natl Acad Sci U S A. .

Erratum in

Abstract

Animal behavior is organized into nested temporal patterns that span multiple timescales. This behavior hierarchy is believed to arise from a hierarchical neural architecture: Neurons near the top of the hierarchy are involved in planning, selecting, initiating, and maintaining motor programs, whereas those near the bottom of the hierarchy act in concert to produce fine spatiotemporal motor activity. In Caenorhabditis elegans, behavior on a long timescale emerges from ordered and flexible transitions between different behavioral states, such as forward, reversal, and turn. On a short timescale, different parts of the animal body coordinate fast rhythmic bending sequences to produce directional movements. Here, we show that Sublateral Anterior A (SAA), a class of interneurons that enable cross-communication between dorsal and ventral head motor neurons, play a dual role in shaping behavioral dynamics on different timescales. On a short timescale, SAA regulate and stabilize rhythmic bending activity during forward movements. On a long timescale, the same neurons suppress spontaneous reversals and facilitate reversal termination by inhibiting Ring Interneuron M (RIM), an integrating neuron that helps maintain a behavioral state. These results suggest that feedback from a lower-level cell assembly to a higher-level command center is essential for bridging behavioral dynamics at different levels.

Keywords: Caenorhabditis elegans; feedback inhibition; hierarchical behavior; organizing behavior timescales.


Conflict of interest statement

Competing interests statement:The authors declare no competing interest.

Figures

Fig. 1.
Fig. 1.
A conceptual scheme for organizing behaviors across different timescales. Top level: Two temporal sequences illustrate the neural activity of two separate circuits, each resulting in unique behavioral strategies. The prevailing strategy can affect neural activity at subordinate levels across extended timescales. Bottom level: The neural activity or behavioral patterns of motor systems that implement the prevailing strategy. Circuits located at the Upper level send feedforward instructions to the Lower level, whereas Lower-level circuits have the capability to send feedback signals to the Upper level.
Fig. 2.
Fig. 2.
SAA neurons modulate fast kinematics in forward locomotion. (A) Diagrams of circuit motif featuring Sublateral Anterior A Ventral (SAAV) and Sublateral Anterior A Dorsal (SAAD) together with head motor neurons. (B) Representative curvature kymographs for control (mock-ablated) and SAA-ablated animals during forward locomotion. Body curvature is expressed as a dimensionless unit κ·L, normalized by the worm’s body length L. (CE) Forward movement velocity, undulation frequency, and SD of the half-cycle duration (see text). **P= 0.001, ****P< 0.0001, two-sample t test with Welch’s correction. Box plots show the quartiles of the dataset, with whiskers extending from minimum to maximum, black dots are outliers and cross signs are mean. Ctrl: n = 113 trials (episodes), 8 animals; SAA-ablated: n = 85 trials, 8 animals. Both the control group and the actual SAA-ablated group consist of transgenic animals (Plad-2::Cre; Plim-4::loxP::PH-miniSOG). (F) Whole body bending amplitude for both control and SAA-ablated animals. The line indicates the average; the shaded region represents the SEM across trials. *P= 0.016, fractional distance [0.1, 0.2]; ****P< 0.0001, fractional distance [0.4, 0.9], Mann–Whitney U test was performed on the spatially averaged bending amplitude across the body of the worm (Materials and Methods). Ctrl: n = 113, 8 animals; SAA-ablated: n = 85, 8 animals. (G) The representative trace displays the activity of SAAD/V together with the curvature of the worm’s head during locomotion. A blue trace illustrates the change in the ratio between GECI wNEMOs (43) and wCherry. A dark dashed trace indicates the dynamics of head curvature ([0.1,0.2] fractional distance along the worm; see A), with positive values showing dorsal bending of the head. The colored ribbons below depict the behavior states throughout 140-s traces. The worm moved on a 2% agarose pad covered with a glass slide. (H) Maximum correlation between the neuronal activity and head curvature during forward or backward locomotion. We aligned the neuronal signals with a time-shifted (within ±2 s) head curvatures to find the highest cross-correlation. **P= 0.005, for SAAD result, n.s. P= 0.073, using a two-sample t test with Welch’s adjustment. The box plots illustrate the quartiles of the data, with strike bars indicating the range from minimum to maximum, black dots marking outliers, and cross signs denoting average. n = 16 for forward movement and n = 12 for backward movement, across 8 animals. (I) Average power spectrum density for SAAD and SAAV during forward or backward locomotion. The peak of the PSD curves are indicated by triangles. The shaded regions show the SDs. For forward movement, n = 16 and for backward movement, n = 12, from a total of 8 worms.
Fig. 3.
Fig. 3.
SAA stabilize rhythmic motion in forward movements. (A and B) Time evolution of a phase trajectory in a control animal (A) and an SAA-ablated animal (B). Time is color-coded along the phase curves to represent the progression of movement. (C) Density of trajectories embedded in the 3-dimensional phase space during forward movements of control animals. Each of the three subpanels represents a density projection onto a plane spanned by two orthogonal directions. (D) Similar to (C), but for SAA-ablated animals. (E) Local density differences between (C and D) were visualized by a voxelgram (Materials and Methods). The experiments in this figure were carried out on 0.8% agarose pad without OP50 lawn. Ctrl: n = 113, 8 animals; SAA-ablated: n = 85, 8 animals.
Fig. 4.
Fig. 4.
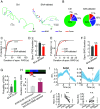
Impact of SAA on the long timescale crawling behaviors. (A) Representative crawling trajectories of a control and a SAA-ablated animal. Different motor states are color-coded, and arrows indicate the pause state. Each worm was recorded for about 5 min. (B) The percentage of time spent on forward movements, reversals, turns, or pauses. ****P< 0.0001, χ2 test was performed on fractional time spent in the reversal, turn, and pause states. The control group represents mock ablated animals. (C) Cumulative distributions of the forward run length. Related to (B). ****P< 0.0001, two-sample Kolmogorov–Smirnov (KS) test. Ctrl: n = 308, 8 animals; SAA-ablated: n = 273, 8 animals. (D) Mean duration of spontaneous forward runs in control and SAA-ablated animals. ****P< 0.0001, Mann–Whitney U test. The error bars represent SEM. (E) Cumulative distributions of reversal length. Related to (B). *P= 0.048, two-sample KS test. Ctrl: n = 214, 8 animals; SAA-ablated: n = 220, 8 animals. (F) Mean duration of spontaneous reversals in control and SAA-ablated animals. The error bars represent SEM. (G) The probability of eliciting a spontaneous reversal when SAA interneurons were optogenetically inhibited for 7 s by a green laser. The interval between optogenetic manipulations was >45 s. The control group was fed OP50 without all trans-retinal. **P< 0.01, χ2 test. Error bars indicate the 95% CI for the binomial proportion. Ctrl: n = 39, 7 animals; SAA::Arch: n = 85, 18 animals. (H) Top: illustration of the experimental procedure for inducing escape behavior by activating Anterior Ventral Microtubule Neuron (AVM)/Anterior Lateral Microtubule (ALM) (Pmec-4::Chrimson). The anterior half of an animal body was illuminated by 1.5 s red light during a forward movement. Bottom: duration of ALM/AVM-triggered reversals in control animals and SAA-ablated animals. ****P< 0.0001, Mann–Whitney U test. The error bars represent SEM. AVM/ALM::Chrimson: n = 414, 61 animals; AVM/ALM::Chrimson;SAA/RIV/SMB ablated: n = 41, 8 animals. (I) Changes in normalized neuronal activity before and after reversal onset. The moment of reversal initiation is indicated by 0 s. The shaded region indicates SD. Trials were included if they had long forward movement (>5 s) followed by long reversal (5 s). Displayed as δr/r0=(r(t)r(t=0))/r(t=0). The shaded areas in the two curves represent SEM. n = 7, 7 animals. (J) Related to (I), average normalized neuronal activities for the 5-s interval preceding and following the initiation of reversals. **P= 0.007 for SAAD, n.s. P= 0.49 for SAAV, using a paired t test.
Fig. 5.
Fig. 5.
Activation of SAA facilitates reversal termination. (A) The neuronal circuit bridging Lower-level head motor circuit and higher-level command center. The synaptic convergence and divergence of SAA are proportional to the width of the line. For example, the number of synapses from SAA to RIM is 70 and the number of synapses from RIM to SAA is 30. (B) Schematic experimental procedure for activation of SAA or SAA/RIV/SMB during thermally induced escape responses. Reversal was triggered by an infrared laser that focused on the head of the worm followed by optogenetic stimulation (red light). Related to (C and D). (C) Termination latency between the onset of optogenetic stimulation of SAA neurons or SAA/RIV/SMB neurons and the end of a reversal. ****P< 0.0001, compared to the control group, Mann–Whitney U test with Bonferroni correction. Ctrl: n = 52, 10 animals; SAA::Chrimson: n = 36, 9 animals; SAA/RIV/SMB::Chrimson: n = 229, 53 animals. (D) Similar to (C), but in one group, chemical synaptic transmission from SAA/RIV/SMB was blocked by an expression of tetanus toxin. **P= 0.00125, ****P< 0.0001, compared to the control group, Mann–Whitney U test. SAA/RIV/SMB::Chrimson: n = 65, 11 animals; SAA/RIV/SMB::Chrimson;SAA/RIV/SMB::TeTx: n = 60, 14 animals. (E) Termination latency between the onset of optogenetic stimulation of SAA/RIV neurons with ablated SMB neurons and the end of a reversal. ****P< 0.0001, Mann–Whitney U test. Ctrl (SMB-ablated worms fed without ATR): n = 58, 6 animals; experiment group: n = 89, 13 animals. (F) Calcium imaging of SAAD/SMB near the reversal-turn transition. t = 0 was aligned with the reversal end (that is, velocity = 0 mm/s). The blue curve is the mean velocity of worm movements; the green curve is the mean ratiometric calcium signal in SAAD/SMB neurons, plotted as δr/r0=(r(t)r(t=0))/r(t=0). The shaded areas in the two curves represent SEM. n = 40, 13 animals.
Fig. 6.
Fig. 6.
RIM communicates with SAA to terminate reversals via inhibitory cholinergic synapses. (A) Schematic experimental procedure for triggering escape responses (same as Fig. 4H). Optogenetic stimulation would activate AVM/ALM mechanosensory neurons. Related to (B and C). (A1) Schematic experimental procedure for triggering escape responses. Illumination of the entire worm activates all six touch receptor neurons (ALM L/R, AVM, PLM L/R, PVM). Related to (B1 and C1). (B) Duration of ALM/AVM-triggered reversals in N2 (wild type) and ACC-deficient animals. Ctrl: n = 414, 61 animals; acc-1(tm3268): n = 114, 16 animals; acc-2(tm3219): n = 100, 10 animals; acc-2(ok2216): n = 88, 12 animals; acc-3(tm3174): n = 97, 11 animals; acc-4(ok2371): n = 123, 16 animals. (B1) Duration of all-TRN-triggered reversals in Ctrl, LGC-47 deficient, and ACC-1 deficient animals. Here, a different mec-4 Chrimson allele is used, denoted by AML. The number of optogenetic stimulus events from Left to Right is 550, 498, and 624. (C) Duration of ALM/AVM-triggered reversal in N2, acc-1 mutant, as well as animals in which ACC-1 was specifically restored in RIM. Ctrl: n = 414, 61 animals; acc-1(tm3268): n = 114, 16 animals; acc-1(tm3268); Ptdc-1::ACC-1: n = 101, 16 animals. (C1) Duration of all-TRN-triggered reversal in Ctrl, lgc-47 mutant, as well as animals in which LGC-47 was specifically restored in RIM. The number of optogenetic stimulus events from Left to Right is 550, 498, and 341. (DG) GFP reporter lines show a colocalization of acc-1, acc-2, acc-3, and acc-4 with RIM interneuron. (H) Schematic procedure for dual thermal and optogenetic stimulation (same as Fig. 5B). Optogenetic stimulation would activate SAA neurons. Related to (I and J). (I) Termination latency in control, acc-1 mutant, as well as animals in which ACC-1 was specifically restored in RIM. Ctrl: n = 35, 8 animals; acc-1(tm3268): n = 48, 10 animals; acc-1(tm3268), Ptdc-1::ACC-1: n = 84, 15 animals. (J) Termination latency in control and RIM ablated animals. Ctrl (mock-ablated): n = 145, 26 animals; RIM-ablated: n = 64, 13 animals. In the experiments detailed in (I and J), SAA neurons were selectively activated. All Statistical tests: *P= 0.010, **P< 0.01, ****P< 0.0001, Mann–Whitney U test or Mann–Whitney U test with Bonferroni correction. Error bars represent SEM. (K) Calcium dynamics of RIM neurons. Upon blue light excitation at t = 0, the GCaMP signal was monitored in RIM. The coexpression of ChR2 in RIM would simultaneously depolarize the neuron during imaging, leading to a continuous increase in the calcium signal (gray). Activation of RIM together with SAA/SMB/RIV led to a transient but significant decrease in calcium activity in RIM (blue) shortly after stimulation onset. The animals were immobilized on a 10% agarose pad with a coverslip. Ptdc-1::ChR2: n = 39, 7 animals; Ptdc-1::ChR2; Plim-4::Chrimson: n = 21, 4 animals. Lines and shaded areas represent the mean ± SEM.
Fig. 7.
Fig. 7.
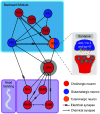
SAA interneurons bridge circuit modules that control short and long timescale motor behaviors.

References

    1. Tinbergen N., The Study of Instinct, The Study of Instinct (Clarendon Press/Oxford University Press, New York, NY, US, 1951), pp. xii, 237.
    1. Dawkins R., “Hierarchical organisation: A candidate principle for ethology” in Growing Points in Ethology, Bateson P. P. G., Hinde R. A., Eds. (Cambridge U Press, Oxford, England, 1976).
    1. Robertson R. J., Powers W. T., Introduction to Modern Psychology: The Control-Theory View (Control Systems Group, 1990), pp. ix, 238.
    1. Hölldobler B., Wilson E., The Ants (Springer, Berlin Heidelberg, 1998).
    1. Botvinick M. M., Niv Y., Barto A. G., Hierarchically organized behavior and its neural foundations: A reinforcement learning perspective. Cognition 113, 262–280 (2009). - PMC - PubMed

MeSH terms

Substances

LinkOut - more resources