. 2025 Jan 2;32(1):38-52.e6.
doi: 10.1016/j.stem.2024.10.012. Epub 2024 Nov 11.

Regulated GATA1 expression as a universal gene therapy for Diamond-Blackfan anemia

Affiliations

Regulated GATA1 expression as a universal gene therapy for Diamond-Blackfan anemia

Richard A Voit et al. Cell Stem Cell. .

Abstract

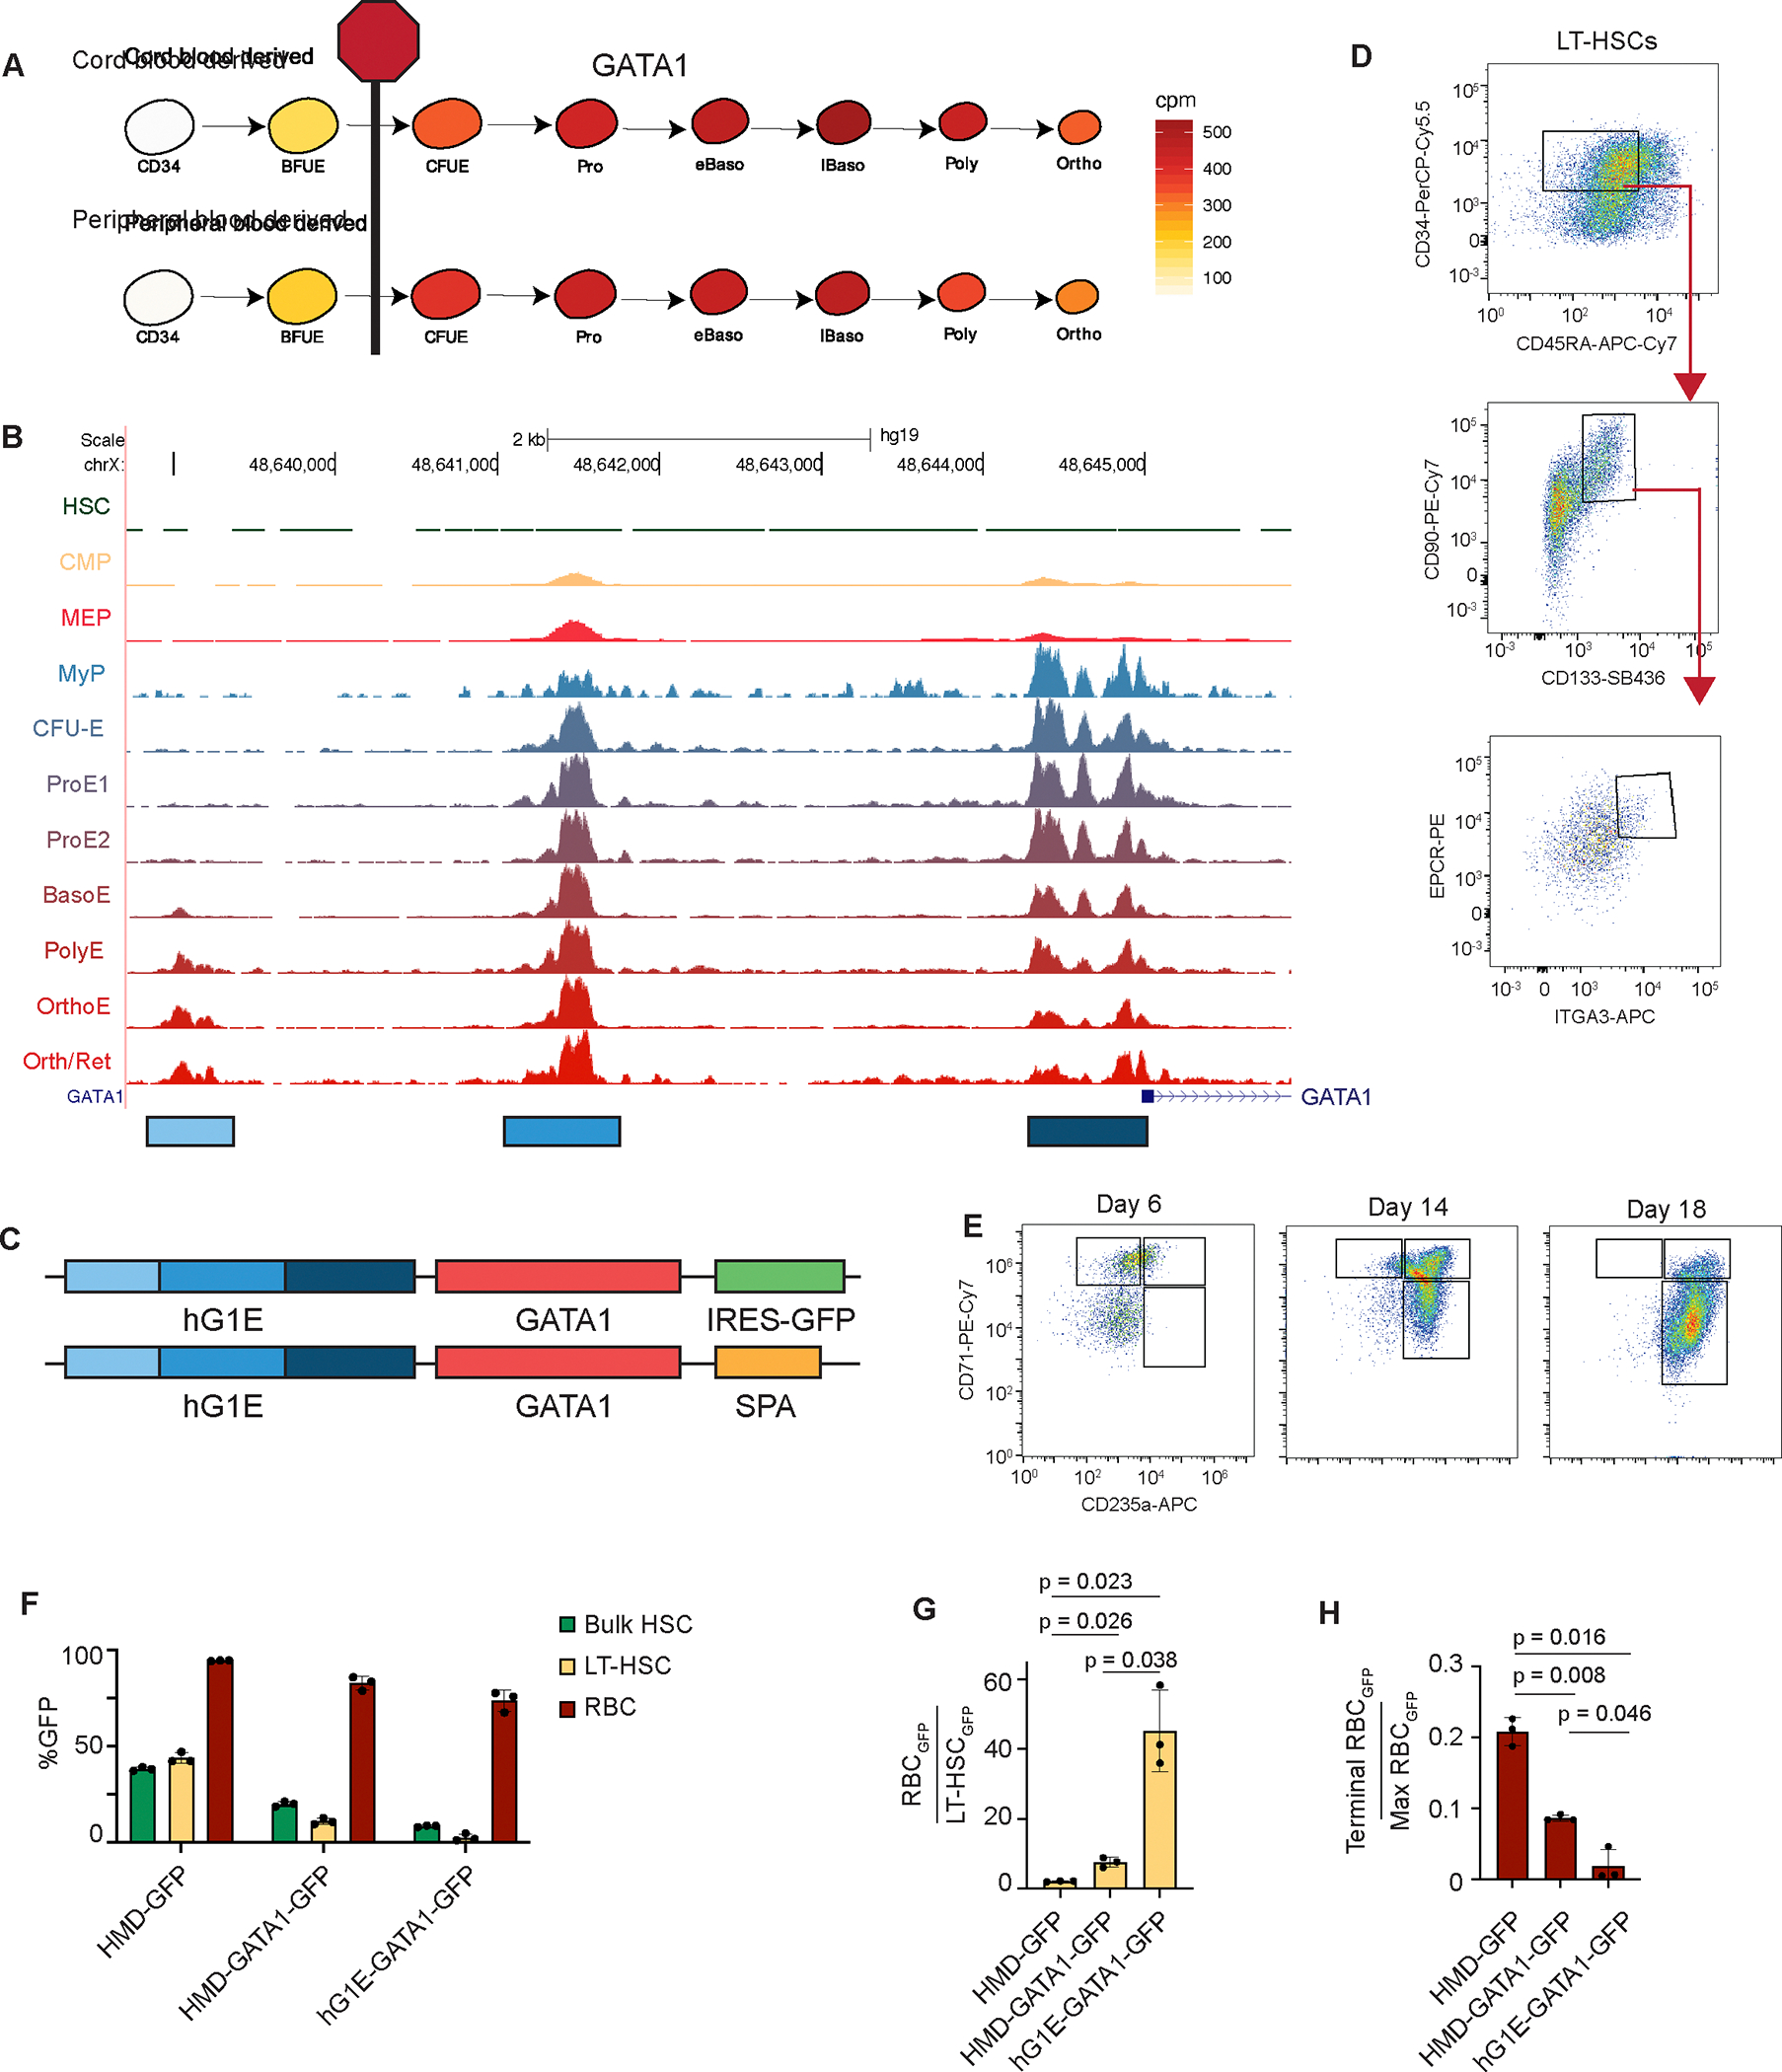
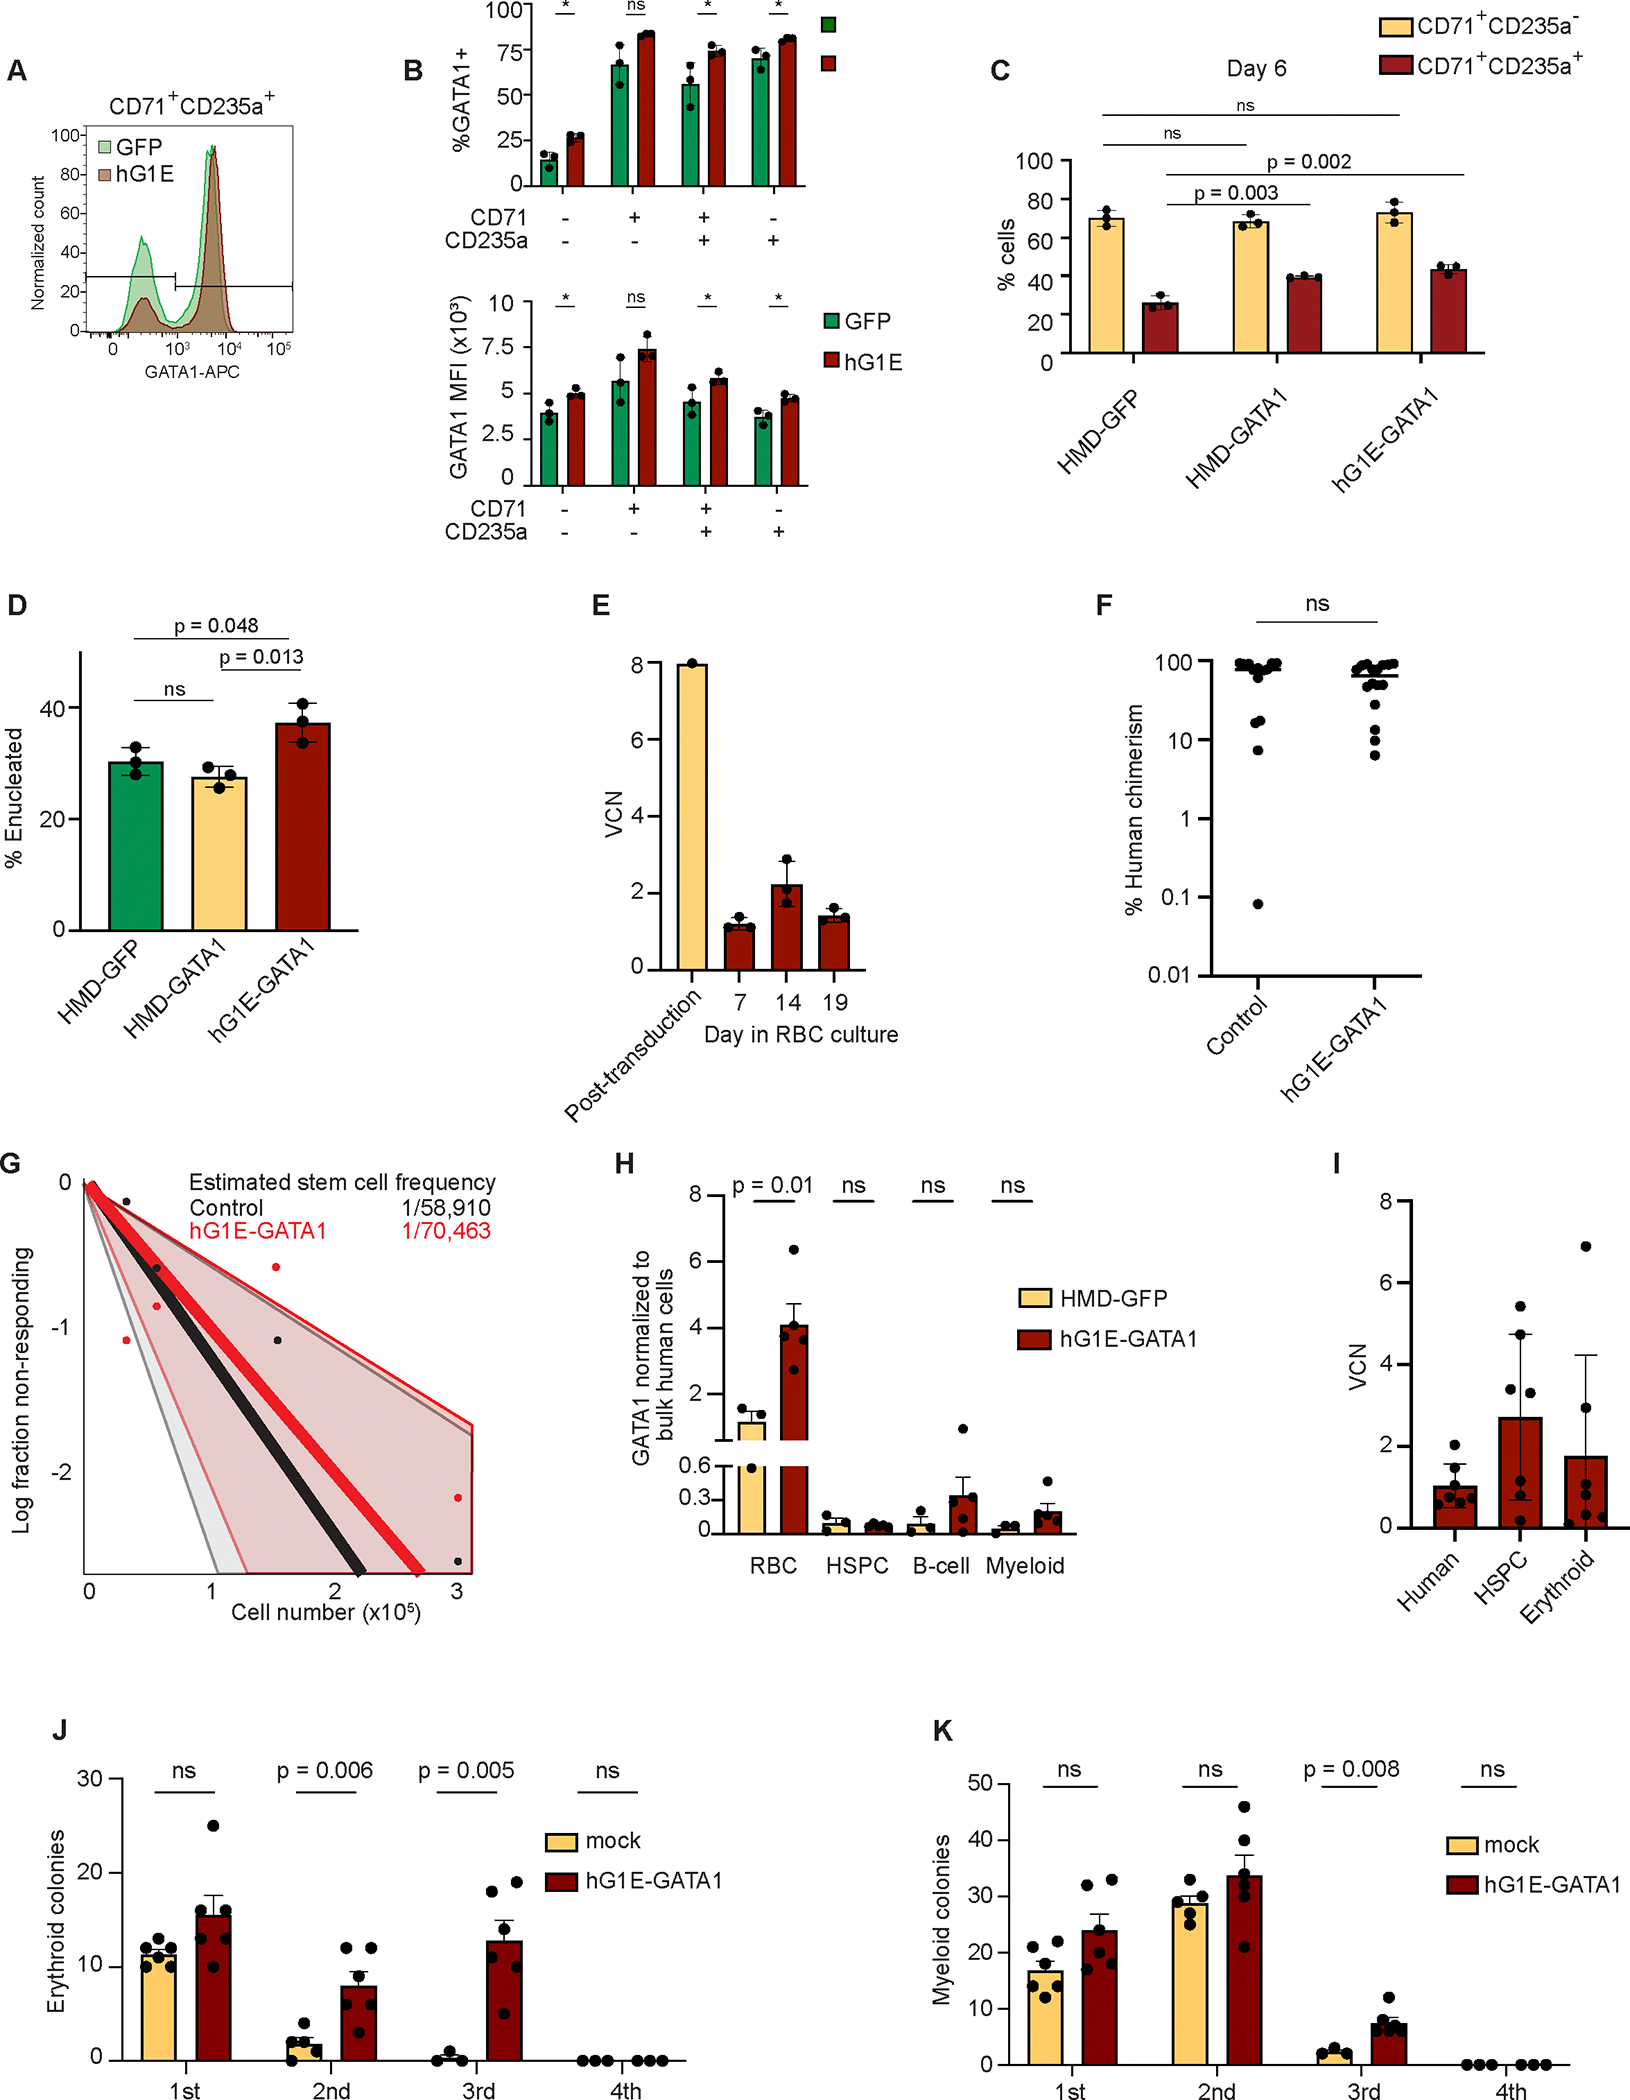
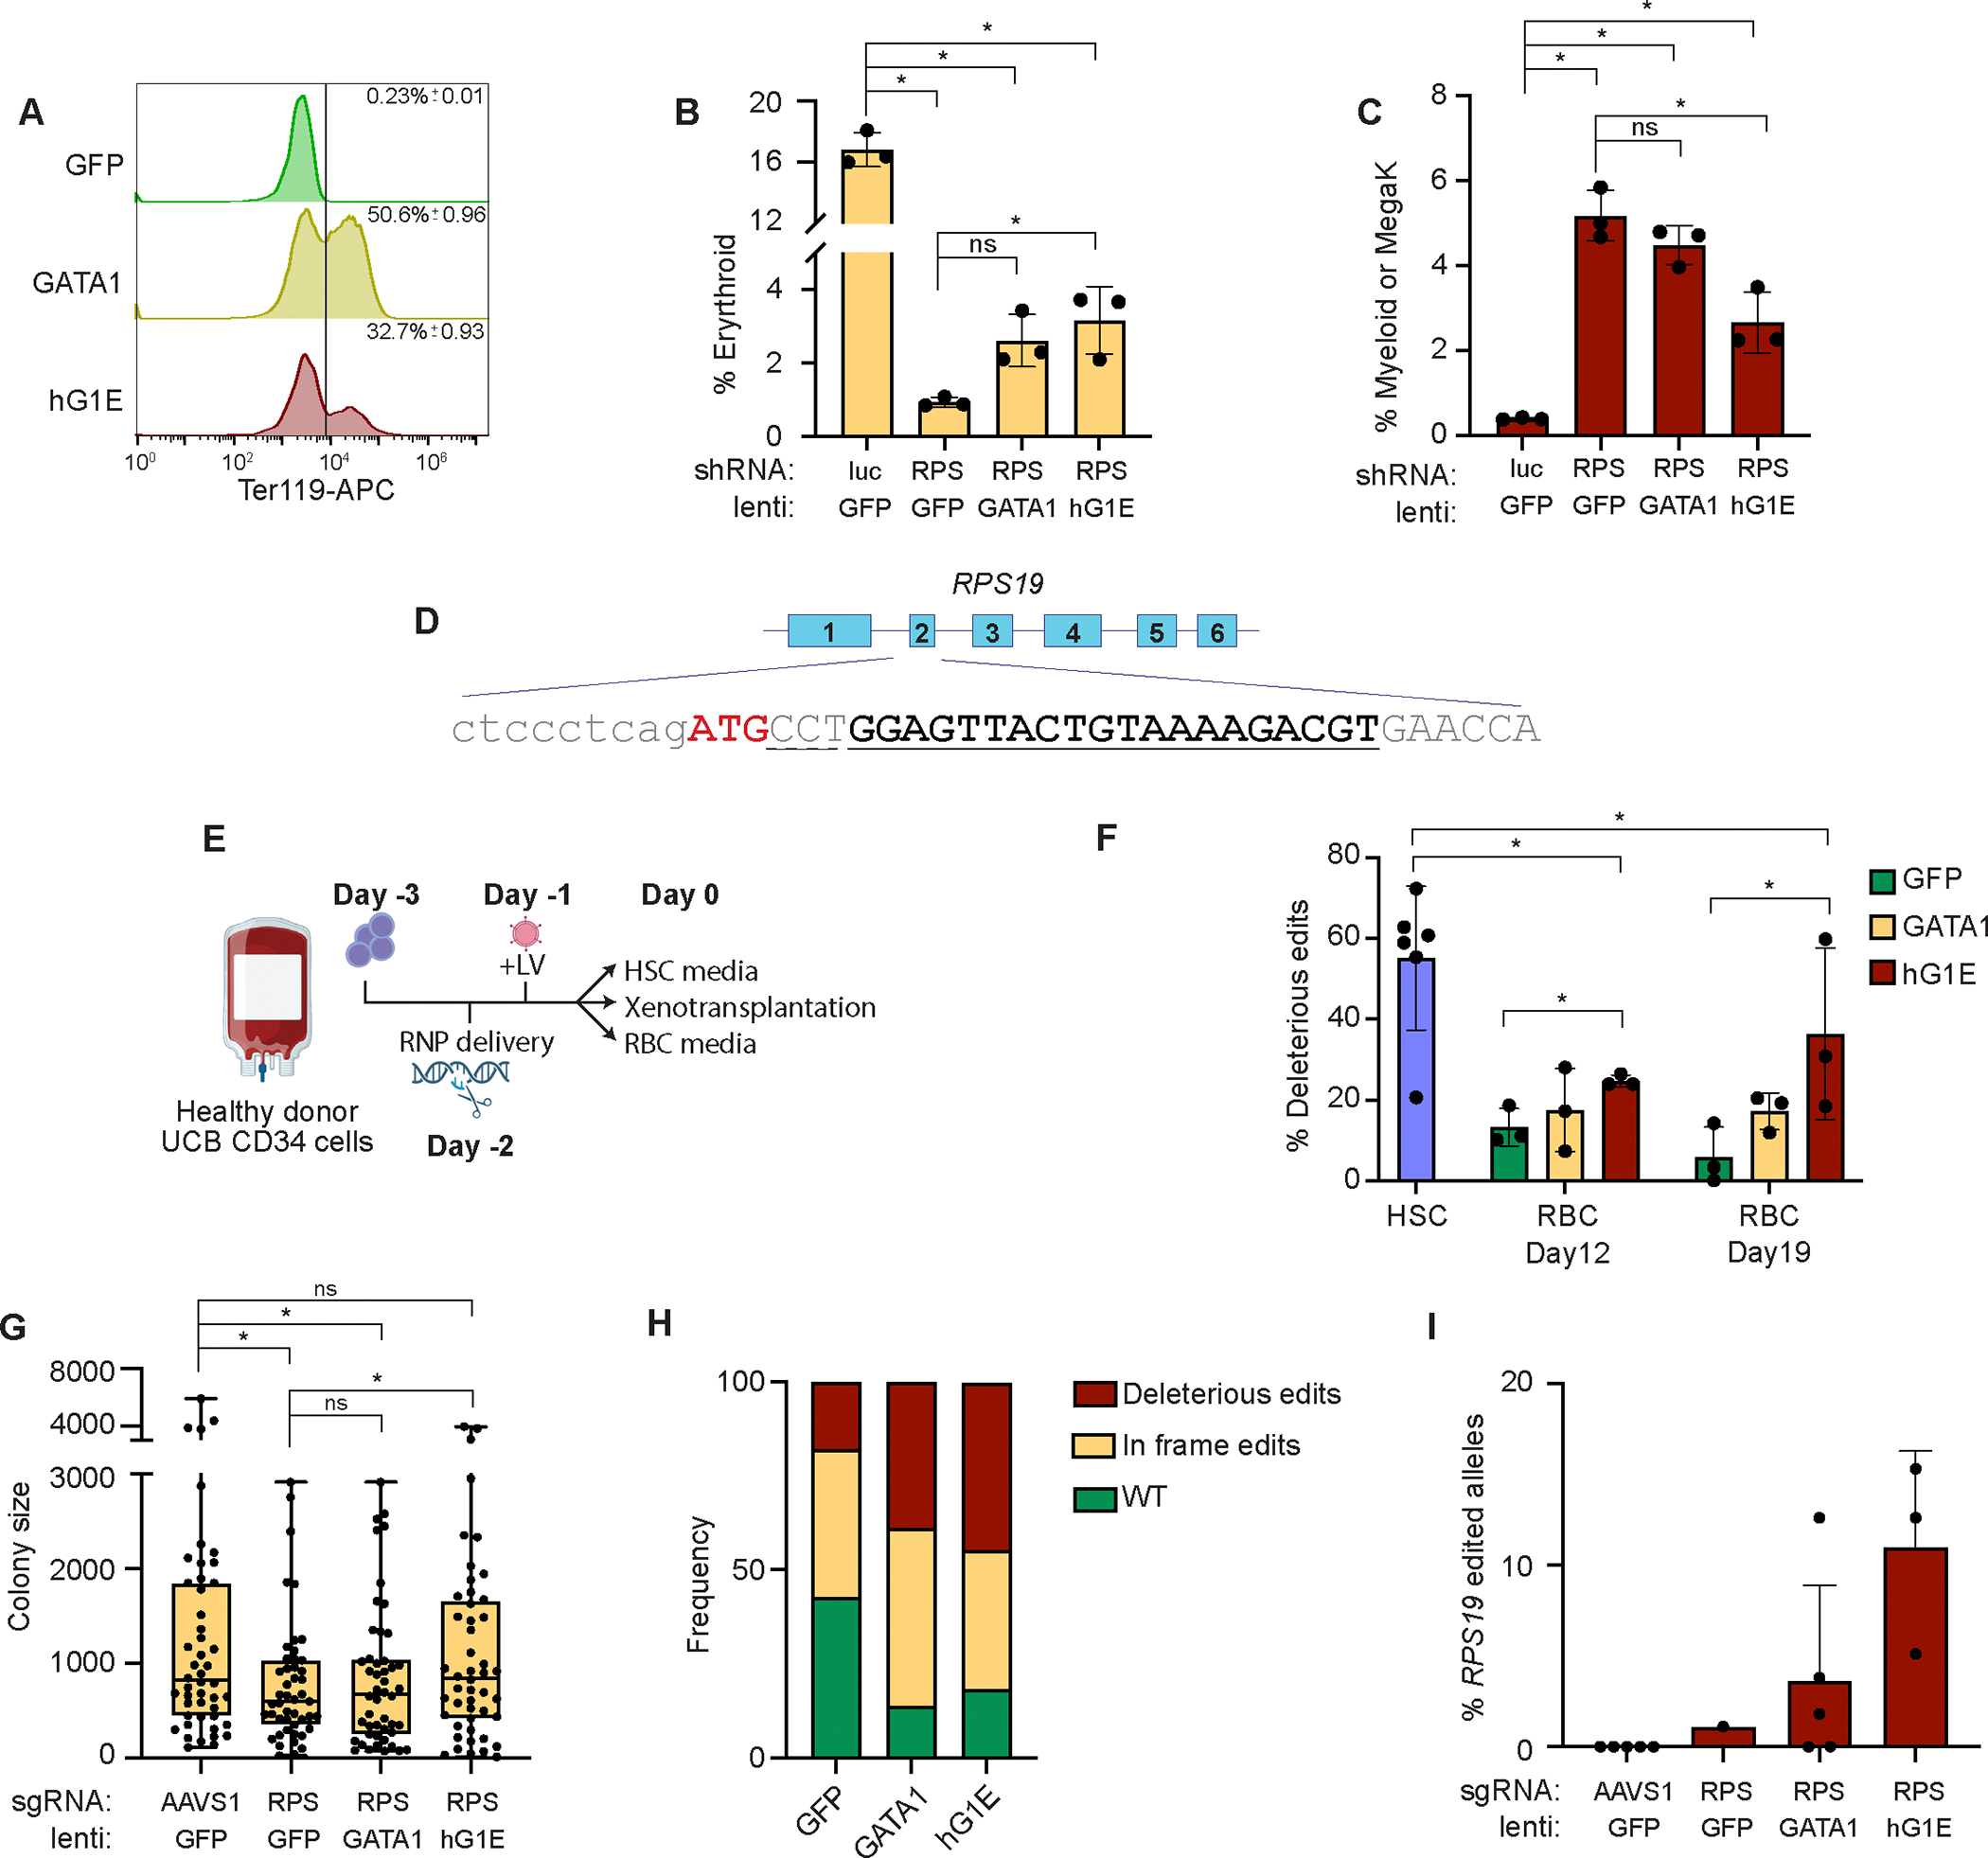
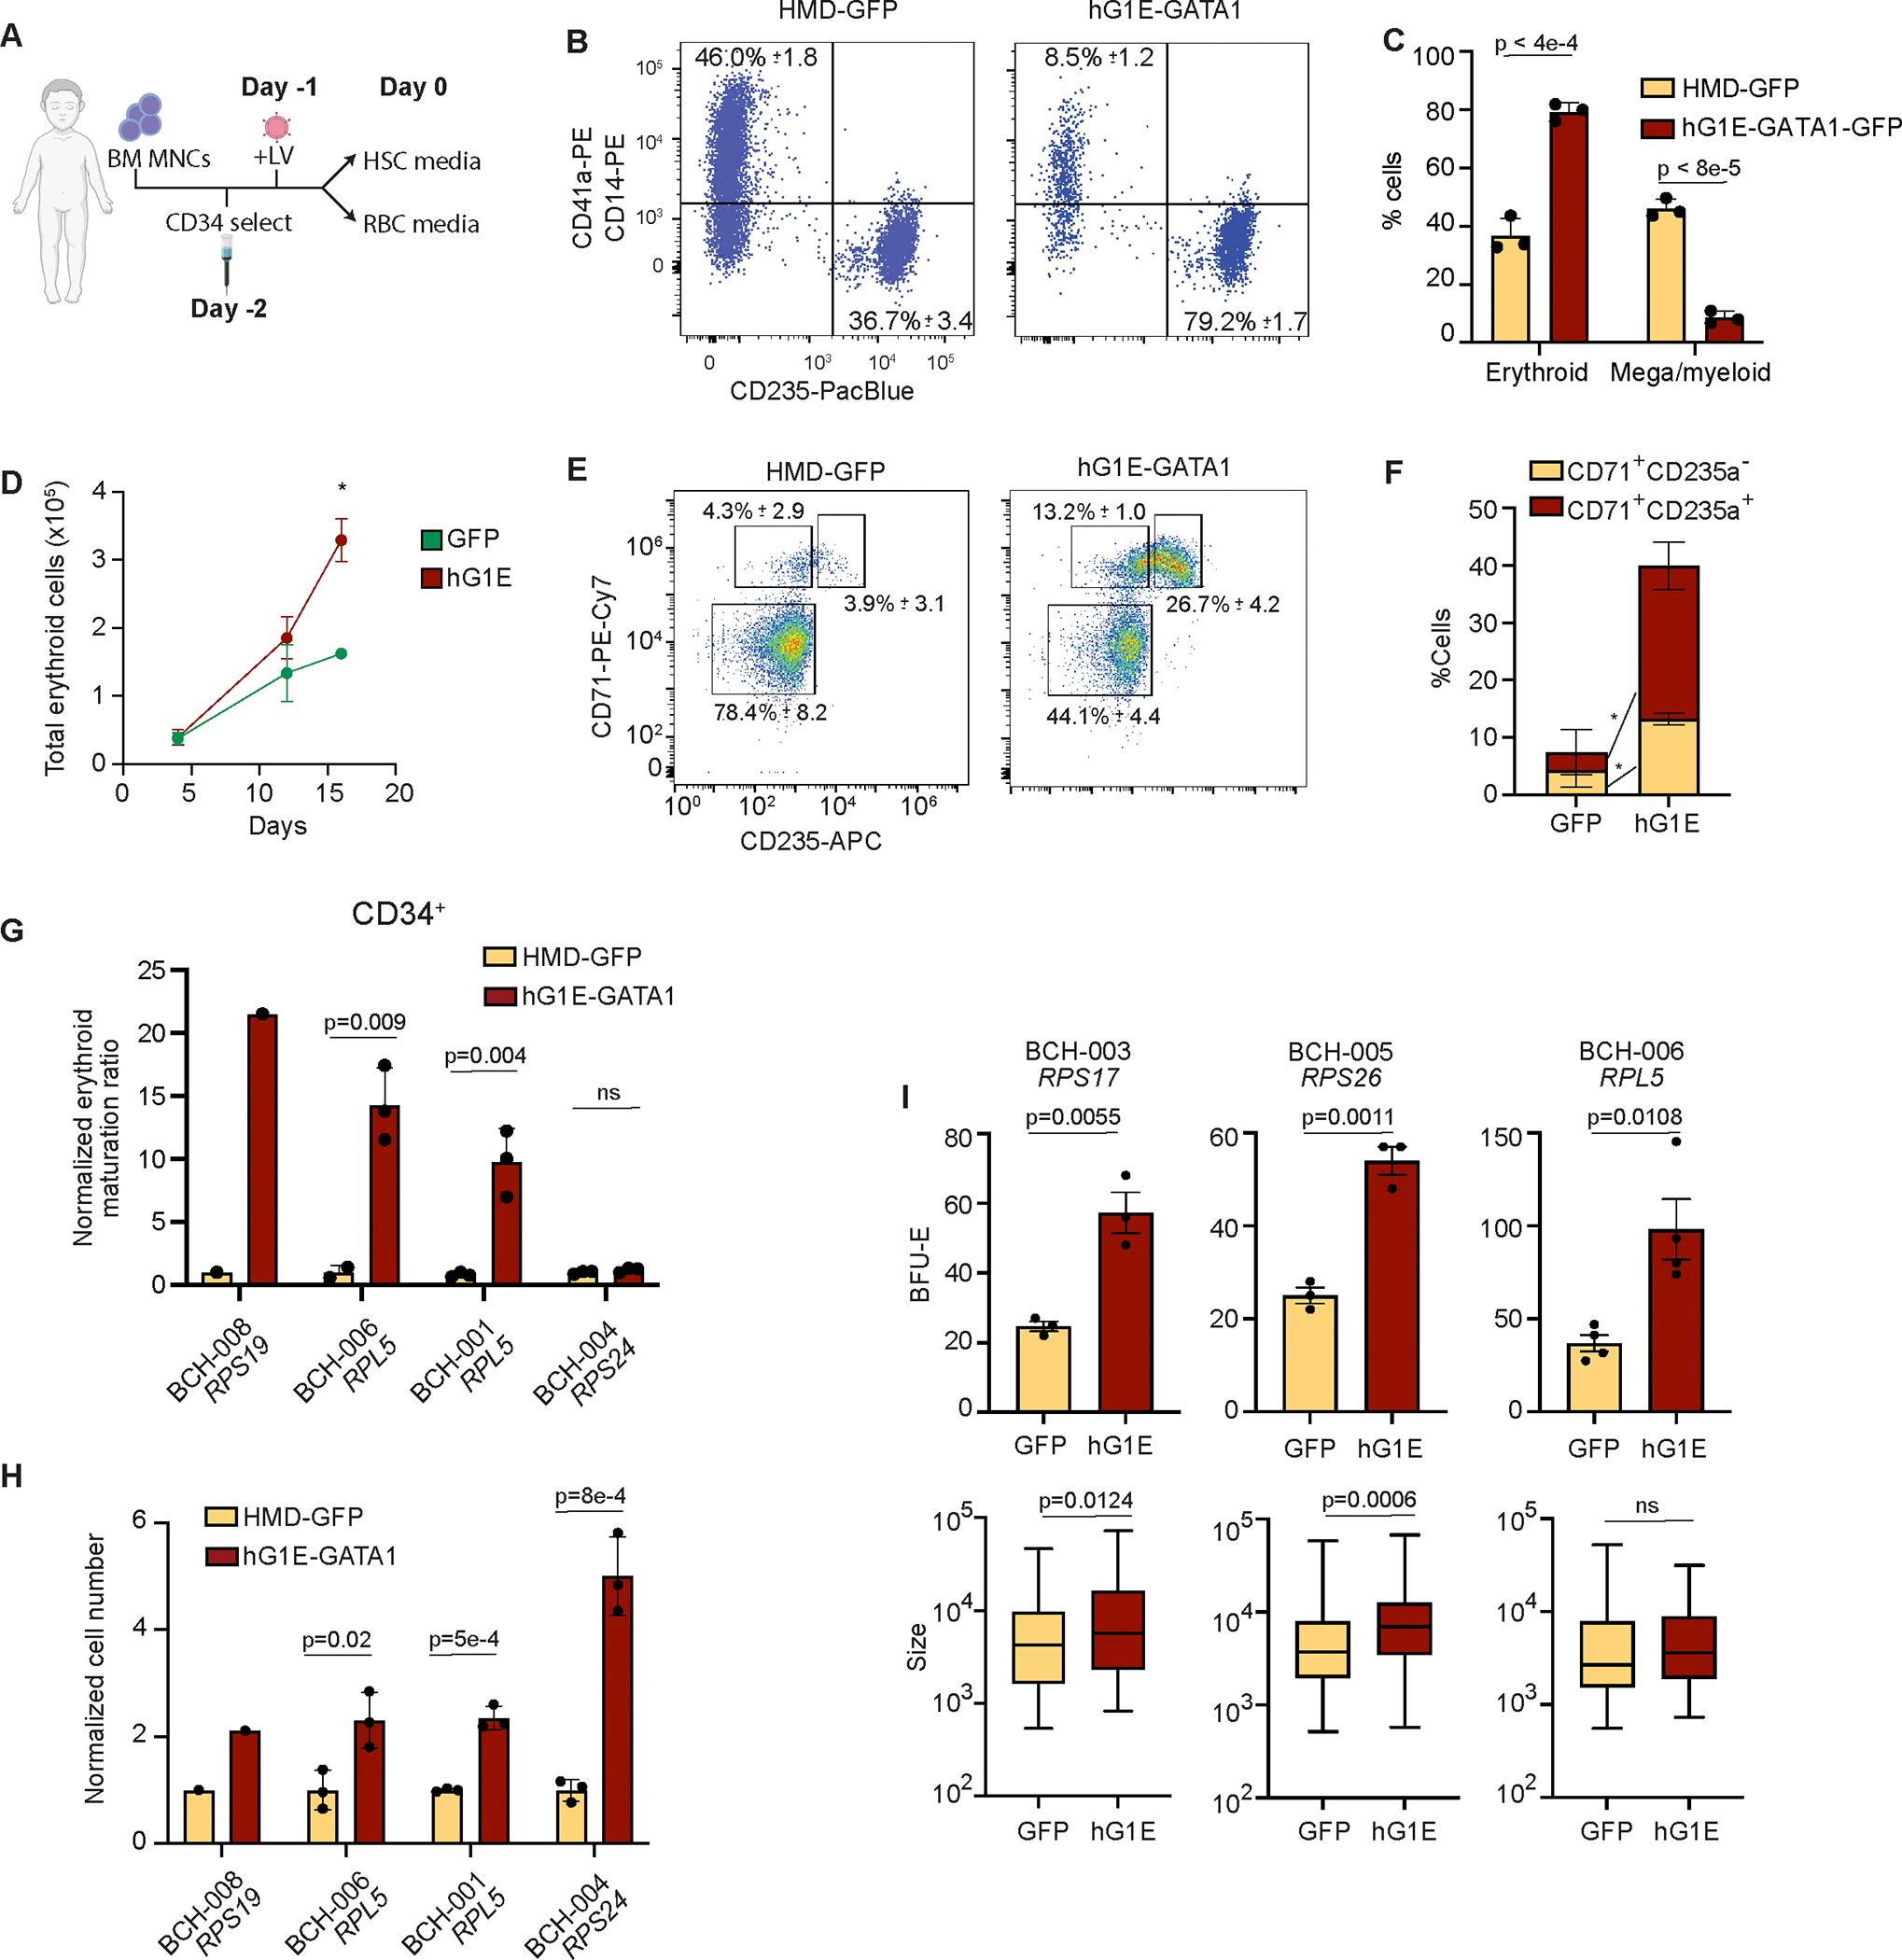
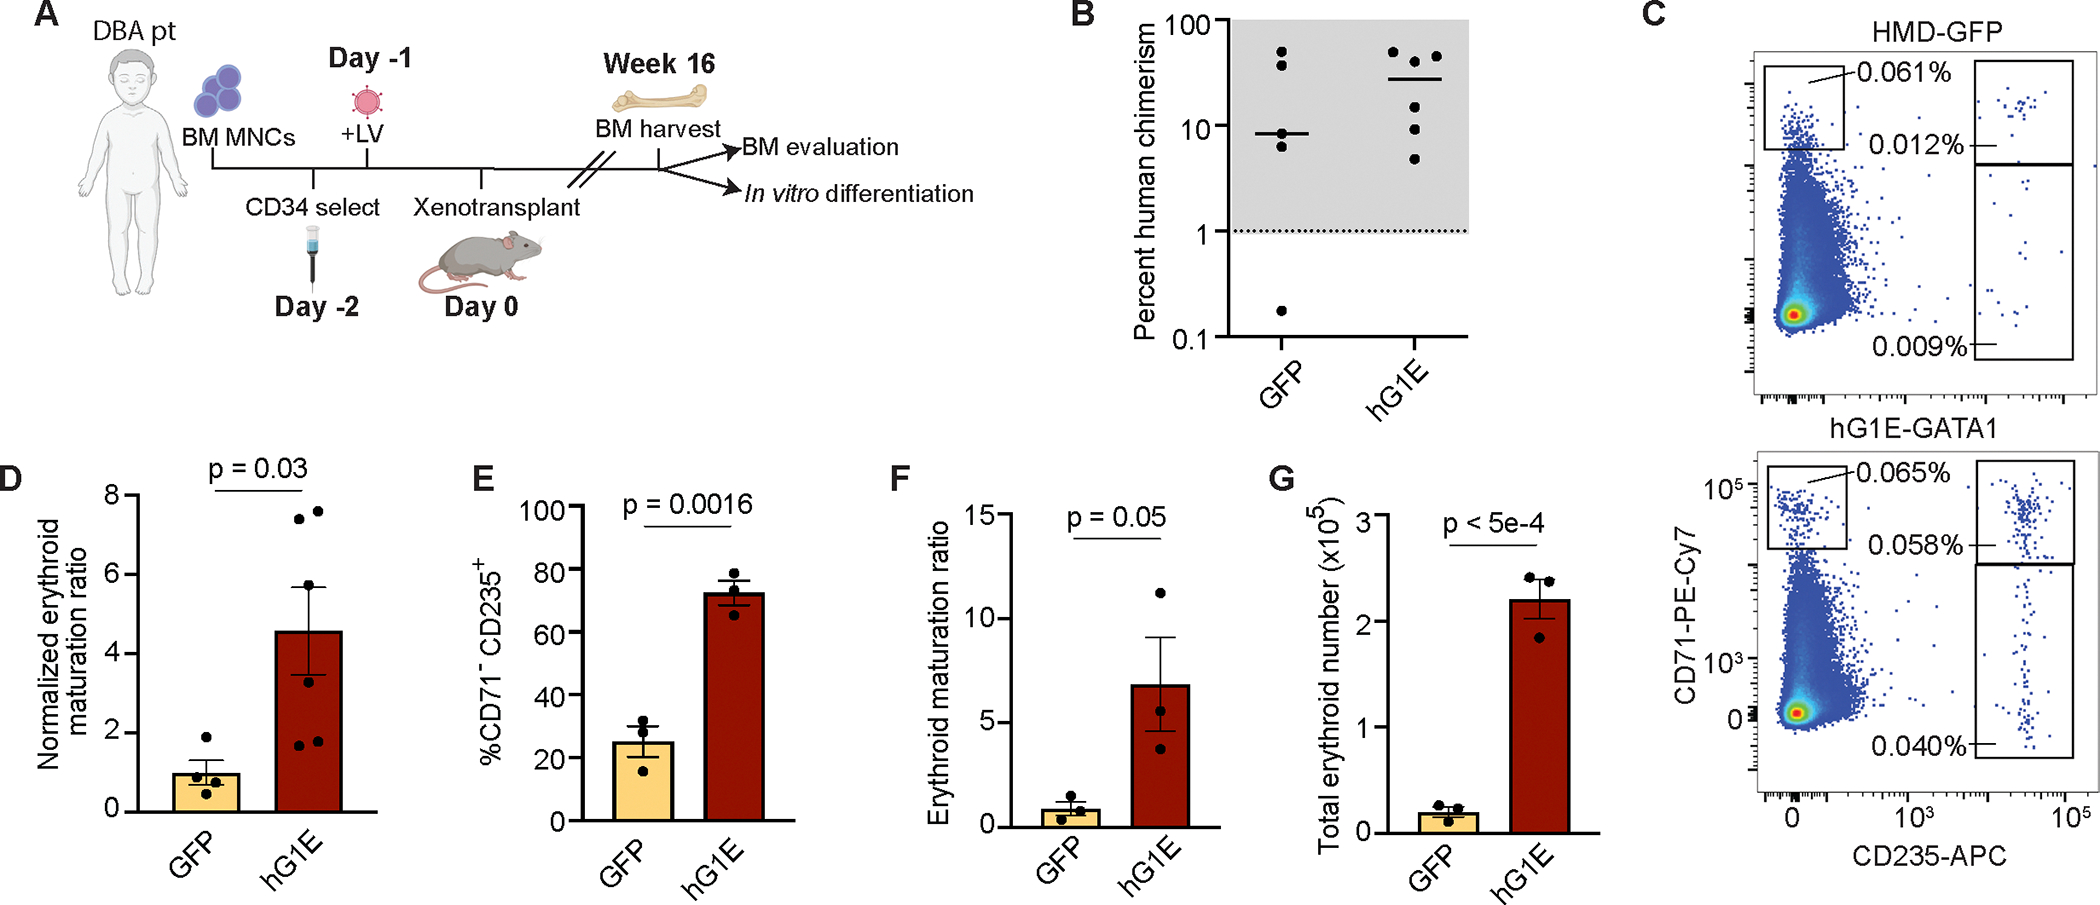
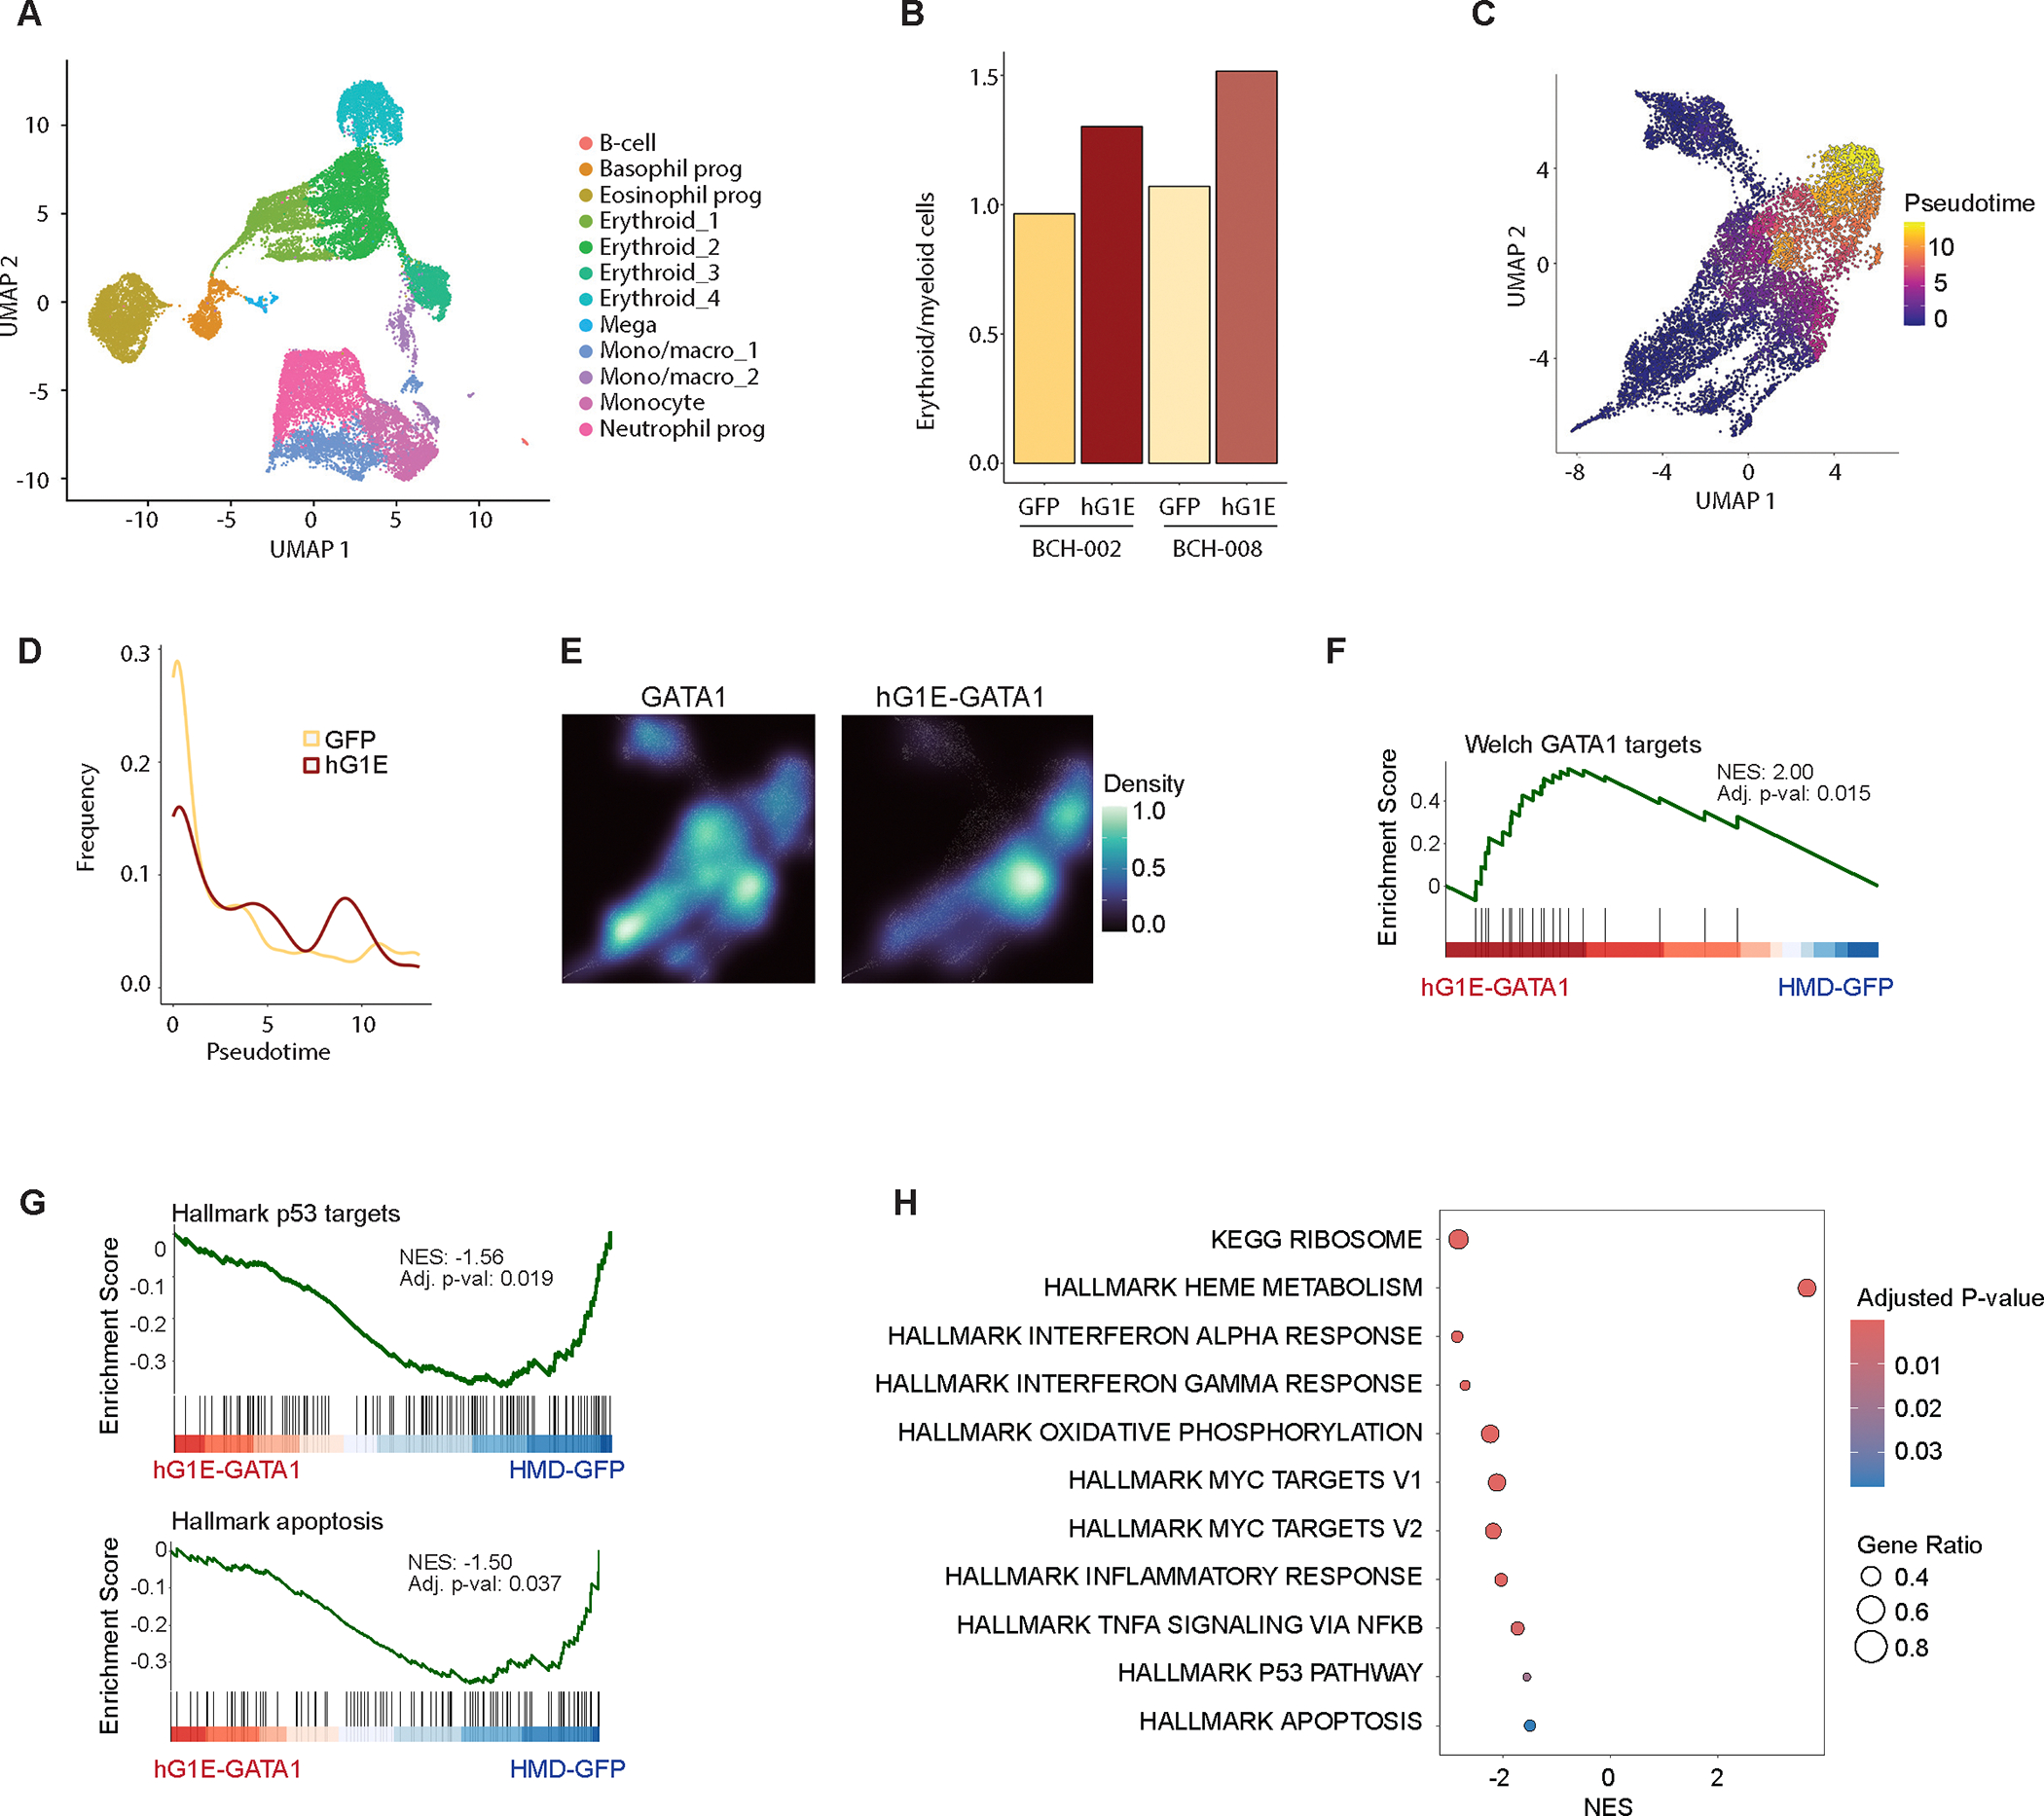
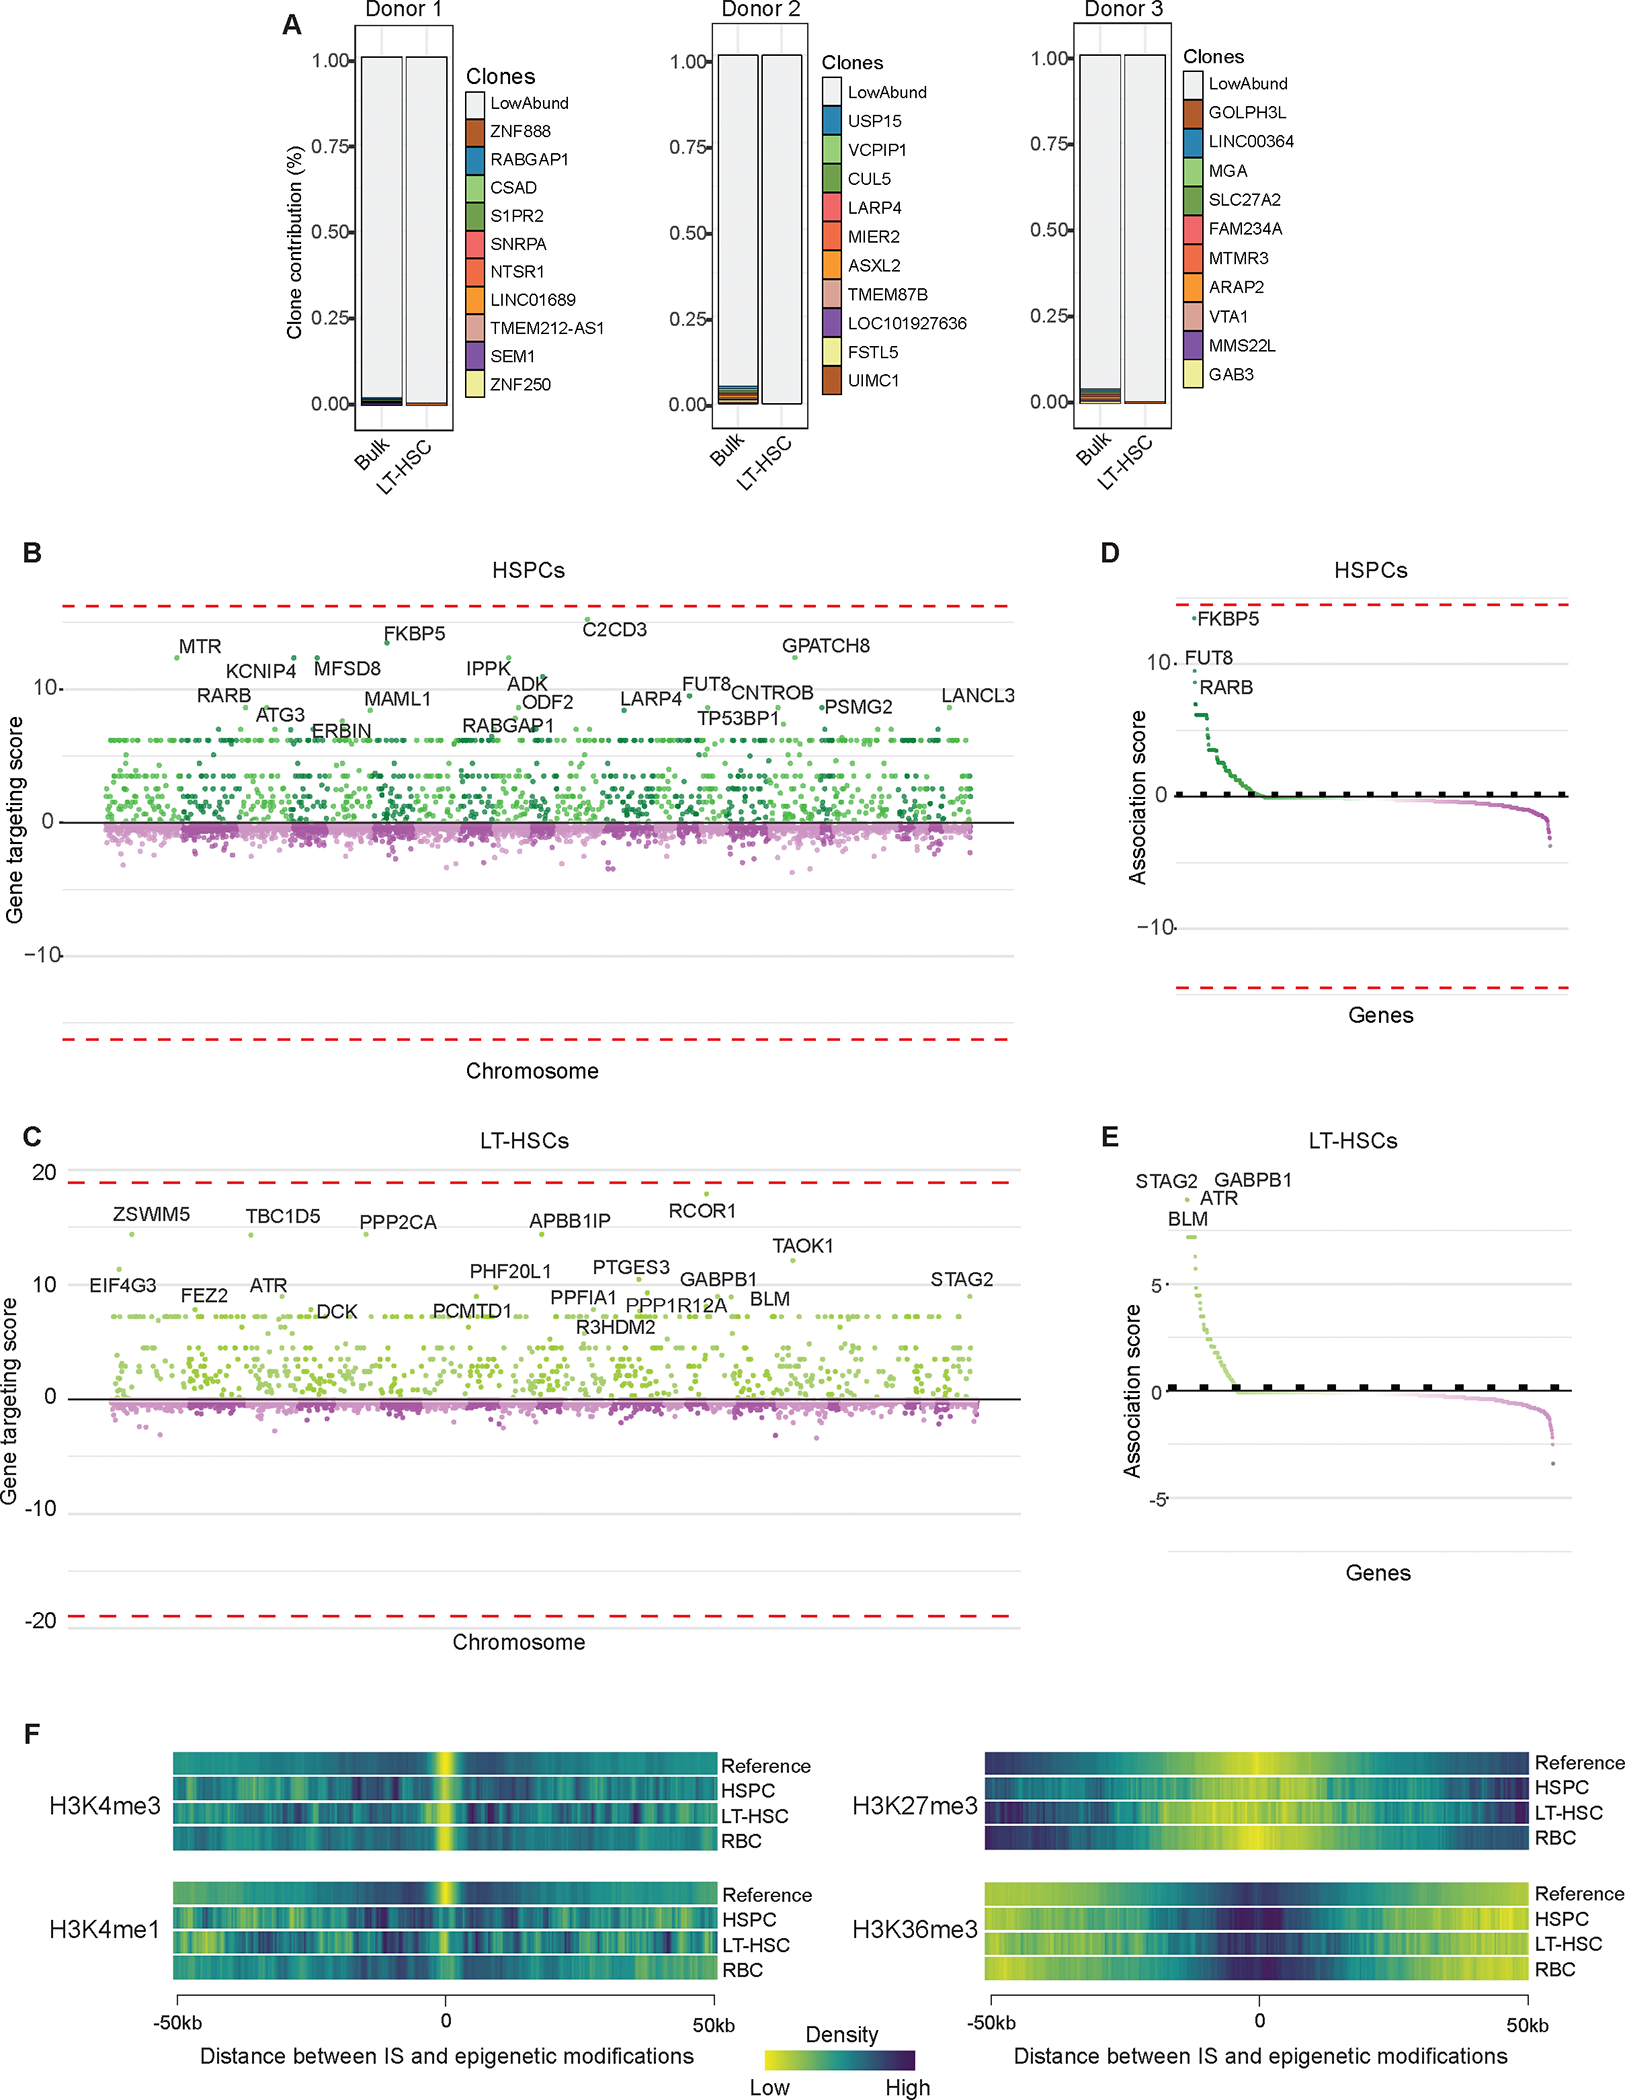
Gene therapy using hematopoietic stem and progenitor cells is altering the therapeutic landscape for patients with hematologic, immunologic, and metabolic disorders but has not yet been successfully developed for individuals with the bone marrow failure syndrome Diamond-Blackfan anemia (DBA). More than 30 mutations cause DBA through impaired ribosome function and lead to inefficient translation of the erythroid master regulator GATA1, providing a potential avenue for therapeutic intervention applicable to all patients with DBA, irrespective of the underlying genotype. Here, we report the development of a clinical-grade lentiviral gene therapy that achieves erythroid lineage-restricted expression of GATA1. We show that this vector is capable of augmenting erythropoiesis in DBA models and diverse patient samples without impacting hematopoietic stem cell function or demonstrating any signs of premalignant clonal expansion. These preclinical safety and efficacy data provide strong support for the first-in-human universal gene therapy trial for DBA through regulated GATA1 expression.

Keywords: Diamond-Blackfan anemia; GATA1; bone marrow failure; enhancer; erythropoiesis; gene therapy; hematopoiesis; hematopoietic stem cell; hypoplastic anemia; lentivirus.


Conflict of interest statement

Declaration of interests V.G.S. serves as an advisor to Ensoma, unrelated to the present work. R.A.V. and V.G.S. are named as inventors on patent PCT/US2020/036600 filed by Boston Children’s Hospital related to this approach.

Figures

Figure 1.
Figure 1.. Endogenous enhancer elements drive erythroid-restricted transgene expression.
A. GATA1 mRNA expression (cpm) during normal human erythroid differentiation from umbilical cord blood or peripheral mobilized CD34-selected HSPCs. Stage of erythroid maturation arrest in DBA is shown. B. Accessible chromatin upstream of the GATA1 transcriptional start site in HSCs and progenitors undergoing erythroid differentiation. Peak height is scaled to the highest peak and the displayed range is from 0–1.8 in each population. The three differentially accessible regions marked were used to construct the hG1E element. C. Lentiviral constructs designed to achieve erythroid-restricted expression. IRES – internal ribosome entry site, GFP – green fluorescent protein, SPA – synthetic polyA. D. FACS gating strategy to enrich for LT-HSCs on day 6 of HSC culture. LT-HSCs are defined as CD34+ CD45RA CD90+ CD133+ EPCR+ ITGA3+. E. Representative FACS plots from the three phase in vitro erythroid differentiation of transduced human HSPCs. Differentiation was assessed by expression of CD71 and CD235a by flow cytometry at the indicated days of erythroid culture. F. Differential transgene expression in HSCs and erythroid progenitors. The percentage of GFP positive cells from the bulk population (bulk HSCs) or the LT-HSC population on day 6 of HSC culture, or from the CD71+CD235a+ population (RBC) on day 6 of erythroid culture was determined by flow cytometry. n = 3 independent replicates, mean and S.E.M. are shown. G. Ratio of GFP expression in erythroid progenitors compared to LT-HSCs. Percentage of cells expressing GFP was compared between the CD71+CD235a+ population on day 6 of erythroid culture and the LT-HSC population on day 6 of HSC culture. n = 3 independent replicates, mean and S.E.M. are shown. Two-sided Student t-test was used for comparisons, and P values are shown. H. Ratio of GFP expression during terminal differentiation. Percentage of cells expressing GFP was compared between the CD71CD235a+ population on day 18 of erythroid culture and CD71+CD235a+ erythroid progenitors on day 6. n = 3 independent replicates, mean and S.E.M. are shown. Two-sided Student t-test was used for comparisons, and P values are shown. See also Figure S1.
Figure 2.
Figure 2.. Regulated GATA1 expression preserves erythroid maturation and HSC function.
A. Intracellular GATA1 protein level in single erythroid progenitors. On day 9 of erythroid culture, cells were fixed, permeabilized, and stained with antibodies against CD71 and CD235 as well as GATA1 and analyzed by flow cytometry. Level of GATA1 protein per cell is proportional to the fluorescence intensity displayed along the x-axis. B. Intracellular GATA1 expression following hG1E-GATA1 treatment. In each indicated erythroid population on day 9, the percentage of cells that express GATA1 (top) and the mean fluorescence intensity of GATA1 (bottom) are displayed. n = 3 independent replicates, mean and S.E.M. are shown. Two-sided Student t-test was used for comparisons. * P <0.05, ns - not significant. C. Erythroid differentiation after hG1E-GATA1-IRES-GFP treatment. On day 6 of erythroid culture, the stage of differentiation was assessed by flow cytometry. The percentage of CD71+CD235a cells and CD71+CD235a+ cells are shown. n = 3 independent replicates, mean and S.E.M. are shown. Two-sided Student t-test was used for comparisons. P values are shown. ns - not significant. D. Percentage of enucleated cells on day 21 of erythroid culture. Percentage of CD71 CD235a+ cells that exclude Hoechst dye is displayed. n = 3 independent replicates, mean and S.E.M. are shown. Two-sided Student t-test was used for comparisons. P values are shown. ns - not significant. E. Preservation of transduced cells during in vitro erythroid culture. Vector copy number (VCN) analysis was performed following hG1E-GATA1 treatment on day 7 of HSC culture and on the indicated days in erythroid culture. n = 3 independent replicates of erythroid culture from the same pool of transduced cells. Mean and S.E.M. are shown. F. Effect of hG1E-GATA1 treatment on engraftment. 200,000 cells were transplanted into NBSGW mice after transduction with the indicated vector. Human chimerism was determined by flow cytometry of recipient bone marrow samples by comparing the number of cells expressing human or mouse CD45. Two-sided Student t-test was used for comparisons. ns - not significant. G. Extreme limiting dilution plot with estimated stem cell frequency. 25,000–350,000 human HSPCs were transplanted per recipient mouse after transduction. Data were generated over three independent experiments using the hG1E-GATA1 vector compared to either mock treated or HMD-GFP treated cells. Successful engraftment was defined as human chimerism of at least 0.1%. Estimated stem cell frequency was calculated using ELDA. H. Lineage-restricted GATA1 expression in vivo. Bone marrow was collected from primary xenotransplant recipients and sorted for bulk human cells (CD45+), erythroid progenitors (CD71+), HSPCs (CD34+), B-cells (CD19+), and myeloid cells (CD33+). GATA1 expression normalized to bulk human cells of the same recipient is shown. n = 3–5 xenotransplant recipients as shown, mean and S.E.M. are shown. Two-sided Student t-test was used for comparisons. P values are shown. ns - not significant. I. Preservation of transduced cells in vivo. Cells from the transduction in Fig. 2E were transplanted into NBSGW mice and bone marrow samples were harvested at 16 weeks. VCN analysis was performed in human cell subpopulations, defined by the following human lineage markers: Human, CD45+; HSPC, CD34+, Erythroid, CD71+. J. - K. Quantification of colonies in serial replating assay after xenotransplantation. Human cells harvested from xenotransplant recipients were used for serial CFU quantification. In each round, 5e4 cells were plated in methylcellulose. BFU-E colony number (J.) and CFU-G, CFU-M, and CFU-GM colony number (K.) were quantified after 9 days using StemVision with manual verification. n = 3–6 independent replicates as shown by number of markers. Mean and S.E.M. are shown. Two-sided Student t-test was used for comparisons. P values are shown. ns - not significant. See also Figure S2.
Figure 3.
Figure 3.. hG1E-GATA1 stimulates erythroid output in DBA models
A. Differentiation of Gata1−/− G1E cells. G1E cells were treated with the indicated vectors and Ter119 expression of GFP+ cells was determined by flow cytometry on day 3. Plots include data from three independent replicates, Mean and S.E.M. are displayed. B. Rescue of erythroid differentiation after RPS19 knockdown. Human HSPCs were co-infected with the indicated shRNA lentiviruses targeting luciferase (Luc) or RPS19 (RPS), and HMD-GFP (GFP), HMD-GATA1 (GATA1), or hG1E-GATA1 (hG1E). Percentage of CD235a+ erythroid cells on day 6 of erythroid culture are displayed. n = 3 independent replicates, mean and S.E.M. are shown. Two-sided Student t-test was used for comparisons. * P < 0.05, ns - not significant. C. Restoration of lineage-skewing after RPS19 knockdown. Cells from Fig. 3B were stained for myeloid (CD14) or megakaryocyte (CD41a) markers on day 6 of erythroid culture. n = 3 independent replicates, mean and S.E.M. are shown. Two-sided Student t-test was used for comparisons. * P < 0.05, ns - not significant. D. CRISPR editing of RPS19. Exon structure and partial DNA sequence of RPS19 is displayed. sgRNA binding site is indicated in bold and underlined, and the dashed line indicated the PAM site. The ATG start codon is shown in red. Deleterious CRISPR edits are defined as indels causing frameshift or disruption of the ATG. E. Schematic of experimental overview. UCB: umbilical cord blood, RNP: CRISPR/Cas9 ribonuclear protein, LV: lentivirus. F. Preservation of deleterious RPS19 edits in bulk culture. On day 6 in HSC culture or the indicated days in erythroid culture, RPS19 genotyping was performed by PCR and Sanger sequencing. Deleterious edits are defined as in Fig. 3D. GFP: HMD-GFP, GATA1: HMD-GATA1, hG1E: hG1E-GATA1-IRES-GFP. n = 3–6 independent replicates as represented by number of symbols. Mean and S.E.M. are shown. Two-sided Student t-test was used for comparisons. * P < 0.05 G. Erythroid colony size after CRISPR treatment and lentiviral infection. 500 cells per replicate from the samples in Fig. 3F were plated in methylcellulose and expanded for 12 days. Colonies were imaged and identified using StemVision with manual verification. BFU-E colony size was quantified by determination of pixel density using ImageJ. Each symbol represents an individual burst forming unit – erythroid (BFU-E) colony. RPS: RPS19, GFP: HMD-GFP, GATA1: HMD-GATA1, hG1E: hG1E-GATA1-IRES-GFP. Mean and S.E.M. are shown. Two-sided Student t-test was used for comparisons. * P < 0.05, ns - not significant. H. Genotyping of erythroid colonies. Genomic DNA was collected from individual BFU-E colonies from the RPS19 edited samples from Fig. 3G. RPS19 genotyping was performed by PCR amplification and Sanger sequencing. Frequency of the indicated editing outcomes is displayed for each experimental group treated with the indicated lentivirus. Number of genotyped colonies: GFP: 28, GATA1: 36, hG1E: 38. I. Genotyping of human cells after xenotransplantation. Human CD45+ cells were purified by FACS from the bone marrows of recipient mice 16 weeks after xenotransplantation with CRISPR-edited and vector-treated human HSPCs. Genotyping of RPS19 was performed by PCR and Sanger sequencing in samples from mice with human chimerism >1%. Individual mice are represented by the symbols in each group. Mean and S.E.M. are shown. See also Figure S3.
Figure 4.
Figure 4.. Stimulation of erythroid output in primary DBA patient samples
A. Schematic of experimental overview. BM MNC: bone marrow mononuclear cells, LV: lentivirus. B.– C. In vitro erythroid differentiation of DBA patient sample. CD34-selected HSPCs from patient BCH-001 were treated with the indicated vector and cultured in erythroid differentiation media. On day 16 of erythroid culture, samples were analyzed for expression of erythroid marker CD235a or megakaryocyte (CD41a) and myeloid (CD14) markers. Mean and S.E.M. are shown. Two-sided Student t-test was used for comparisons. P values are shown. D. Total erythroid cell number. Erythroid cell number (calculated by multiplying total cell number by percent cells expressing CD71, CD235a or both) was quantified using Trypan blue exclusion on the indicated days. Mean and S.E.M. are shown. Two-sided Student t-test was used for comparisons. * P = 0.008. Absent error bars are obscured by the size of the markers. E.- F. Erythroid differentiation of gene therapy treated sample from DBA patient BCH-006. On day 7 of erythroid culture, stage of erythroid differentiation was assessed by analysis of surface expression of CD71 and CD235a. Mean and S.E.M. from three biological replicates are displayed. Two-sided Student t-test was used for comparisons. * P < 0.008. G. Normalized erythroid ratio following hG1E-GATA1 treatment. On day 6 of erythroid culture, the erythroid maturation ratio was calculated by dividing the percentage of CD71+CD235a+ cells by the percentage of CD71+CD235a cells and was then normalized to the erythroid maturation ratio of the HMD-GFP treated control. Number of markers represents the number of replicates (1 or 3). Mean and S.E.M. are shown where appropriate. Two-sided Student t-test was used for comparisons. P values are shown, ns – not significant. H. Total cell number during erythroid differentiation. Total cell number was quantified from CD34-selected DBA patient samples treated with the indicated vectors using Trypan blue exclusion on day 16 and normalized to HMD-GFP treated sample from the same patient. Mean and S.E.M. are shown where appropriate. Two-sided Student t-test was used for comparisons. P values are shown. I. Quantification of erythroid colony number and size. BM MNCs from the indicated patient samples were treated with HMD-GFP or hG1E-GATA1 and 30,000 cells per replicate were plated in methylcellulose. On day 12 of methylcellulose culture, burst forming-erythroid (BFU-E) colonies were quantified by StemVision. Colony size was measured by pixel density using ImageJ. Colony number (top) was determined as the mean of 3 or 4 independent replicates as shown and is displayed with S.E.M. Mean colony size (bottom) is displayed with S.E.M. Two-sided Student t-test was used for comparisons. P values are shown, ns – not significant. See also Figure S4 and Table S1.
Figure 5.
Figure 5.. Increased erythroid output in primary DBA patient samples in vivo
A. Schematic of experimental overview. BM MNC: bone marrow mononuclear cells, LV: lentivirus. B. Evaluation of human chimerism. After xenotransplantation with CD34-selected and gene therapy treated cells from DBA patient BCH-006, human chimerism in the bone marrow was determined by comparing the percentage of human CD45+ cells to the percentage of mouse CD45+ cells by flow cytometry. Each marker represents one recipient mouse. Mice with human chimerism >1% were used in subsequent analyses. C. Representative flow cytometry plots of in vivo human erythroid differentiation in the bone marrow of recipient mice. Whole bone marrow cells harvested at 16 weeks without erythrocyte depletion were stained with the indicated human-specific antibodies and analyzed by flow cytometry. Committed erythroid progenitors have high expression of CD71 and maturing erythroid progenitors express CD235. D. Increased erythroid maturation in vivo. Erythroid maturation ratio was calculated by dividing the percentage of CD235a+ cells by the percentage of CD71+CD235a cells and was then normalized to the erythroid maturation ratio of the HMD-GFP treated control. Number of markers represents the number of replicates. Mean, S.E.M., and P value are shown. Two-sided Student t-test was used for comparisons. E.- G. Erythroid output of xenotransplanted samples. Human CD34+ HSPCs from the indicated primary xenotransplant cohorts were combined and subjected to in vitro erythroid differentiation. Percentage of CD71CD235a+ cells on day 21 are shown (E.). Erythroid maturation ratio was calculated by dividing the percentage of CD235a+ cells by the percentage of CD71+CD235a cells and was then normalized to the erythroid maturation ratio of the HMD-GFP treated control (F.). Total erythroid number was calculated by multiplying total cell number (Fig. S5D) by the percentage of cells expressing CD235a on day 21 (G.). n = 3 independent replicates in in vitro culture. Mean, S.E.M., and P values are shown. Two-sided Student t-test was used for comparisons. See also Figure S5.
Figure 6.
Figure 6.. Reversal of transcriptional dysregulation upon hG1E-GATA1 treatment
A. Uniform manifold approximation and projection (UMAP) projection of cultured cells from DBA patients BCH-002 and BCH-008 after treatment with HMD-GFP or hG1E-GATA1, at day 10 of in vitro erythroid differentiation. Clusters were annotated based on the expression of the top 10 marker genes. B. Ratio of erythroid cells to myeloid cells as determined by transcriptional signatures of single cells from DBA patients after HMD-GFP or hG1E-GATA1 treatment. C. UMAP plot of erythroid-filtered cells colored by pseudotime trajectory indicating the degree of erythroid maturation. D. Density of erythroid cells ordered along the pseudotime axis following HMD-GFP or hG1E-GATA1 treatment. E. UMAP projection of the density estimate of erythroid cells expressing endogenous GATA1 (left) or hG1E-GATA1 transgene (right). The displayed density plots are derived from the same erythroid-filtered UMAP projections shown in Fig. 6C and Fig. S6B, C. F.- G. Gene set enrichment analysis (GSEA) plots showing (F.) enrichment of GATA1 target genes and (G.) depletion of Hallmark p53 pathway genes (top) and Hallmark apoptosis genes (bottom) in erythroid cells following hG1E-GATA1 treatment. Normalized enrichment score (NES) and p-value are shown. The Kolmogorov Smirnov (K-S) test was used to determine the significance of GSEA. H. Bubble plot of selected pathways from the Hallmark and KEGG collections that are differentially expressed in hG1E-GATA1 treated DBA patient erythroid cells. Normalized enrichment score (NES) is displayed on the x-axis. The color represents the adjusted P value, and the size of the bubbles shows the Gene ratio, defined as the proportion of differentially expressed genes relative to the size of the gene set. See also Figure S6.
Figure 7.
Figure 7.. Analysis of integration sites of hG1E-GATA1
A. Cumulative frequencies of integration sites of hG1E-GATA1 following transduction in bulk HSPCs and in LT-HSCs on day 7 of in vitro culture from three separate healthy donors. RefSeq names of the genes closest to integration sites are displayed. B.- C. Comparison of integration sites of hG1E-GATA1 in bulk HSPCs (B.) and LT-HSCs (C.). Integration sites were compared to the integration profile of a control lentivirus in HSPCs and sites are organized by chromosome location along the x-axis. Relative gene targeting score is shown on the y-axis. No integration sites are significantly enriched in hG1E-GATA1 treated samples (dotted lines). D.- E. Integration near cancer associated genes. Gene targeting scores of cancer-associated genes near hG1E-GATA1 integration events in bulk HSPCs (D.) and LT-HSCs (E.) are shown. No integration sites are significantly enriched in the hG1E-GATA1 treated samples (dotted lines). F. Heatmaps of the epigenetic landscape of hG1E-GATA1 integration sites. Integration sites from hG1E-GATA1 and a reference lentivirus are displayed as a function of chromosomal distance from epigenetic modifications derived from ChIP-seq data in human CD34+ cells Epigenetic modifications represent the following chromosomal features: H3K4me3 – active promoter, H3K4me1 – active enhancers, H3K27me3 – repressed enhancers and promoters, H3K36me3 – actively transcribed gene bodies. See also Figure S7 and Table S2.

References

    1. Esrick EB, Lehmann LE, Biffi A, Achebe M, Brendel C, Ciuculescu MF, Daley H, MacKinnon B, Morris E, Federico A, et al. (2021). Post-transcriptional genetic silencing of BCL11A to treat sickle cell disease. N. Engl. J. Med. 384, 205–215. 10.1056/NEJMoa2029392. - DOI - PMC - PubMed
    1. Aiuti A, Pasinelli F, and Naldini L (2022). Ensuring a future for gene therapy for rare diseases. Nat. Med. 28, 1985–1988. 10.1038/s41591-022-01934-9. - DOI - PubMed
    1. Ferrari G, Thrasher AJ, and Aiuti A (2021). Gene therapy using haematopoietic stem and progenitor cells. Nat. Rev. Genet. 22, 216–234. 10.1038/s41576-020-00298-5. - DOI - PubMed
    1. Voit RA, and Corey SJ (2023). Gene therapy for congenital marrow failure syndromes - no longer grasping at straws? Haematologica. 10.3324/haematol.2023.283462. - DOI - PMC - PubMed
    1. Landry I (2021). Racial disparities in hematopoietic stem cell transplant: a systematic review of the literature. Stem Cell Investig 8, 24. 10.21037/sci-2021-058. - DOI - PMC - PubMed

Substances