. 2024 Nov 12;8(1):e202302446.
doi: 10.26508/lsa.202302446. Print 2025 Jan.

Divergent roles of RIPK3 and MLKL in high-fat diet-induced obesity and MAFLD in mice

Affiliations

Divergent roles of RIPK3 and MLKL in high-fat diet-induced obesity and MAFLD in mice

Hazel Tye et al. Life Sci Alliance. .

Abstract

Cell death frequently occurs in the pathogenesis of obesity and metabolic dysfunction-associated fatty liver disease (MAFLD). However, the exact contribution of core cell death machinery to disease manifestations remains ill-defined. Here, we show via the direct comparison of mice genetically deficient in the essential necroptotic regulators, receptor-interacting protein kinase-3 (RIPK3) and mixed lineage kinase domain-like (MLKL), as well as mice lacking apoptotic caspase-8 in myeloid cells combined with RIPK3 loss, that RIPK3/caspase-8 signaling regulates macrophage inflammatory responses and drives adipose tissue inflammation and MAFLD upon high-fat diet feeding. In contrast, MLKL, divergent to RIPK3, contributes to both obesity and MAFLD in a manner largely independent of inflammation. We also uncover that MLKL regulates the expression of molecules involved in lipid uptake, transport, and metabolism, and congruent with this, we discover a shift in the hepatic lipidome upon MLKL deletion. Collectively, these findings highlight MLKL as an attractive therapeutic target to combat the growing obesity pandemic and metabolic disease.


Conflict of interest statement

JM Hildebrand, JM Murphy, and AL Samson contribute to, and KE Lawlor has consulted for, a project developing necroptosis inhibitors with Anaxis Pharma Pty Ltd. All other authors have no competing interests to declare.

Figures

None
Graphical abstract
Figure S1.
Figure S1.. NLRP3 inflammasome is required for palmitate-induced IL-1β activation in LPS-primed macrophages.
(A, B, C, D) WT, Nlrp3−/−, and Casp1−/− BMDMs were pretreated with and without LPS (50 ng/ml) for 3 h and treated with 300–600 μM palmitate conjugated to BSA (PA-BSA) or BSA alone (equivalent to 600 μM BSA amount) for a further 18–20 h. (A) IL-1β and (C) TNF levels were measured in cell supernatants by ELISA. Data shown are the mean ± SD of n = 3 independent biological experiments with four to five technical replicates averaged per experiment. (B) Cell lysates and supernatants were analyzed by immunoblot for the indicated proteins. The results shown are representative of two independent experiments. (D) Cell viability was assessed by PI incorporation and flow cytometric analysis. Data shown are the mean ± SD of n = 3 independent biological experiments with four to five technical replicates averaged per experiment. One-way ANOVA followed by Tukey’s multiple comparison test, *P < 0.05, ****P < 0.0001. (E, F, G) WT, Nlrp3−/−, and Casp1−/− BMDMs were primed with LPS (50 ng/ml) for 3 h and treated with nigericin (10 μM) for ∼45 min. (E) Cell lysates and supernatants were analyzed by immunoblot for relevant proteins. The results shown are representative of two independent experiments. (F) IL-1β levels were measured in cell supernatants by ELISA. (G) Cell viability was assessed by PI incorporation and flow cytometric analysis. Data shown are the mean ± SD of n = 3 independent biological experiments with three technical replicates averaged per experiment. One-way ANOVA followed by Tukey’s multiple comparison test, **P < 0.01, ***P < 0.001, ****P < 0.0001.
Figure 1.
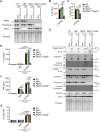
Figure 1.. NLRP3 inflammasome priming, IL-1β activation, and cell death are defective in Ripk3−/−Casp8−/− macrophages in response to LPS and palmitate.
(A, B, C, D) WT, Mlkl−/−, Ripk3−/− and Ripk3−/−Casp8−/− BMDMs were primed with or without LPS (50 ng/ml) for 3 h and treated with 600 μM PA-BSA or BSA alone, as indicated, for 18–20 h. (A) Cell lysates and supernatants were analyzed by immunoblot for specified proteins. The results shown are representative of two independent biological experiments. (B) IL-1β and (C) TNF levels were measured in cell supernatants by ELISA. Data shown are the mean ± SEM of n = 3 biological replicates and are representative of at least four independent experiments. One-way ANOVA followed by Tukey’s multiple comparison test, ****P < 0.0001. (D) Cell viability was assessed by PI uptake and flow cytometric analysis. Data shown are the mean ± SEM of n = 3 biological replicates and are representative of at least four independent experiments. One-way ANOVA followed by Tukey’s multiple comparison test, ****P < 0.0001. Source data are available for this figure.
Figure S2.
Figure S2.. Defective caspase-8–mediated inflammasome priming reduces palmitate-induced NLRP3 inflammasome activation.
(A) WT, Mlkl−/−, Ripk3−/−, and Ripk3−/−Casp8−/− BMDMs were primed with or without with LPS (50 ng/ml) for 3 h and treated with 600 μM PA-BSA or BSA alone, as indicated, for 18–20 h. Cell lysates were subjected to immunoblot for RIPK3, caspase-8, and MLKL. Results shown are representative of one experiment. (B, C) WT, Mlkl−/−, Ripk3−/−, and Ripk3−/−Casp8−/− BMDMs were primed with LPS (50 ng/ml) for 3 h and treated with nigericin (10 μM) for ∼45 min (B) IL-1β levels were measured in cell supernatants by ELISA. (C) Cell viability was assessed by PI incorporation and flow cytometric analysis. Data shown are the mean ± SEM of n = 3 biological replicates and are representative of at least four independent experiments. One-way ANOVA followed by Tukey’s multiple comparison test, **P < 0.01. (D, E, F, G) WT, Mlkl−/−, Ripk3−/−, and Ripk3−/−Casp8−/− BMDMs were primed with or without Pam3Cys (500 ng/ml) for 3 h and treated with 600 μM PA-BSA or BSA alone, as indicated, for 18–20 h. (D) IL-1β and (F) TNF levels were measured in cell supernatants by ELISA. Data are the mean ± SEM of n = 3 biological replicates and are representative of at least four independent experiments. One-way ANOVA followed by Tukey’s multiple comparison test, *P < 0.05, ***P < 0.001, ****P < 0.0001. (E) Cell lysates and supernatants were analyzed by immunoblot for specified proteins. The results shown are representative of two independent biological experiments. (G) Cell viability was assessed by PI uptake and flow cytometric analysis. Data shown are the mean ± SEM of n = 3 biological replicates and are representative of at least three independent experiments. One-way ANOVA followed by Tukey’s multiple comparison test, ****P < 0.0001.
Figure 2.
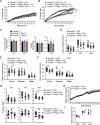
Figure 2.. RIPK3 deficiency and myeloid-specific loss of caspase-8 reduce HFD-induced metabolic dysfunction, adipose tissue inflammation, and MAFLD development.
(A, B) Body weights were measured weekly in Casp8lox/lox control (WT), Casp8lox/loxRipk3−/−, and Casp8LysMcreRipk3−/− mice fed a (A) normal chow diet (ND) or (B) high-fat diet (HFD) for ∼25 wk. Data shown are the mean ± SEM, n ≥ 11 ND-fed mice per group and n ≥ 13 HFD-fed mice per group pooled from three independent experiments. One-way ANOVA of the AUC, **P < 0.01. (C) End-stage organ weights in HFD-fed Casp8lox/lox control, Casp8lox/loxRipk3−/−, and Casp8LysMcreRipk3−/− mice. Data shown are the mean ± SEM, n ≥ 11 mice per group pooled from three independent experiments. One-way ANOVA followed by Tukey’s multiple comparison test, *P < 0.05. Gray boxes in (C) show the mean ± SEM from Casp8lox/lox, Casp8lox/loxRipk3−/−, and Casp8LysMcreRipk3−/− ND-fed mice (Fig S3D) for comparisons. (D, E) Glucose tolerance was measured in (D) ND- and (E) HFD-challenged Casp8lox/lox control, Casp8lox/loxRipk3−/−, and Casp8LysMcreRipk3−/− mice by intraperitoneal glucose tolerance tests (IP-GTT; 1.5 g/kg) at 8 wk. Data shown are the mean ± SEM, n = 3–6 mice per group representative of 2–3 independent experiments. One-way ANOVA of the AUC, *P < 0.05. (F) Representative microscopy images of F4/80-immunostained VAT sections from ND- and HFD-fed Casp8lox/lox control, Casp8lox/loxRipk3−/−, and Casp8LysMcreRipk3−/− mice at 25 wk. Arrows point to macrophage crown-like structures. The scale bar is 200 μm. (G) Mean adipocyte size in HFD-fed Casp8lox/lox control, Casp8lox/loxRipk3−/−, and Casp8LysMcreRipk3−/− VAT was quantified using an automated algorithm on H&E-stained sections (Fig S5A). Data are the mean ± SEM, n ≥ 11 mice per group pooled from three independent experiments. One-way ANOVA followed by Tukey’s multiple comparison test. (H) Numbers of neutrophils, inflammatory monocytes, and macrophages were quantified in the VAT of HFD-fed Casp8lox/lox control, Casp8lox/loxRipk3−/−, and Casp8LysMcreRipk3−/− mice by flow cytometric analysis. Data shown are the mean ± SEM, n = 7–8 mice per group pooled from two independent experiments. One-way ANOVA followed by Tukey’s multiple comparison test, *P < 0.05, **P < 0.01, ***P < 0.001. (I) VAT from HFD-fed Casp8lox/lox control, Casp8lox/loxRipk3−/−, and Casp8LysMcreRipk3−/− mice was cultured ex vivo with and without LPS (50 ng/ml) overnight, and IL-1β and TNF were measured in the supernatants by ELISA. Data shown are the mean ± SEM, n ≥ 12 mice per group pooled from three independent experiments. One-way ANOVA followed by Dunnett’s multiple comparison test, *P < 0.05, **P < 0.01. (J) Representative microscopy images of H&E-stained liver sections. The scale bar is 100 μm. (K) Histopathological evaluation of MAFLD in Casp8lox/lox control, Casp8lox/loxRipk3−/−, and Casp8LysMcreRipk3−/− ND-fed and HFD-fed mice after 25 wk of challenge. Data shown are the mean ± SEM, n ≥ 9 mice per group pooled from three independent experiments. One-way ANOVA followed by Tukey’s multiple comparison test, *P < 0.05, **P < 0.01. Source data are available for this figure.
Figure S3.
Figure S3.. Mice lacking RIPK3 and caspase-8 in myeloid cells are protected from weight gain and fatty liver upon HFD challenge.
(A, B) % Weight gain over time in Casp8lox/lox control (WT), Casp8lox/loxRipk3−/−, and Casp8LysMcreRipk3−/− mice fed a (A) normal chow diet (ND) or a (B) high-fat diet (HFD). Data shown are the mean ± SEM, n ≥ 11 mice per group pooled from three independent experiments. One-way ANOVA of the AUC, *P < 0.05, **P < 0.01, ***P < 0.001. (C) ND and HFD food intake and output per mouse per day were calculated from weekly measurements in Casp8lox/lox control, Casp8lox/loxRipk3−/−, and Casp8LysMcreRipk3−/− mice. Data shown are the mean + SD, n ≥ 8 mice per group from two pooled independent experiments, one-way ANOVA. (D, E, F) End-stage (25 wk of diet) organ weights and (G) organ weights expressed as a % of total body weight in Casp8lox/lox control, Casp8lox/loxRipk3−/−, and Casp8LysMcreRipk3−/− mice. Data shown are the mean ± SEM, n ≥ 11 mice/group pooled from three independent experiments. One-way ANOVA followed by Tukey’s multiple comparison test, *P < 0.05, **P < 0.01. Gray boxes in (F) show the mean ± SEM from Casp8lox/lox control, Casp8lox/loxRipk3−/−, and Casp8LysMcreRipk3−/− ND-fed mice (E). (H) Weight gain and (I) end-stage organ weights were measured in Casp8lox/lox control and Casp8LysMcre mice fed a HFD for 26 wk. Data shown are the mean ± SEM, n = 3–4 mice from one experiment.
Figure S4.
Figure S4.. Mice lacking RIPK3 and caspase-8 in myeloid cells are modestly protected from HFD-induced metabolic dysfunction.
(A, B, C) Intraperitoneal glucose tolerance (GTT, 1.5 g/kg) and (D) insulin tolerance tests (ITT, 0.75 U/kg) were performed, as indicated, in ND- and HFD-fed Casp8lox/lox control, Casp8lox/loxRipk3−/−, and Casp8LysMcreRipk3−/− mice, and blood glucose levels were monitored over time. Data shown are the mean ± SEM, n = 5–6 mice per group and are representative of one of two to three experiments. For ITT, blood glucose changes are normalized to baseline measurements. One-way ANOVA of the AUC, *P < 0.05. (E, F, G, H, I, J) Fasting serum, (E) glucose, (F) insulin, (G) triglyceride, (H) cholesterol, (I) ALT, and (J) AST levels in Casp8lox/lox control, Casp8lox/loxRipk3−/−, and Casp8LysMcreRipk3−/− ND- and HFD-fed mice after 16–18 (diamonds) or 25 (triangles/circles) wk. Data shown are the mean ± SEM, n ≥ 9 mice per group pooled from at least three experiments. One-way ANOVA followed by Tukey’s multiple comparison test, *P < 0.05, **P < 0.01. The dotted line shows the mean values of control Casp8lox/lox ND-fed mice extrapolated for comparison.
Figure S5.
Figure S5.. Loss of RIPK3 and caspase-8 activity contributes to tissue inflammation in HFD-induced obesity.
(A) Representative microscopy images of VAT sections from Casp8lox/lox control, Casp8lox/loxRipk3−/−, and Casp8LysMcreRipk3−/− mice fed a ND or HFD for 25 wk stained with H&E (top row; the scale bar is 200 μm) or cleaved caspase-3 immunohistochemistry (bottom row; the scale bar is 100 μm). (B) Mean adipocyte size as quantified on VAT H&E sections from Casp8lox/lox control, Casp8lox/loxRipk3−/−, and Casp8LysMcreRipk3−/− mice fed a ND. Data shown are the mean ± SEM, n = 6–12 mice pooled from three independent experiments, one-way ANOVA. (C) Flow cytometric gating strategy for analyzing live CD45+ PI myeloid populations in the VAT of HFD mice after 25 wk. (D) Representative microscopy images of Sirius Red–stained liver tissue sections showing fibrosis in ND- and HFD-fed Casp8lox/lox, Casp8lox/loxRipk3−/−, and Casp8LysMcreRipk3−/− mice. The scale bar is 200 μm. (E) Flow cytometric gating strategy for analyzing live CD45+ PI myeloid populations in the liver of mice fed a HFD for 25 wk. (F, G) Flow cytometric analysis showing the (F) % of CD45+ leukocytes and (G) proportion of neutrophils and monocyte/macrophages in the livers of Casp8lox/lox control, Casp8lox/loxRipk3−/−, and Casp8LysMcreRipk3−/− HFD mice. Data shown are the mean ± SEM, n = 6–8 mice per group pooled from two independent experiments. One-way ANOVA followed by Tukey’s multiple comparison test. (H) qRT–PCR measurement of the relative expression of Casp8, Tnf, Nlrp3, Casp1, and Il1b mRNA in the livers of Casp8lox/lox, Casp8lox/loxRipk3−/−, and Casp8LysMcreRipk3−/− HFD mice after 25 wk of diet (fold change over Casp8lox/lox ND). Data shown are the mean ± SEM, n ≥ 5 mice per group pooled from three experiments. One-way ANOVA followed by Tukey’s multiple comparison test, *P < 0.05, **P < 0.01, ***P < 0.001.
Figure 3.
Figure 3.. Mlkl−/− mice display reduced obesity and metabolic dysfunction with aging and with HFD feeding.
(A, C) WT and Mlkl−/− mice were fed an (A) ND and (C) HFD for ∼24–25 wk and body weights measured on a weekly basis. Data shown are the mean ± SEM, n ≥ 14 ND-fed mice/group and n ≥ 23 HFD-fed mice/group pooled from three independent experiments. Unpaired, two-tailed t test of the AUC, *P < 0.05, ***P < 0.001. (B, D) End-stage organ weights from (B) ND- and (D) HFD-fed WT and Mlkl−/− mice. Data shown are the mean ± SEM, n ≥ 14 mice/group pooled from three independent experiments. Unpaired, two-tailed t test, ***P < 0.001, ****P < 0.0001. Gray boxes in (D) represent the mean ± SEM from (B) for comparison. (E, F, G, H) Glucose tolerance was assessed via an IP-GTT (1.5 g/kg) at 8 and 17–18 wk in ND- and HFD-fed WT and Mlkl−/− mice. Data shown are the mean ± SEM, (E, F) n = 5–6 ND-fed mice per group and (G, H) n = 8–9 HFD-fed mice per group and are representative of one of 2–3 experiments. Unpaired, two-tailed t test of the AUC, *P < 0.05. (I) Insulin resistance was assessed in HFD-fed WT and Mlkl−/− mice (∼23 wk) during an IP-ITT (0.75 U/kg). Data shown are the mean ± SEM, n = 8–9 mice/group from one of two experiments. Unpaired, two-tailed t test of the AUC or independent time points, *P < 0.05. (J, K, L, M, N, O) Fasting serum, (J) glucose, (K) insulin, (L) ALT, (M) AST, (N) triglyceride, and (O) cholesterol after 24–25 wk of ND or HFD feeding in WT and Mlkl−/− mice. Data shown are the mean ± SEM, n ≥ 10 ND-fed mice per group (top panel) and n ≥ 18 HFD-fed mice per group (bottom panel). Unpaired, two-tailed t test, *P < 0.05, ****P < 0.0001. Source data are available for this figure.
Figure S6.
Figure S6.. MLKL-deficient mice display reduced obesity with aging and upon HFD feeding.
(A, B) % Weight gain over time in WT and Mlkl−/− mice fed a (A) ND or (B) HFD for 25 wk. Data shown are the mean ± SEM, n ≥ 14 ND-fed mice/group and n ≥ 23 HFD-fed mice per group pooled from three independent experiments. Unpaired, two-tailed t test of the AUC, ****P < 0.0001. (C, D) End-stage organ weights and (E) organ weights expressed as a % of total body weight in WT and Mlkl−/− mice fed a ND or HFD for 25 wk. Data shown are the mean ± SD, n = 11–17 mice per group pooled from three independent cohorts. Unpaired, two-tailed t test, *P < 0.05, **P < 0.01, ***P < 0.001, ****P < 0.0001. Gray boxes in (D) show the mean ± SEM from WT and Mlkl−/− ND-fed mice (C). (F) ND and HFD food intake and output per mouse per day were calculated from weekly measurements in WT and Mlkl−/− mice. Data shown are the mean + SD, n ≥ 9 ND-fed mice per group and n ≥ 20 HFD-fed mice/group pooled from 2 independent experiments. Unpaired, two-tailed t test, ****P < 0.000. (G) ITT (0.75 U/kg) was performed in ND-fed WT and Mlkl−/− mice at 23 wk, and blood glucose was monitored over time. Data are the mean ± SEM, n = 5–6 mice per group and are representative of one of two to three experiments. Unpaired, two-tailed t test of the AUC. (H) Fasting NEFA after ∼25 wk of ND or HFD feeding in WT and Mlkl−/− mice. Data shown are the mean ± SEM, n ≥ 10 ND-fed mice per group (top panel) and n ≥ 18 HFD-fed mice per group (bottom panel). Unpaired, two-tailed t test. (I) Representative microscopy images of VAT sections from WT and Mlkl−/− mice fed a ND or HFD for 25 wk showing cleaved caspase-3 immunohistochemistry. The scale bar is 100 μm. (J) Representative microscopy images of Sirius Red–stained liver tissue sections showing fibrosis in WT and Mlkl−/− mice fed a ND and HFD for 25 wk. The scale bar is 200 μm.
Figure 4.
Figure 4.. MLKL deficiency reduces adiposity and fatty liver disease in response to HFD challenge.
(A) Representative microscopy images of H&E-stained and F4/80-immunostained VAT sections from WT and Mlkl−/− mice fed a ND or HFD for ∼25 wk. Arrows point to crown-like structures. The scale bar is 100 μm. (B) Automated quantification of the mean adipocyte size in VAT on H&E-stained sections (A). Data shown are the mean ± SEM, n ≥ 13 ND-fed mice per group and n ≥ 23 HFD-fed mice per group pooled from three independent experiments. Unpaired, two-tailed t test, **P < 0.01, ***P < 0.001. (C) VAT from HFD-fed WT and Mlkl−/− mice was harvested at ∼25 wk, and the numbers of neutrophils, inflammatory monocytes, and macrophages were quantified by flow cytometric analysis. Data shown are the mean ± SEM, n ≥ 14 mice per group pooled from two independent experiments. Unpaired, two-tailed t test. (D) VAT from HFD-fed WT and Mlkl−/− mice was harvested at ∼25 wk and cultured ex vivo with and without LPS (50 ng/ml) overnight, and IL-1β and TNF were measured in the supernatants by ELISA. Data shown are the mean ± SEM, n ≥ 19 mice per group from pooled from three independent experiments. Unpaired, two-tailed t test, *P < 0.05. (E) Representative microscopy images of H&E-stained and Oil Red O–stained (to detect lipid droplets) liver sections. The scale bar is 100 μm. (F) Histopathological evaluation of disease in WT and Mlkl−/− mice after 25 wk of ND or HFD feeding. Data shown are the mean ± SEM, n ≥ 14 ND-fed mice and n ≥ 23 HFD-fed mice pooled from three independent experiments. Unpaired, two-tailed t test, **P < 0.01, ***P < 0.001. (G) Flow cytometric analysis of the proportion of CD45+ leukocytes in the livers of WT and Mlkl−/− HFD mice that are neutrophils and monocyte/macrophages. Data shown are the mean ± SEM, n ≥ 14 mice per group pooled from two independent experiments. Unpaired, two-tailed t test, *P < 0.05. (H) qRT–PCR measurement of relative Mlkl, Tnf, Nlrp3, Il1b Ccl2, and Cxcl1 mRNA expression in ND- and HFD-fed WT and Mlkl−/− liver tissues after 23–25 wk of diet (fold change over WT ND). Data shown are the mean ± SEM, n ≥ 6 mice per group pooled from three experiments. Unpaired, two-tailed t test, **P < 0.01, ***P < 0.001, ****P < 0.0001. Source data are available for this figure.
Figure S7.
Figure S7.. WT mice reconstituted with Mlkl−/− bone marrow develop obesity and metabolic dysfunction.
(A) Weight gain and (B) fat mass as a % of total body weight (assessed weekly using an EchoMRI) in WT and Mlkl−/− bone marrow transfer recipients fed a ND or HFD for 23 wk. Data are the mean ± SEM, n = 12 mice per group. Unpaired, two-tailed t test of the AUC. (C) End-stage organ weights were measured in WT and Mlkl−/− bone marrow chimeras fed a ND or HFD. Data are the mean ± SEM, n = 12 mice per group. Unpaired, two-tailed t test. (D) Oral GTT (oral gavage 2 g/kg based on lean body mass) was performed on WT and Mlkl−/− bone marrow chimeras after 10 wk of ND and HFD feeding, and blood glucose levels were monitored over time. Data are the mean ± SEM, n = 12 mice per group. Unpaired, two-tailed t test of the AUC.
Figure 5.
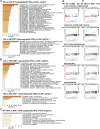
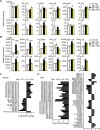
Figure 5.. Deficiency in MLKL leads to altered gene signatures in the livers of aging and HFD-fed mice.
(A, B, C, D) Liver RNA extracted from WT and Mlkl−/− mice on a ND or HFD (n = 3 mice per group) was subjected to 3′ mRNA sequencing. (A) Multidimensional scaling plot and (B) the number of differentially expressed genes up-regulated and down-regulated in WT v Mlkl−/− ND and HFD livers. P ≤ 0.05 and cutoff values logFC ≥ 1 or logFC ≤ −1. (C) Gene ontology (GO) pathways of significant DEGs up-regulated and down-regulated in Mlkl−/− ND livers compared with WT ND livers. P ≤ 0.05 and cutoff values logFC ≥ 1 or logFC ≤ −1. (D) Top 30 GO pathways of significant DEGs down-regulated in Mlkl−/− HFD livers compared with WT HFD livers. P ≤ 0.05 and cutoff values logFC ≤ −1. Source data are available for this figure.
Figure S8.
Figure S8.. Gene signatures in aging and HFD-fed MLKL-deficient mouse livers.
(A, B, C, D, E) WT and Mlkl−/− were fed a normal chow diet (ND) or high-fat diet (HFD) for 25 wk. 3′ mRNA-seq analysis was performed on the liver samples of three mice per diet. Gene ontology (GO) pathways of significant DEGs up-regulated and down-regulated (as indicated) in (A) WT HFD-fed versus WT ND-fed, (B) ND-fed Mlkl−/− versus HFD-fed Mlkl−/−, and (C) WT HFD-fed versus Mlkl−/− HFD-fed mouse livers. Cutoff values P ≤ 0.05 and logFC ≥ 1 or logFC ≤ −1. (D, E) Gene set enrichment analysis enrichment plots for genes differentially regulated between WT versus Mlkl−/− on a ND or HFD. A positive normalized enrichment score (upward arrow) indicates enrichment, whereas a negative normalized enrichment score (downward arrow) indicates down-regulation of a specific pathway in Mlkl−/− versus WT mice.
Figure S9.
Figure S9.. Altered gene signatures in aging ND- and HFD-fed MLKL-deficient mice.
(A, B, C, D) WT and Mlkl−/− mice were fed a normal chow diet (ND) or high-fat diet (HFD) for 25 wk. mRNA was extracted from liver tissue (n = 3 mice/group), and 3′ mRNA-seq analysis was performed. (A) Heatmap of oxidative phosphorylation genes significantly up-regulated in Mlkl−/− HFD livers versus WT HFD livers. Cutoff values adjusted P ≤ 0.05 and logFC ≤ −1. (B, C, D) Heatmaps of significant DEGs of GO terms, (B) regulation of cytokine production, (C) biosynthesis of unsaturated fatty acids, and (D) positive regulation of lipid metabolic process. Cutoff values P ≤ 0.05 and logFC ≤ −1.
Figure S10.
Figure S10.. Expression of fatty acid and cholesterol lipid metabolism regulatory genes in aging ND and HFD-fed Mlkl−/− livers.
(A, B) qRT–PCR measurement of relative levels of (A) cholesterol metabolism regulatory genes Srebp2, Hmgcr, Hmgcs2, and Ldlr and (B) fatty acid synthesis transcription factor Srebp1 in ND- and HFD-fed WT and Mlkl−/− liver tissues after 23–25 wk of diet (fold change over WT ND). Data shown are the mean ± SEM, n ≥ 6 mice per group pooled from three experiments. One-way ANOVA followed by Tukey’s multiple comparison test, **P < 0.01, ***P < 0.001. (C) Liver lysates from WT and Mlkl−/− mice fed a ND or HFD for ∼25 wk were analyzed by immunoblot for FABP4. n = 3 mice per group; each lane represents an individual mouse. FABP4 levels were analyzed by densitometry and normalized to actin and expressed as a fold change over WT ND liver lysates. Results are presented as the mean ± SEM. One-way ANOVA followed by Tukey’s multiple comparison test, **P < 0.01.
Figure 6.
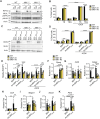
Figure 6.. PPAR signaling–associated lipid metabolism genes are down-regulated in the livers of HFD-fed Mlkl−/− mice.
(A) Heatmap of significant DEGs of GO-term PPAR signaling pathway (down-regulated in Mlkl−/− HFD livers compared with WT HFD livers). P ≤ 0.05 and cutoff values logFC ≥ 1 or logFC ≤ −1. (B, C, D, E, F, G) qRT–PCR analysis of liver mRNA from WT and Mlkl−/− mice fed a ND or HFD. Data shown are the mean ± SEM, n = 6–8 mice per group pooled from three independent experiments. Unpaired, two-tailed t test, *P < 0.05, **P < 0.01, ***P < 0.001, ****P < 0.0001. (H) Liver lysates from ND- and HFD-fed WT and Mlkl−/− mice were analyzed by immunoblot for the indicated antibodies. n = 4–5 mice per group; each lane represents an individual mouse. CD36 levels were analyzed by densitometry and normalized to actin and expressed as a fold change over WT ND liver lysates. Results are presented as the mean ± SEM. One-way ANOVA followed by Tukey’s multiple comparison test, ****P < 0.0001. Source data are available for this figure.
Figure S11.
Figure S11.. RIPK3 expression is not significantly up-regulated in liver tissue upon aging or HFD feeding.
(A) Liver lysates from WT and Mlkl−/− mice fed a ND and HFD for ∼25 wk were subjected to immunoblot for the indicated proteins. n = 3 mice per genotype and diet; each lane represents an individual mouse. Relevant protein levels were analyzed by densitometry and normalized to GAPDH and expressed as a fold change over WT ND liver lysates. Results are presented as the mean ± SEM. One-way ANOVA followed by Tukey’s multiple comparison test, **P < 0.01, ****P < 0.0001. (B) Representative microscopy images of RIPK3 immunostaining in liver and VAT sections from WT and Mlkl−/− ND- and HFD-fed mice. n ≥ 13 mice per group pooled from two to three experiments. The scale bar is 100 μm.
Figure S12.
Figure S12.. MLKL regulates saturated fatty acid accumulation and transcriptional responses in hepatic cell lines in a RIPK3-independent manner.
(A, B) WT and Mlkl−/− Hepa1-6 cells (Clone #1 and #3) were treated with doxycycline (DOX, 100 ng/ml) for 3 h, as indicated, to induce RIPK3 expression and then treated with TNF (T, 100 ng/ml), Smac-mimetic 711 (S, 1 μM), and pan-apoptotic caspase inhibitor Q-VD-OPh (Q, 40 μM) for 12–16 h. (A) Immunoblots were performed on cell lysates for relevant proteins. The results are representative of 2 independent experiments. < Reprobe of MLKL membrane, * nonspecific bands. (B) Cell death was measured via flow cytometric analysis of PI uptake. Data shown are the mean ± SD, n = 3 replicates from one of three experiments. One-way ANOVA followed by Tukey’s multiple comparison test, ****P < 0.0001. (C, D, E) WT and Mlkl−/− Hepa1-6 cells were treated with DOX (100 ng/ml) for 3 h to induce RIPK3, as indicated, and media were replaced. Cells were then stimulated with 100–300 μM palmitate conjugated to BSA (BSA-PA) or BSA (equivalent to highest BSA-PA) for 16–24 h. (C) Cell lysates were subjected to immunoblot for relevant proteins. Representative of two independent experiments. < Reprobe of MLKL membrane. (D) Cell death was measured via flow cytometric analysis of PI uptake. Data shown are the mean ± SD, n = 3 replicates from one of three experiments. One-way ANOVA followed by Tukey’s multiple comparison test, **P < 0.01, ****P < 0.0001. (E) Lipid accumulation was measured by BODIPY staining and flow cytometric analysis. Data are presented as the mean ± SD, n = 4 technical replicates pooled from two independent experiments. One-way ANOVA followed by Tukey’s multiple comparison test, *P < 0.05, **P < 0.01, ***P < 0.001, ****P < 0.0001. (F, G, H, I, J, K, L) WT and Mlkl−/− Hepa1-6 cells were treated with BSA and BSA-PA (200 μM) for 16 h, and relative levels of lipid metabolism–related genes were measured by qRT–PCR. Data shown are the mean ± SD, n = 4 replicates representative of one of two independent experiments. One-way ANOVA followed by Tukey’s multiple comparison test, *P < 0.05, **P < 0.01, ***P < 0.001, ****P < 0.0001.
Figure S13.
Figure S13.. Lipidomic analysis of aging and HFD-fed MLKL-deficient mice.
(A, B, C, D) Total lipid was extracted from the serum, liver, and VAT of WT and Mlkl−/− mice fed a ND or HFD for ∼25 wk, and lipid species were analyzed by LC-MS. (A) Principal component analysis plots of serum, liver, and VAT. n = 8–12 biological samples pooled from three independent experiments. (B, C, D) Heatmaps of (B) ceramide abundance in the VAT grouped by carbon length, (C) TG in the serum, and (D) DG and TG in the liver. Data in heatmaps represent relative median abundance per group, and values are normalized for median lipid content per mouse and tissue weight, as applicable.
Figure 7.
Figure 7.. MLKL deficiency alters the serum and liver lipid profile upon HFD feeding.
(A, B, C, D) WT and Mlkl−/− were fed a normal chow diet (ND) or high-fat diet (HFD) for 25 wk. The total lipid was extracted from the serum, liver, and VAT, and lipid species were analyzed by LC-MS. (A, B) Relative abundance of total lipid classes in the (A) serum and (B) liver of mice. Data are normalized for the median lipid content per sample. Data shown are the mean ± SEM, n = 8–12 mice per group pooled from three experiments. Statistical analyses shown were calculated using the median lipid/tissue weight-normalized data after (log10) transformation. One-way ANOVA followed by Tukey’s multiple comparison test, *P < 0.05, **P < 0.01, ***P < 0.001, ****P < 0.0001. (C, D) Fold change (log2) of individual lipid species in Mlkl−/− HFD- versus WT HFD-fed (C) serum and (D) liver. Data shown are median-normalized log2-transformed data adjusted for a false discovery rate. Unpaired t test, P < 0.05. Key: DG, diglycerides; TG, triglycerides; CE, cholesterol esters; Cer, ceramide; SM, sphingomyelin; AC, acylcarnitine; PC, phosphatidylcholine; PI, phosphatidylinositol; PS, phosphatidylserine; PG, phosphatidylglycerol; PE, phosphatidylethanolamine; COH, cholesterol. Source data are available for this figure.

References

    1. Afonso MB, Rodrigues PM, Carvalho T, Caridade M, Borralho P, Cortez-Pinto H, Castro RE, Rodrigues CM (2015) Necroptosis is a key pathogenic event in human and experimental murine models of non-alcoholic steatohepatitis. Clin Sci (Lond) 129: 721–739. 10.1042/cs20140732 - DOI - PubMed
    1. Afonso MB, Rodrigues PM, Mateus-Pinheiro M, Simão AL, Gaspar MM, Majdi A, Arretxe E, Alonso C, Santos-Laso A, Jimenez-Agüero R, et al. (2021) RIPK3 acts as a lipid metabolism regulator contributing to inflammation and carcinogenesis in non-alcoholic fatty liver disease. Gut 70: 2359–2372. 10.1136/gutjnl-2020-321767 - DOI - PMC - PubMed
    1. Akazawa Y, Nakao K (2018) To die or not to die: death signaling in nonalcoholic fatty liver disease. J Gastroenterol 53: 893–906. 10.1007/s00535-018-1451-5 - DOI - PMC - PubMed
    1. Allam R, Lawlor KE, Yu EC, Mildenhall AL, Moujalled DM, Lewis RS, Ke F, Mason KD, White MJ, Stacey KJ, et al. (2014) Mitochondrial apoptosis is dispensable for NLRP3 inflammasome activation but non-apoptotic caspase-8 is required for inflammasome priming. EMBO Rep 15: 982–990. 10.15252/embr.201438463 - DOI - PMC - PubMed
    1. Baker PJ, Masters SL (2018) Generation of genetic knockouts in myeloid cell lines using a lentiviral CRISPR/Cas9 system. Methods Mol Biol 1714: 41–55. 10.1007/978-1-4939-7519-8_3 - DOI - PubMed

MeSH terms

LinkOut - more resources