Clinical Trial
. 2024 Nov 12;15(1):9801.
doi: 10.1038/s41467-024-52528-7.

Entinostat in combination with nivolumab in metastatic pancreatic ductal adenocarcinoma: a phase 2 clinical trial

Affiliations
Clinical Trial

Entinostat in combination with nivolumab in metastatic pancreatic ductal adenocarcinoma: a phase 2 clinical trial

Marina Baretti et al. Nat Commun. .

Abstract

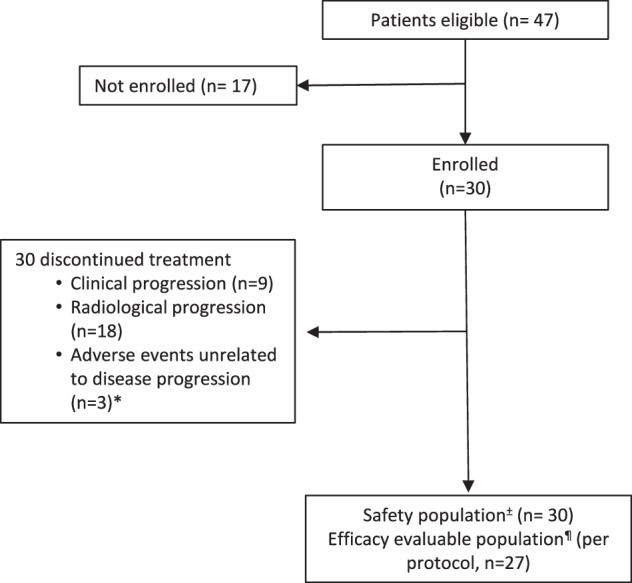
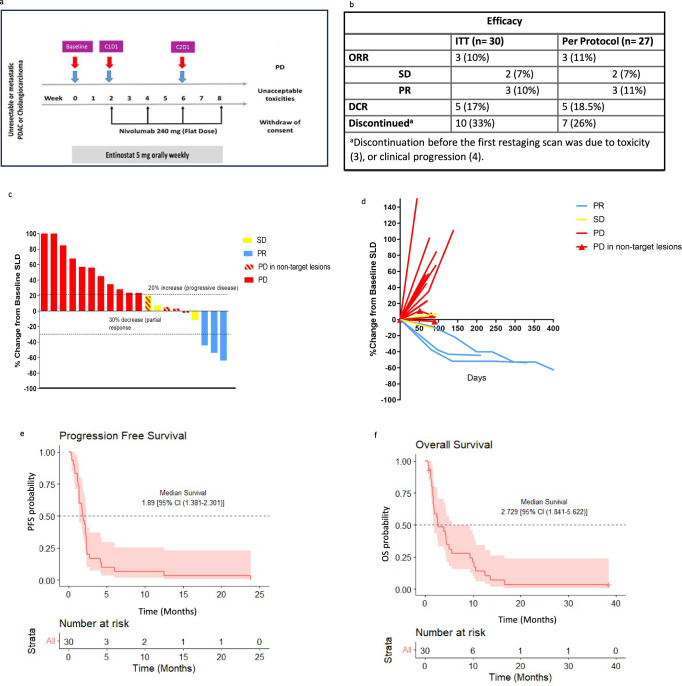
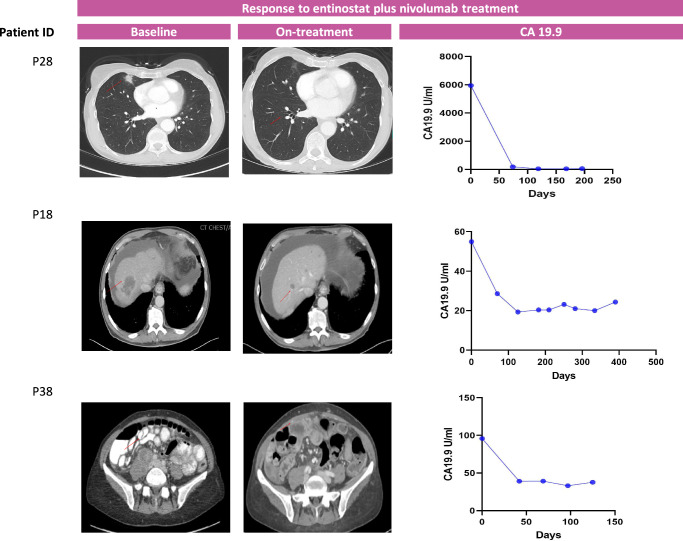
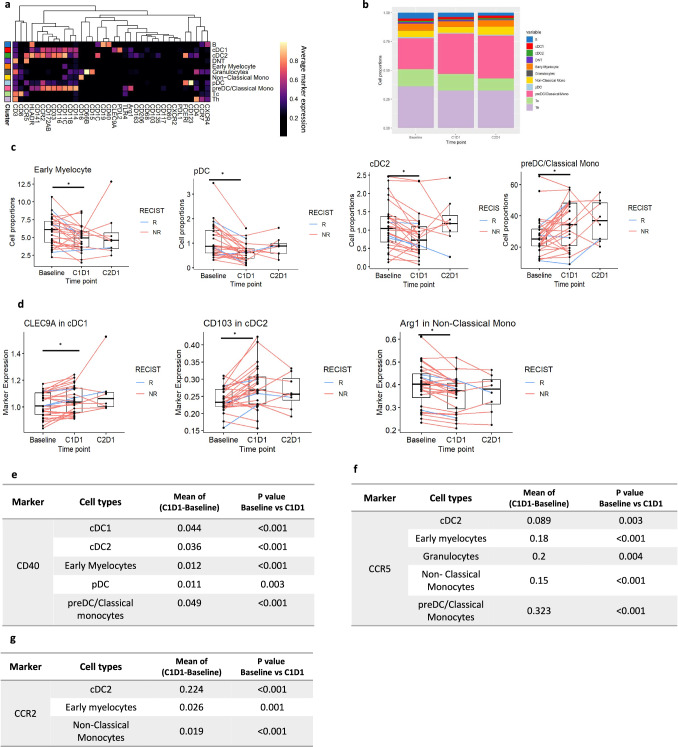
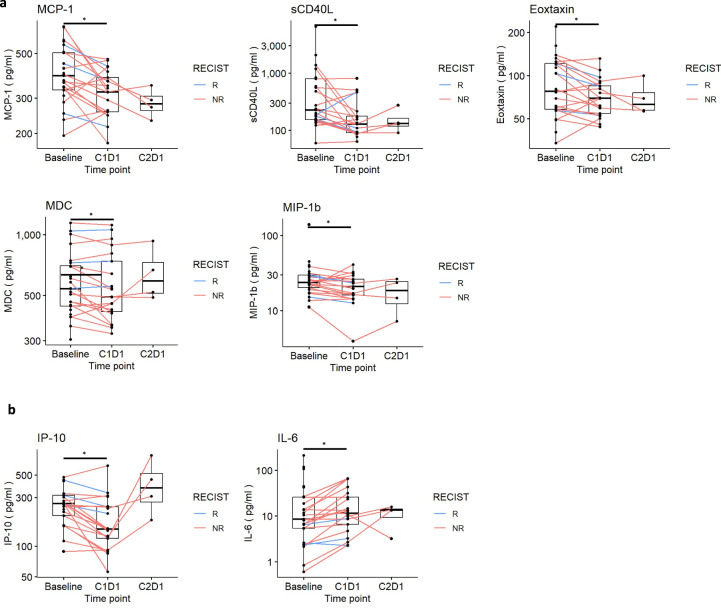
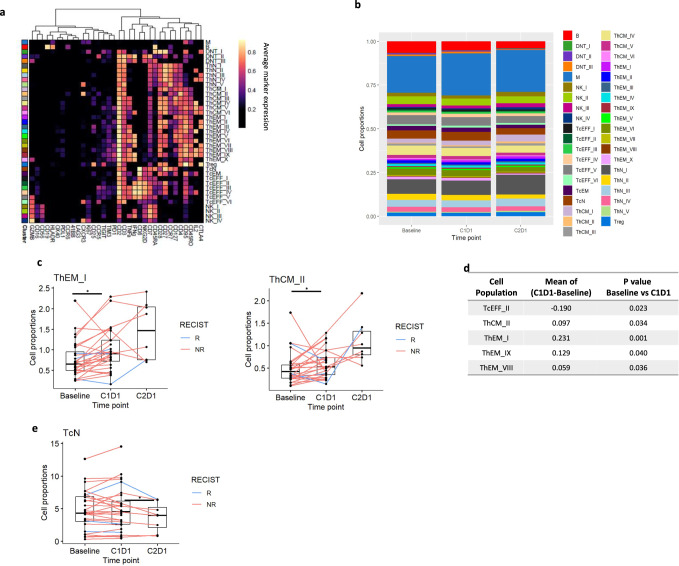
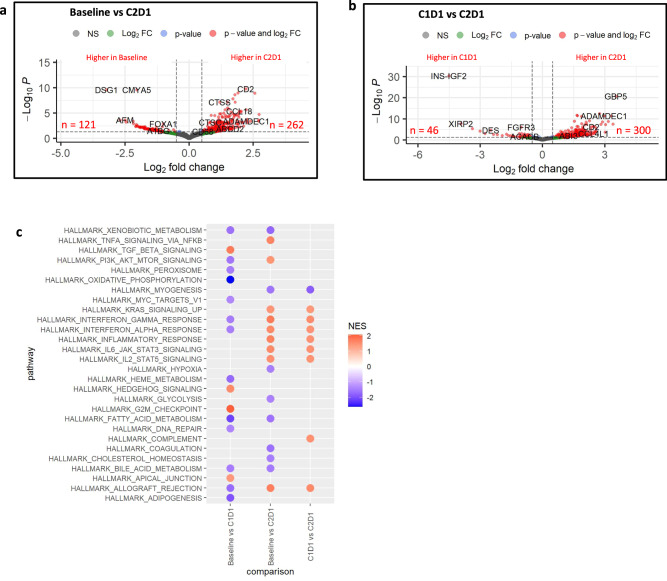
Pancreatic ductal adenocarcinoma (PDA) is characterized by low cytotoxic lymphocytes, abundant immune-suppressive cells, and resistance to immune checkpoint inhibitors (ICI). Preclinical PDA models showed the HDAC inhibitor entinostat reduced myeloid cell immunosuppression, sensitizing tumors to ICI therapy. This phase II study combined entinostat with nivolumab (PD1 inhibitor) in patients with advanced PDA (NCT03250273). Patients received entinostat 5 mg orally once weekly for 14-day lead-in, followed by entinostat and nivolumab. The primary endpoint was the objective response rate (ORR) by RECIST v1.1. Secondary endpoints included safety, duration of response, progression free-survival and overall survival. Between November 2017 and November 2020, 27 evaluable patients were enrolled. Three showed partial responses (11% ORR, 95% CI, 2.4%-29.2%) with a median response duration of 10.2 months. Median progression-free survival (PFS) and overall survival (OS) were, respectively, 1.89 (95% CI, 1.381-2.301) and 2.729 (95% CI, 1.841-5.622) months. Grade ≥3 treatment-related adverse events occurred in 19 patients (63%), including decreased lymphocyte count, anemia, hypoalbuminemia, and hyponatremia. As exploratory analysis, peripheral and tumor immune profiles changes were assessed using CyTOF, mIHC, and RNA-seq. Entinostat increased dendritic cell activation and maturation. Gene expression analysis revealed an enrichment in inflammatory response pathways with combination treatment. Although the primary endpoint was not met, entinostat and nivolumab showed durable responses in a small subset of PDA patients. Myeloid cell immunomodulation supported the preclinical hypothesis, providing a basis for future combinatorial therapies to enhance clinical benefits in PDA.


Conflict of interest statement

Competing interests M.B. served on advisory boards for AstraZeneca, Incyte. C.B.B is an employee of, and holds equity in, Akoya Biosciences, Inc. W.J.H. reports patent royalties from Rodeo/Amgen; grants from Sanofi, NeoTX, and Riboscience; speaking/travel honoraria from Exelixis and Standard BioTools. MY receives grant/research support (to Johns Hopkins) from Bristol-Myers Squibb, Exelixis, Incyte, and Genentech; receives honoraria from Genentech, Exelixis, AstraZeneca, Replimune, Hepion, Lantheus; MY is the co-inventor of patents pertaining to cancer vaccines and is a cofounder with equity of Adventris Pharmaceuticals, all outside of the submitted work. E.J.F is on the scientific advisory board for Resistance Bio, has consulted for Merck and Mestag Therapeutics, and receives research grants from Roche/Genetech and Abbvie Inc. L.M.C. has received reagent support from Cell Signaling Technologies, Syndax Pharmaceuticals, Inc., ZielBio, Inc., and Hibercell, Inc.; holds sponsored research agreements with Syndax Pharmaceuticals, Hibercell, Inc., Prospect Creek Foundation, Lustgarten Foundation for Pancreatic Cancer Research, Susan G. Komen Foundation, and the National Foundation for Cancer Research; is on the Advisory Board for Dispatch Biotherapeutics, Carisma Therapeutics, Inc., CytomX Therapeutics, Inc., Shasqi, Kineta, Inc., Hibercell, Inc., Cell Signaling Technologies, Inc., Alkermes, Inc., Raska Pharma, Inc., NextCure, Guardian Bio, AstraZeneca Partner of Choice Network (OHSU Site Leader), Genenta Sciences, Pio Therapeutics Pty Ltd., and Lustgarten Foundation for Pancreatic Cancer Research Therapeutics Working Group, Inc. E.J. reports other support from Abmeta, other support from Adventris, personal fees from Achilles, personal fees from DragonFly, non-financial support from Parker Institute, personal fees from Surge, grants from Lustgarten, grants from Genentech, personal fees from Mestag, personal fees from Medical Home Group, non-financial support from BMS, grants from Break Through Cancer, personal fees from CPRIT, personal fees from Neuvogen, non-financial support from HDT Bio, and personal fees from NeoTx outside the submitted work. N.S.A. receives grant/research support (to Johns Hopkins) from Bristol-Myers Squibb. L.D., J.N.D., L.C., D.N.S., J.A.T., S.C., N.G., A.H., C.T., R.W., J.L., S.M., B.C., A.S., D.A.G., S.Y. declare no competing interest related to this study.

Figures

Fig. 1
Fig. 1. Consort diagram of enrolled patients. n values represent the number of patients at each stage of the protocol.
±The safety population included all patients who received one or more doses of entinostat. The efficacy evaluable population included all patients in the safety population with measurable disease at baseline per RECIST v1.1. Three patients were not evaluable as patients came off the study due to toxicity before completing the first cycle of treatment without evidence of disease progression.
Fig. 2
Fig. 2. Clinical responses to entinostat and nivolumab.
a Study schema. Tumor biopsy (blue arrow) and blood (red arrow) collection timepoints; Baseline, C1D1 (after 2-week entinostat Run-in), C2D1 (after 6 weeks of combination therapy with entinostat + nivolumab). b Efficacy by best overall response by RECIST 1.1, shown are the patients that were enrolled for intention to treat (ITT) and those who received at least one CT scan RECIST reading to assess primary endpoint (per protocol). c The change from baseline in the target lesion diameter according to Response Evaluation Criteria in Solid Tumors (RECIST), version 1.1, for all evaluable patients (n = 20 patients). d Spider plot of radiographic responses to treatment with entinostat plus nivolumab, for all evaluable patients (n = 20 patients). Tumor responses were measured at regular intervals, and the values shown are the largest percentage change in the sum of the longest diameters from the baseline measurements of each measurable tumor. Each line represents one patient. e, f Kaplan–Meier curves of PFS (e) and OS (f). The 95% CIs for point estimates are shown in red shading. Source data are provided as a Source Data file. DCR, disease control rate; ITT, intention to treat; ORR, overall response rate; OS, overall survival; PD, progressive disease; PFS, progression free survival; PR, partial response; SD, stable disease: SLD, sum of longest diameters of the target lesions.
Fig. 3
Fig. 3. Radiologic scans and change in CA19.9 of the three responders during the course of entinostat plus nivolumab therapy.
CA 19.9 (Reference range: 0.0−36.0 U/mL).
Fig. 4
Fig. 4. Entinostat treatment altered abundance of myeloid populations in PBMC.
a Heatmap of the normalized expression for all markers used during FlowSOM from baseline and post-treatment samples using a Myeloid cell-oriented oriented CyTOF panel. N = 28 paired patient sample between baseline and C1D1, and n = 8 paired samples between C1D1 and C2D1. Cell subtypes listed on the right were assigned based on differential expression of the markers listed across the bottom. B cells, cDC1- classical dendritic cell type 1, cDC2-classic dendritic cell type 2, DNT- double negative T cells (neither CD4 nor CD8 expressing T cells), early myelocytes, Granulocytes, Non-classic monocytes, pDC-plasmacytoid dendritic cell, pre-DC - preDendritic cells (preDC)/Classic monocytes, Tc - Cytotoxic T cells, Th- Helper Tcells. b Bar plot of the proportion of myeloid cell populations at baseline, after Entinostat lead-in (C1D1), and post combination (C2D1). c Proportions of preDC/Classic monocytes (p = 0.007); early myelocytes (p = 0.001), pDC (p < 0.001), and cDC2 (p < 0.001) at different time points. Each line corresponds to one patient. Red line corresponds to a non responder; blue line corresponds to a responder. d Evaluation of CLEC9A (p = 0.016), CD103 (p < 0.001), and Arginase (p < 0.001) expression across cellular groups in the myeloid partition at given time points. eg, Evaluation of CD40, CCR5, and CCR2 expression across cellular groups in the myeloid partition at given time points P-values from paired two-sided Wilcoxon test between time points and the mean of the difference between time points are shown. Statistically significant P value is shown as follows: *P < 0.05. For all panels: N = 28 paired patient sample between baseline and C1D1, and n = 8 paired samples between C1D1 and C2D1. Box plots show the median and upper and lower quartiles and whiskers extend to 1.5× the interquartile range. Box plots show the median and upper and lower quartiles and whiskers extend to 1.5× the interquartile range. Source data are provided as a Source Data file. IL-6, interleukin 6; IP10, interferon γ-induced protein 10kDa; MCP-1, Monocyte Chemoattractant Protein-1; MDC, Macrophage-derived chemokine; MIP-1b, Macrophage inflammatory protein-1 beta; sCD40L, soluble CD40 Ligand; NR, non responders; R, responders.
Fig. 5
Fig. 5. Plasma concentration of circulating cytokines reveals downregulation of chemochines associated with TAM infiltration and angiogenesis upon entinostat exposure.
a change in plasma concentration of MCP-1 (p = 0.007), sCD40L (p = 0.024), Eoxtaxin (p = 0.033), MDC (p = 0.033), and MIP-1b (0.046); b change in plasma concentration of IP-10 (p = 0.002) and IL-6 (p = <0.001). P-values from paired two-sided Wilcoxon test between time points. Statistically significant P value is shown as follows: *P < 0.05. N = 20 paired patient samples between baseline and C1D1 and and n = 4 paired samples between C1D1 and C2D1. Source data are provided as a Source Data file. IL-6, interleukin 6; IP10, interferon γ-induced protein 10kDa; MCP-1, Monocyte Chemoattractant Protein-1; MDC, Macrophage-derived chemokine; MIP-1b, Macrophage inflammatory protein-1 beta; sCD40L, soluble CD40 Ligand; NR, non responders; R, responders.
Fig. 6
Fig. 6. Entinostat promotes differentiation toward memory away from naive in peripheral T cells and induces changes in functional states of immune cell subsets.
a Heatmap of the normalized expression for all markers used during FlowSOM from baseline and post-treatment samples using a lymphoid cell-oriented CyTOF panel. Cell sub types listed on the right were assigned based on differential expression of the markers listed across the bottom. b Bar plot of the proportion of T cell populations at different timepoint. c,d Graphs representing proportion of effector memory T (ThEM) cells (p = 0.001) and central memory (ThCM) T cells (p = 0.03) comparing baseline vs. post entinostat; e Graphs representing proportion of naïve T cell subtypes (TcN) cells comparing baseline vs. post entinostat (p = 0.02). P-values from paired two-sided Wilcoxon test between time points. Statistically significant P value is shown as follows: *P < 0.05. For all panels: N = 28 paired patient samples between baseline and C1D1, and n = 8 paired samples between C1D1 and C2D1. Box plots show the median and upper and lower quartiles and whiskers extend to 1.5× the interquartile range. See abbreviations of clusters are in the Source data table 7. Source data are provided as a Source Data file.
Fig. 7
Fig. 7. RNA-seq analysis of differentially expressed genes between baseline and on treatment samples in this study cohort of PDA.
a,b Volcano plots indicating differentially expressed genes in the analysis of paired samples. The paired differential expression analysis was performed using the DESeq2 package (v1.32.0) comparing Baseline vs C2D1 samples (a) and C1D1 vs C2D1 samples (b) (n = 4 paired patient samples). Log10-transformed FDR-adjusted p-values are on the y-axis and log2-transfomed fold change between time points is on the x-axis. Genes with the absolute log2-fold changes greater than 0.5 are shown in green, genes with a FDR-adjusted p-value were below 0.05 are shown in blue, and genes that meet both thresholds are in red. c Plot of significantly differentially expressed HALLMARK pathways (FDR-adjusted p-values < 0.05) for pair-wise comparisons between time points. Gene set statistics were run with fgsea using MSigDb v7.4.1. Negative NES scores (blue) indicate pathways that are downregulated, while positive NES score (red) indicates pathway upregulation in C1D1 or C2D1. Source data are provided as a Source Data file. NES, normalized enrichment score.

References

    1. Siegel, MphR. L. et al. Cancer statistics, 2023. CA Cancer J. Clin.73, 17–48 (2023). - PubMed
    1. Vincent, A., Herman, J., Schulick, R., Hruban, R. H. & Goggins, M. Pancreatic cancer. Lancet378, 607–620 (2011). - PMC - PubMed
    1. O’Reilly, E. M. et al. Durvalumab with or without tremelimumab for patients with metastatic pancreatic ductal adenocarcinoma: a phase 2 randomized clinical trial. JAMA Oncol.5, 1431–1438 (2019). - PMC - PubMed
    1. Maio, M. et al. Immunomodulatory activity of SGI-110, a second generation hypomethylating agent. Ann. Oncol.24, i7 (2013). - PubMed
    1. Cycon, K. A., Mulvaney, K., Rimsza, L. M., Persky, D. & Murphy, S. P. Histone deacetylase inhibitors activate CIITA and MHC class II antigen expression in diffuse large B-cell lymphoma. Immunology140, 259 (2013). - PMC - PubMed

Publication types

MeSH terms

Associated data