. 2024 Nov 12;15(1):9335.
doi: 10.1038/s41467-024-53568-9.

Sequence variants associated with BMI affect disease risk through BMI itself

Affiliations

Sequence variants associated with BMI affect disease risk through BMI itself

Gudmundur Einarsson et al. Nat Commun. .

Abstract

Mendelian Randomization studies indicate that BMI contributes to various diseases, but it's unclear if this is entirely mediated by BMI itself. This study examines whether disease risk from BMI-associated sequence variants is mediated through BMI or other mechanisms, using data from Iceland and the UK Biobank. The associations of BMI genetic risk score with diseases like fatty liver disease, knee replacement, and glucose intolerance were fully attenuated when conditioned on BMI, and largely for type 2 diabetes, heart failure, myocardial infarction, atrial fibrillation, and hip replacement. Similar attenuation was observed for chronic kidney disease and stroke, though results varied. Findings were consistent across sexes, except for myocardial infarction. Residual effects may result from temporal BMI changes, pleiotropy, measurement error, non-linear relationships, non-collapsibility, or confounding. The attenuation extent of BMI genetic risk score on disease associations suggests the potential impact of reducing BMI on disease risk.


Conflict of interest statement

Competing interests G.E., G.T., V.S., F.Z., H.Helgason, T.O., S.R., V.T., M.O.U., G.S., A.S.S., H.E., H.M.A., G.A.J., A.H., S.G., U.S., H.K.A., D.O.A., G.B., H.S., T.T., P.S., U.T., H.Holm, D.F.G. and K.S. are employees of deCODE Genetics/Amgen Inc. The remaining authors declare no competing interests.

Figures

Fig. 1
Fig. 1. Schematic overview of the key features of the study.
A depicts a diagram of how the BMI-GRSs were constructed. B depicts in the top section the causal diagram for Mendelian Randomization with the three assumptions. The lower part of (B) shows how the residual associations can be interpreted. In the middle, we have a box representing BMI as the exposure, in the upper part we have measured BMI, represented as BMI* and the lower part, we have BMI|BMI*, which represents the information not contained in the measurements. The information not contained in the measurements can have an impact on disease, demonstrated by significant residual associations.
Fig. 2
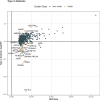
Fig. 2. Scatter plot showing effects of BMI variants on BMI on the x axis and their effects (log(OR)) on T2D on the y axis.
The log(OR) is meta-analyzed from Icelandic and UK data, while the BMI Beta is from Yengo et al.. Outliers detected with MRPRESSO are colored in orange and annotated with the closest gene. A bidirectional relationship is observed, most of the variants are concordant, while most of the outliers are discordant and have strong associations with T2D. Source data are provided as a Source Data file.
Fig. 3
Fig. 3. Main association results summarized in a forest plot.
Shown are associations between the BMI-GRS and diseases/conditions in the UK Biobank (left) and Iceland (right). The GRSs were in both cases scaled such that an increase by one unit corresponded to a 1 kg/m2 increase in BMI, thus the ORs correspond to a 1 kg/m2 increase in BMI. The black points and error bars show the disease association of the BMI-GRS adjusted for sex, year of birth, and 20 genetic principal components), and the orange points and error bars show the corresponding association when BMI has been added as a covariate. The error bars correspond to a 95% confidence interval for the parameter, and the points represent ORs from logistic regression. See Supplementary Table 3 for details. Source data are provided as a Source Data file.
Fig. 4
Fig. 4. Comparing estimation of BMI as a risk factor for diseases by different approaches in UK Biobank and Icelandic data.
Three scores are compared, BMI-GRS (yellow), BMI-GRS-with-Outliers (blue), and the BMI-PRS (red), all created from BMI effects from BMI-GWAS meta-analyses (See methods and Fig. 1). All scores have been scaled such that a unit increase corresponds to a 1 kg/m2 increase in BMI, thus the ORs correspond to a 1 kg/m2 increase in BMI. The BMI-GRS is the same as the one reported in Fig. 3. The BMI phenotype corresponds to the black legend and represents an epidemiological estimate of the risk for the corresponding population. The counts of cases and controls are the same as reported in Fig. 3. The points and error bars show the disease association of the BMI genetic scores and the BMI phenotype adjusted for sex, year of birth, and 20 genetic principal components. The error bars correspond to a 95% confidence interval for the parameter, and the points represent ORs from logistic regression. See Supplementary Tables 3, 6, 7, and 9 for full details of the associations. Source data are provided as a Source Data file.

References

    1. Franks, P. W. & Atabaki‐Pasdar, N. Causal inference in obesity research. J. Intern. Med.281, 222–232 (2017). - PubMed
    1. Mokdad, A. H. et al. Prevalence of obesity, diabetes, and obesity-related health risk factors, 2001. JAMA289, 76–79 (2003). - PubMed
    1. Bastien, M., Poirier, P., Lemieux, I. & Després, J.-P. Overview of epidemiology and contribution of obesity to cardiovascular disease. Prog. Cardiovasc. Dis.56, 369–381 (2014). - PubMed
    1. Van Gaal, L. F., Mertens, I. L. & De Block, C. E. Mechanisms linking obesity with cardiovascular disease. Nature444, 875–880 (2006). - PubMed
    1. Meschia, J. F. et al. Guidelines for the primary prevention of stroke: a statement for healthcare professionals from the American Heart Association/American Stroke Association. Stroke45, 3754–3832 (2014). - PMC - PubMed

MeSH terms

LinkOut - more resources