. 2024 Nov 12;15(1):9585.
doi: 10.1038/s41467-024-53835-9.

Hepatic SerpinA1 improves energy and glucose metabolism through regulation of preadipocyte proliferation and UCP1 expression

Affiliations

Hepatic SerpinA1 improves energy and glucose metabolism through regulation of preadipocyte proliferation and UCP1 expression

Shota Okagawa et al. Nat Commun. .

Abstract

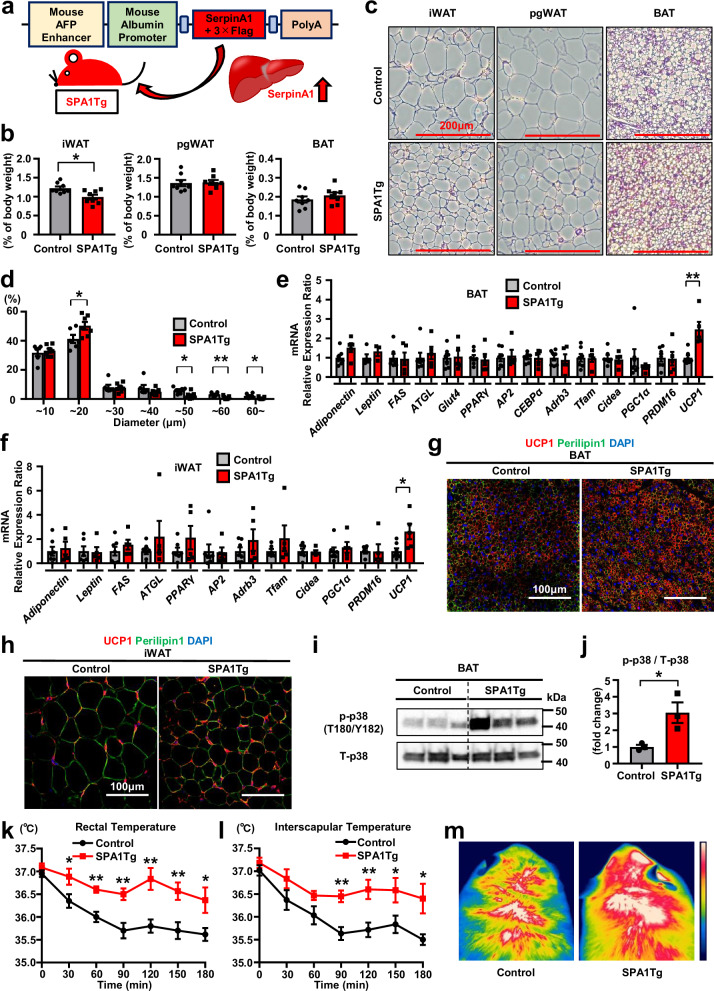
Lipodystrophy and obesity are associated with insulin resistance and metabolic syndrome accompanied by fat tissue dysregulation. Here, we show that serine protease inhibitor A1 (SerpinA1) expression in the liver is increased during recovery from lipodystrophy caused by the adipocyte-specific loss of insulin signaling in mice. SerpinA1 induces the proliferation of white and brown preadipocytes and increases the expression of uncoupling protein 1 (UCP1) to promote mitochondrial activation in mature white and brown adipocytes. Liver-specific SerpinA1 transgenic mice exhibit increased browning of adipose tissues, leading to increased energy expenditure, reduced adiposity and improved glucose tolerance. Conversely, SerpinA1 knockout mice exhibit decreased adipocyte mitochondrial function, impaired thermogenesis, obesity, and systemic insulin resistance. SerpinA1 forms a complex with the Eph receptor B2 and regulates its downstream signaling in adipocytes. These results demonstrate that SerpinA1 is an important hepatokine that improves obesity, energy expenditure and glucose metabolism by promoting preadipocyte proliferation and activating mitochondrial UCP1 expression in adipocytes.


Conflict of interest statement

Competing interests The authors declare no competing interests.

Figures

Fig. 1
Fig. 1. SerpinA1 induces preadipocyte proliferation.
a Workflow of the proteomics analysis of serum from control and Ai-DKO mice at 3 days after tamoxifen injection (n = 3) to identify factor(s) leading to preadipocyte proliferation. b Results of proteomics analysis performed according to the workflow in (a) and identification of SerpinA1. Statistical analysis was performed using two-tailed Student’s t test. p < 0.05, with an absolute |Log2(fold change Ai-DKO/Control)| > 0.3. c Serum SerpinA1 levels in control, Ai-IGF1RKO, Ai-IRKO and Ai-DKO mice 3 days after tamoxifen injection. The data are presented as the mean ± SEM (n = 10, one-way ANOVA post hoc Bonferroni test, ***p < 0.0001). d SerpinA1 mRNA expression in various organs and tissues of 4-month-old C57BL/6 mice with a primer that recognizes all five SerpinA1 paralogs. The data are presented as the mean ± SEM (n = 3). e Schematic of the EdU assay for the analysis of preadipocyte proliferation after SerpinA1 treatment for 18 h. f Representative images of EdU-stained brown preadipocytes (WT-1 cells) treated with different concentrations of SerpinA1 (0, 50, or 100 µg/mL). Untreated cells served as the negative Controls. The cells with red fluorescence are in S phase of mitosis, and all cells exhibit blue fluorescence. Scale bar = 100 μm. g Quantification of EdU-positive brown preadipocytes (WT-1 cells). The data are presented as the mean ± SEM (n = 8 technical replicates/group, one-way ANOVA post hoc Bonferroni test, ***p  <  0.0001). h: Representative images of EdU-stained white preadipocytes (A41 hWAT-SVF cells) treated with different concentrations of SerpinA1 (0, 100, or 200 µg/mL). Scale bar = 100 μm. i Quantification of EdU-positive white preadipocytes (A41 hWAT-SVF cells). The data are presented as the mean ± SEM (n = 7 technical replicates/group, two-tailed Student’s t test with Bonferroni’s correction, *p = 0.0101 and **p = 0.0015). Source data are provided as a Source Data file.
Fig. 2
Fig. 2. SerpinA1 induces mitochondrial activity in both brown and white adipocytes.
a Schematic of the protocol used to induce brown preadipocytes to differentiate into mature brown adipocytes. b Relative mRNA expression of genes in mature brown adipocytes treated with 0 or 200 µg/mL SerpinA1 for 6 h (n = 8 technical replicates/group, ***p < 0.0001). c UCP1 protein expression in mature brown adipocytes treated with 0 or 300 µg/mL SerpinA1 for 24 h (n = 5). d Quantification of UCP1 protein levels in (c), expressed relative to the level of the protein standard (n = 5 technical replicates/group, **p = 0.0025). e Representative traces of the oxygen consumption rate (OCR) in mature brown adipocytes treated with 0 or 300 µg/mL SerpinA1 for 16 h (Control n = 9, SerpinA1 n = 10, technical replicates/group, *p < 0.05, **p < 0.01 and ***p < 0.001). f Quantitation of basal respiration, ATP production (*p = 0.0141), maximal respiration (*p = 0.0185) and spare respiratory capacity (Control n = 9, SerpinA1 n = 10, technical replicates/group). g Schematic of the protocol used to induce white preadipocytes (A41 hWAT-SVF cells) to differentiate into mature white adipocytes. h Relative mRNA expression of genes in mature white adipocytes treated with different concentrations of SerpinA1 (0, 200, or 500 µg/mL) for 16 h (0 µg/mL n = 8, 200 µg/mL n = 8, and 500 µg/mL n = 7, technical replicates/group, *p = 0.0444 and **p = 0.0017). i Representative traces of the OCR in mature white adipocytes treated with 0 or 500 µg/mL SerpinA1 for 36 h (Control n = 19, SerpinA1 n = 20, technical replicates/group, *p < 0.05, **p < 0.01 and ***p < 0.001). j Quantitation of basal respiration, ATP production (*p = 0.0132), maximal respiration (***p < 0.0001) and spare respiratory capacity (***p < 0.0001) (Control n = 19, SerpinA1 n = 20, technical replicates/group). Data are presented as mean ± SEM. P values were determined using two-tailed Student’s t test: (b, df, ij); one-way ANOVA post hoc Bonferroni test: (h). Source data are provided as a Source Data file.
Fig. 3
Fig. 3. SerpinA1 forms a complex with EphB2 to promote preadipocyte proliferation.
a Schematic of the protocol used to transduce brown preadipocytes with adenovirus carrying 3×Flag-tagged SerpinA1. b Adenovirus-mediated 3×Flag-tagged SerpinA1 protein overexpression brown preadipocytes (n = 3). c Quantification of protein levels in (b) (n = 3, ***p < 0.0001). d Schematic of the protocol used to induce the differentiation of brown preadipocytes infected with adenovirus carrying 3×Flag-tagged SerpinA1. e Relative UCP1 mRNA expression in mature control and SerpinA1-OE brown adipocytes (n = 12, ***p = 0.0004). f UCP1 protein expression in mature control and SerpinA1-OE brown adipocytes (n = 3). g Quantification of protein levels in (f) (n = 3, *p = 0.0200). h Representative immunoblots before and after IP (n = 1) in control and SerpinA1-OE brown preadipocytes. i Potential SerpinA1-interacting proteins identified by mass spectrometry-based proteomics analysis followed by IP. j Identification of EphB2 as a member of the SerpinA1 complex via the coprecipitation of SerpinA1 and EphB2 by immunoblotting (n = 1). k EphB2 protein expression in control and CRISPR‒Cas9-mediated EphB2-KO brown preadipocytes (n = 6). l Quantification of protein levels in (k) (n = 6, ***p  <  0.0001). m Representative images of EdU-stained control and EphB2-KO brown preadipocytes treated with different concentrations of SerpinA1 (0 or 100 µg/mL, 18 h). Scale bar = 100 μm. n Quantification of EdU-positive control and EphB2-KO brown preadipocytes treated with different concentrations of SerpinA1 (0 or 100 µg/mL, 18 h) (n = 8, ***p  <  0.0001). o The protein levels of p-ERK1/2 and T-ERK1/2 in control and EphB2-KO brown preadipocytes treated with different concentrations of SerpinA1 (0 or 300 µg/mL, 24 h) (n = 3). p Quantification of protein levels in (o) (n = 3, *p = 0.0357 and ***p = 0.0001). Data are presented as mean ± SEM. P values were determined using two-tailed Student’s t test: (c, e, g, l); one-way ANOVA post hoc Bonferroni test: (n, p). All replicates performed in Fig. 3 were biologically independent cell clones/group. Source data are provided as a Source Data file.
Fig. 4
Fig. 4. SerpinA1 induces adipocyte browning through interaction with EphB2.
a Oil Red O staining of control and EphB2-KO mature brown adipocytes treated with different concentrations of SerpinA1 (0 or 300 µg/mL) for 24 h. Scale bar = 80 μm. b Relative mRNA expression of genes in mature control brown adipocytes and brown adipocytes with CRISPR‒Cas9-mediated EphB2 KO following treatment with different concentrations of SerpinA1 (0 or 200 µg/mL) for 12 h. The data are presented as the mean ± SEM (n = 6 biologically independent cell clones/group, one-way ANOVA post hoc Bonferroni test, ***p  <  0.0001). c Relative mRNA expression of genes in mature control and EphB2-KD brown adipocytes electroporated with siRNA and treated with different concentrations of SerpinA1 (0 or 200 µg/mL) for 12 h. The data are presented as the mean ± SEM (n = 6 biologically independent cell clones/group, one-way ANOVA post hoc Bonferroni test, *p  =  0.0413 and **p = 0.0093). d Representative traces of the OCR in mature control and EphB2-KO brown adipocytes treated with 0 or 300 µg/mL SerpinA1 for 16 h. The data are presented as the mean ± SEM (n = 9 biologically independent cell clones/group, two-tailed Student’s t test, *p < 0.05). e Quantitation of basal respiration, ATP production, maximal respiration (*p  =  0.0143) and spare respiratory capacity (*p  =  0.0147). The data are presented as the mean ± SEM (n = 9 biologically independent cell clones/group, two-tailed Student’s t test). f The protein level of p-p38 and T-p38 in control and EphB2-KO mature brown adipocytes treated with different concentrations of SerpinA1 (0 or 300 µg/mL, 24 h) (n = 3). g Quantification of p-p38 protein levels in (f), expressed relative to the T-p38 protein level. The data are presented as the mean ± SEM (n = 3 biologically independent cell clones/group, one-way ANOVA post hoc Bonferroni test, Control+SerpinA1(-) vs Control+SerpinA1(+): ***p < 0.0001, Control+SerpinA1(+) vs EphB2-KO+SerpinA1(+): ***p = 0.0002). Source data are provided as a Source Data file.
Fig. 5
Fig. 5. Liver-specific SerpinA1-overexpressing transgenic mice exhibit increased browning and adaptive thermogenesis.
All mice in Fig. 5 were male fed a chow diet. a Strategy for generating SPA1Tg mice. b Percentage of tissue weight per body weight of iWAT, pgWAT and BAT from 12-week-old control and SPA1Tg mice (n = 8, *p = 0.0100). c HE-stained sections of iWAT, pgWAT and BAT from 12-week-old control and SPA1Tg mice. Scale bars = 200 μm. d Diameter distribution of isolated iWAT from 12-week-old control and SPA1Tg mice (Control n = 6, SPA1Tg n = 7, *p < 0.05 and **p < 0.01). e Relative mRNA expression of genes in BAT from 12-week-old control and SPA1Tg mice (Control n = 7 and SPA1Tg n = 5; except for Control-Leptin (n = 5) and SPA1Tg-Leptin (n = 3), **p = 0.0022). f Relative mRNA expression of genes in iWAT from 12-week-old control and SPA1Tg mice (Control n = 7 and SPA1Tg n = 5; except for Control-Leptin (n = 6), Control-Tfam (n = 6) and Control-PRDM16 (n = 5), *p = 0.0220). g Representative images of BAT sections from 12-week-old control and SPA1Tg mice, immunostained for UCP1 and Perilipin1. h Representative images of iWAT sections from 12-week-old control and SPA1Tg mice, immunostained for UCP1 and Perilipin1. i The protein level of p-p38 and T-p38 in BAT from 8-week-old control and SPA1Tg mice (n = 3). j Quantification of protein levels in (i) (n = 3, *p = 0.0310). k Rectal temperatures of 18-week-old control and SPA1Tg mice exposed at 4 °C (n = 6, *p < 0.05 and **p < 0.01). l Interscapular temperatures of 18-week-old control and SPA1Tg mice exposed at 4 °C (n = 6, *p < 0.05 and **p < 0.01). m Thermal images showing the surface temperature over BAT in 18-week-old control and SPA1Tg mice at 180 min of exposure to 4 °C. The color bar indicates higher thermal temperatures towards the top. Data are presented as mean ± SEM. P values were determined using two-tailed Student’s t test. Source data are provided as a Source Data file.
Fig. 6
Fig. 6. SPA1Tg mice exhibit improved glucose metabolism.
ae Results in 12-week-old male CD-fed control and SPA1Tg mice. a Fed and fasting blood glucose levels (n = 8, *p = 0.0184). b Results of the ipGTT (n = 4, *p < 0.05 and **p < 0.01). c Area under the curve (AUC) of the ipGTT in (b) (n = 4, *p = 0.0168). d Results of the ipITT (n = 4, *p < 0.05 and **p < 0.01). e AUC of the ipITT in (d) (n = 4, *p = 0.0142). f Schematic diagram of the HFD feeding program for male control and SPA1Tg mice beginning 5 weeks after birth. g Body weights of 5- to 17-week-old male HFD-fed control and SPA1Tg mice (n = 7, *p < 0.05 and **p < 0.01). hn Results in 17-week-old male HFD-fed control and SPA1Tg mice. h Fed and fasting blood glucose levels (Control n = 11, SPA1Tg n = 13, *p = 0.0244). i Results of the ipGTT (Control n = 10, SPA1Tg n = 11, *p < 0.05 and **p < 0.01). j AUC of the ipGTT in (i) (Control n = 10, SPA1Tg n = 11, *p = 0.0299). k Results of the ipITT (n = 7, *p < 0.05 and **p < 0.01). l AUC of the ipITT in (k) (n = 7, **p = 0.0088). m HE-stained sections of iWAT, pgWAT and BAT. Scale bars = 200 μm. n Representative images of UCP1- and Perilipin1-immunostained BAT and iWAT sections. oq Results in 20-week-old male HFD-fed control and SPA1Tg mice during 180 min exposed to 4 °C. o: Thermal images showing the surface temperature over BAT at 180 min. p: Interscapular temperatures (n = 5, *p < 0.05 and **p < 0.01). q Rectal temperatures (n = 5, *p < 0.05 and ***p < 0.001). Data are presented as mean ± SEM. P values were determined using two-tailed Student’s t test. Source data are provided as a Source Data file.
Fig. 7
Fig. 7. Quintuple SerpinA1a-e knockout (SPA1KO) mice exhibit decreased browning and impaired energy expenditure and glucose metabolism.
a Generation of SPA1KO mice. bg 12-week-old male CD-fed control and SPA1KO. b SerpinA1 protein (n = 1). c ELISA of serum SerpinA1 (n = 12, ***p < 0.0001). d HE sections. Scale bars = 100 μm. e iWAT (Control n = 6, SPA1KO n = 9) and pgWAT diameter (n = 5) (*p < 0.05 and **p < 0.01). f UCP1-immunostained BAT and iWAT sections. Scale bars = 100 µm. g mRNA expression in BAT (n = 8, *p < 0.05). hi Cold exposure of 11-week-old male CD-fed control and SPA1KO at 4 °C during 180 min. h Rectal temperatures (n = 11, *p < 0.05 and **p < 0.01). i Thermal images over BAT at 120 min. j Weight of BAT from male control, Ai-IRKO and Ai-IRKO without SerpinA1 (Control and Ai-IRKO n = 4, Ai-IRKO without SerpinA1 n = 3, **p < 0.01 and ***p < 0.001). k Rectal temperatures of male control, Ai-IRKO and Ai-IRKO without SerpinA1 exposed to 4 °C (Control and Ai-IRKO n = 4, Ai-IRKO without SerpinA1 n = 3, Ai-IRKO vs Ai-IRKO without SerpinA1, *p < 0.05). l, m 11-week-old male CD-fed control and SPA1KO. l VO2 (n = 6). m Mean VO2 in (l) (n = 6, *p = 0.0268). nq 12-week-old male CD-fed control and SPA1KO (Control n = 7, SPA1KO n = 5). n ipGTT (*p < 0.05, **p < 0.01 and ***p < 0.001). o AUC of the ipGTT in (n) (***p < 0.0001). p ipITT (*p < 0.05). q AUC of the ipITT in (p) (**p = 0.0096). r HFD feeding program for male control and SPA1KO mice beginning 5 weeks old. s Body weights of 5- to 17-week-old male control and SPA1KO mice fed a HFD for 12 weeks (Control n = 11, SPA1KO n = 9, *p < 0.05). tx 17-week-old male HFD-fed control and SPA1KO. t Representative picture of adipose tissues (iWAT, pgWAT and BAT). Scale bar = 10 mm. u Weights of iWAT (*p = 0.0158), pgWAT (*p = 0.0314) and BAT (***p = 0.0003) (Control n = 12, SPA1KO n = 11). v UCP1-immunostained BAT sections. Scale bars = 100 µm. w, x 17-week-old male HFD-fed control and SPA1KO during 180 min exposed to 4 °C. w Rectal temperatures (Control n = 4, SPA1KO n = 3, *p < 0.05). x Thermal images at 180 min. Data are presented as mean ± SEM. P values were determined using two-tailed Student’s t test: (c, e, g, h, lq, s, u, w); one-way ANOVA post hoc Bonferroni test: (j, k). Source data are provided as a Source Data file.

References

    1. Kopelman, P. G. Obesity as a medical problem. Nature404, 635–643 (2000). - PubMed
    1. Gesta, S., Tseng, Y. H. & Kahn, C. R. Developmental origin of fat: tracking obesity to its source. Cell131, 242–256 (2007). - PubMed
    1. Galic, S., Oakhill, J. S. & Steinberg, G. R. Adipose tissue as an endocrine organ. Mol. Cell Endocrinol.316, 129–139 (2010). - PubMed
    1. Donath, M. Y. & Shoelson, S. E. Type 2 diabetes as an inflammatory disease. Nat. Rev. Immunol.11, 98–107 (2011). - PubMed
    1. Rosen, E. D. & Spiegelman, B. M. What we talk about when we talk about fat. Cell156, 20–44 (2014). - PMC - PubMed

Publication types

MeSH terms