. 2024 Nov 12;15(1):9529.
doi: 10.1038/s41467-024-51847-z.

Nuclear localization of MTHFD2 is required for correct mitosis progression

Affiliations

Nuclear localization of MTHFD2 is required for correct mitosis progression

Natalia Pardo-Lorente et al. Nat Commun. .

Abstract

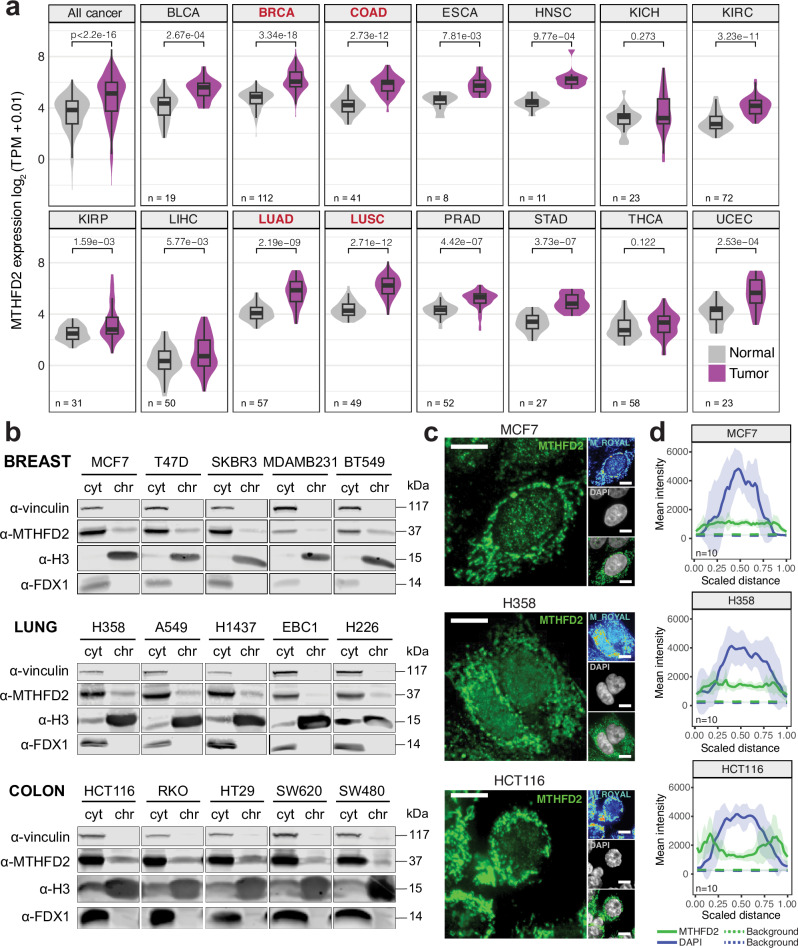
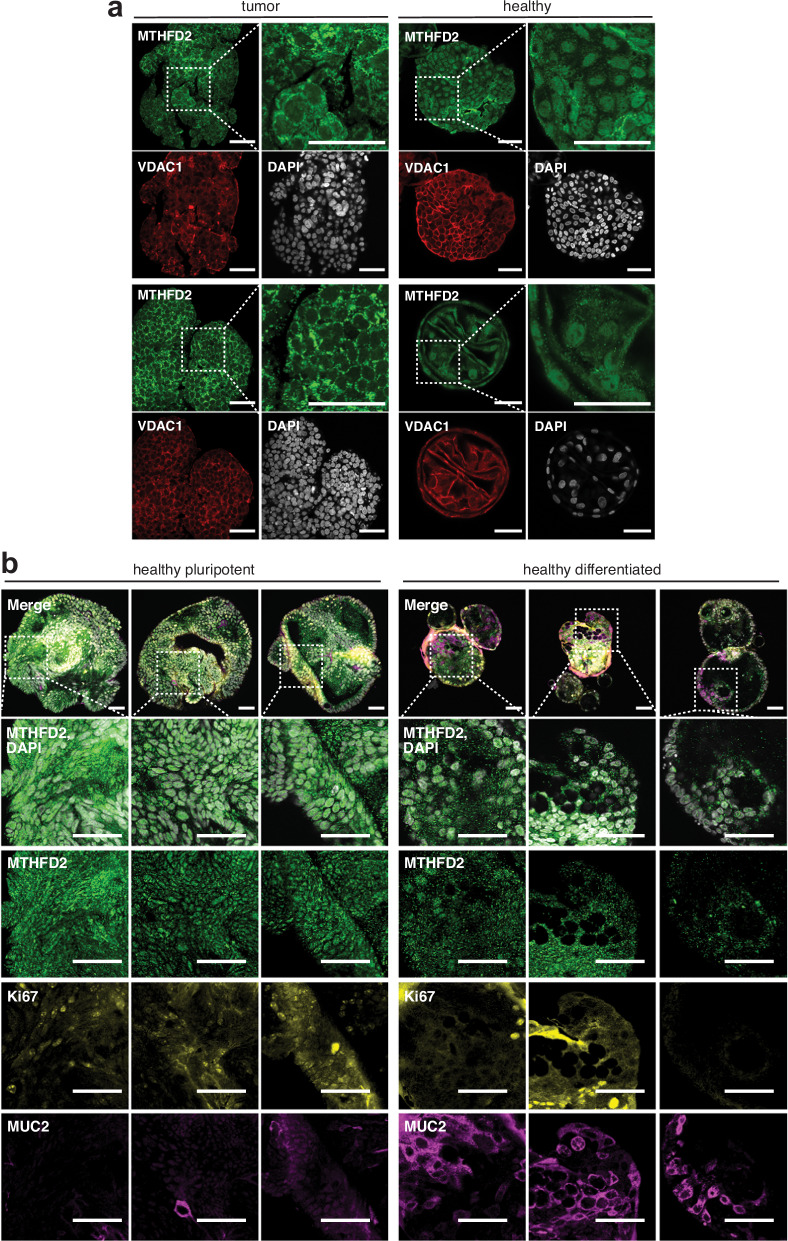
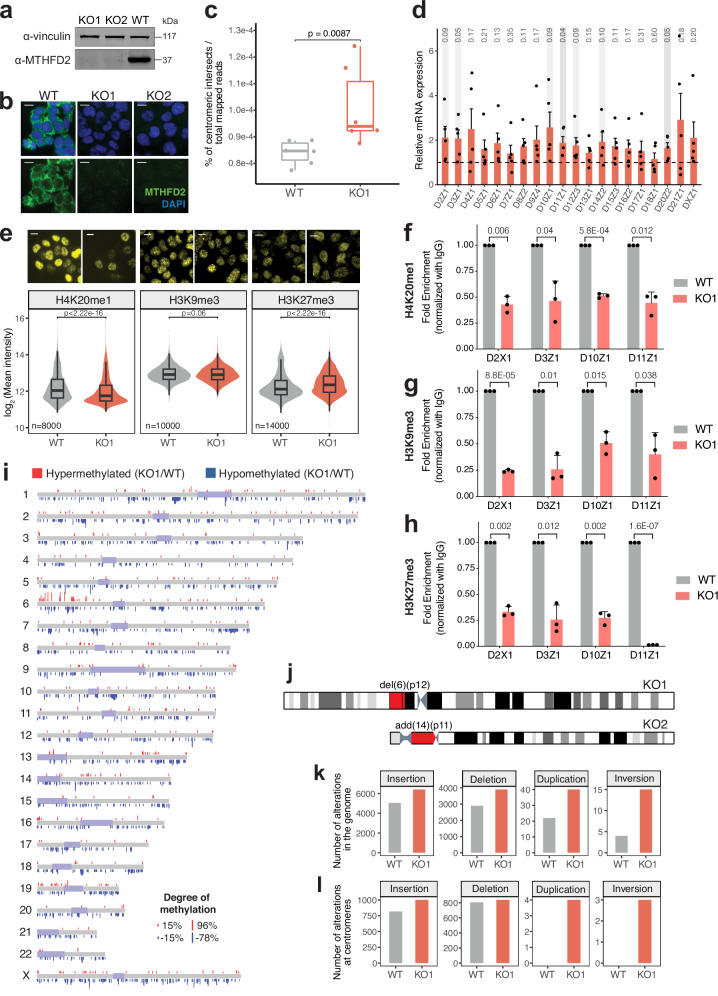
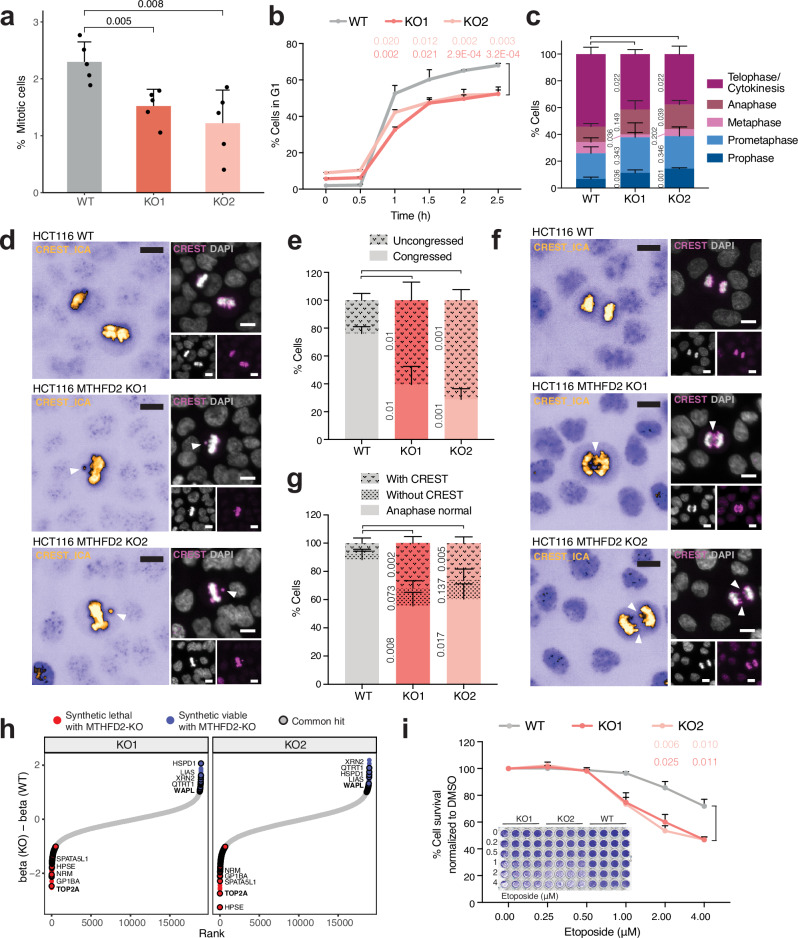
Subcellular compartmentalization of metabolic enzymes establishes a unique metabolic environment that elicits specific cellular functions. Indeed, the nuclear translocation of certain metabolic enzymes is required for epigenetic regulation and gene expression control. Here, we show that the nuclear localization of the mitochondrial enzyme methylenetetrahydrofolate dehydrogenase 2 (MTHFD2) ensures mitosis progression. Nuclear MTHFD2 interacts with proteins involved in mitosis regulation and centromere stability, including the methyltransferases KMT5A and DNMT3B. Loss of MTHFD2 induces severe methylation defects and impedes correct mitosis completion. MTHFD2 deficient cells display chromosome congression and segregation defects and accumulate chromosomal aberrations. Blocking the catalytic nuclear function of MTHFD2 recapitulates the phenotype observed in MTHFD2 deficient cells, whereas restricting MTHFD2 to the nucleus is sufficient to ensure correct mitotic progression. Our discovery uncovers a nuclear role for MTHFD2, supporting the notion that translocation of metabolic enzymes to the nucleus is required to meet precise chromatin needs.


Conflict of interest statement

Competing interests The authors declare no competing interests.

Figures

Fig. 1
Fig. 1. MTHFD2 localizes on chromatin in cancer cells.
a Comparison between Transcripts per Million (TPM) expression values of MTHFD2 in healthy and tumor tissues; paired two-tailed Wilcoxon test (n indicates the number of patients with paired samples for each cancer type). BLDA, bladder urothelial carcinoma; BRCA, breast invasive carcinoma; COAD, colon adenocarcinoma; ESCA, esophageal carcinoma; HNSC, head and neck squamous cell carcinoma; KICH, kidney chromophobe; KIRC, kidney renal clear cell carcinoma; KIRP, kidney renal papillary cell carcinoma; LIHC, liver hepatocellular carcinoma; LUAD, lung adenocarcinoma; LUSC, lung squamous cell carcinoma; PRAD, prostate adenocarcinoma; STAD, stomach adenocarcinoma; THCA, thyroid carcinoma; UCEC, uterine corpus endometrial carcinoma. b Western blot of cytosolic (cyt) and chromatin (chr) fractions after subcellular fractionation in a panel of cancer cell lines. Vinculin, Histone H3 and FDX1 are used as cytosolic, nuclear and mitochondrial markers, respectively. c Immunofluorescence of MTHFD2 in MCF7 (up), H358 (middle) and HCT116 (down) cells. MTHFD2 is shown in green (left) or royal (right) and DAPI in gray; confocal mode, scale bar 10 μm. d MTHFD2 and DAPI mean +/- s.d. intensity line profiles of the cell diameter of the respective cell lines, along with their corresponding backgrounds (n indicates number of individual cells).
Fig. 2
Fig. 2. MTHFD2 localizes in the nucleus in multipotent healthy colon organoids.
a Immunofluorescence of colon cancer (left) and multipotent healthy colon (right) patient-derived organoids. MTHFD2 is shown in green, VDAC1 (mitochondrial marker) in red and DAPI in gray; confocal mode; scale bar 50 μm. b Immunofluorescence of the multipotent healthy colon (left) and differentiated healthy colon (right) patient-derived colon organoids. MTHFD2 is shown in green, DAPI in gray, the proliferation marker Ki67 in yellow, and the differentiation marker Mucin-2 (MUC2) in magenta; confocal mode; scale bar 50 μm.
Fig. 3
Fig. 3. Nuclear MTHFD2 interacts with key cell division factors.
a Volcano plot of top nuclear MTHFD2 interactors identified in HCT116 cells. Interactors with a log2 fold change >= 2.3 and Bonferroni False Discovery Rate (BFDR) <= 0.2 are colored according to their functional category. IP, immunoprecipitation. b Network of top nuclear MTHFD2 interactors. The color indicates the functional category, the size represents the fold change and the width of the edges shows the interaction score. c Biological Process gene ontologies enriched in MTHFD2 core co-expressed genes. d One-carbon folate metabolism pathway with enzymes colored by the enrichment of mitotic terms in the Gene Ontology enrichment analysis performed with their core co-expressed genes. Gray indicates the absence of data. DHF, dihydrofolate; THF, tetrahydrofolate. Scheme adapted from Lin et al. . Two-dimensional density plots of 5% top cells with the highest nuclear (e, g) or cytosolic (f, h) MTHFD2 signal obtained from the adapted FUCCI4 MCF7 (e, f) and U2OS (g, h) cells along with the cell cycle phase; turquoise and clover mean intensities (x and y axis, respectively) are in log10 scale.
Fig. 4
Fig. 4. MTHFD2 KO induces aberrant centromere overexpression, strong methylation defects and increased structural variation.
a Western blot of HCT116 MTHFD2 knock-out (KO1, KO2) and wild-type (WT) cells. Vinculin is used as loading control. b Immunofluorescence of MTHFD2 WT, KO1 and KO2 cells. MTHFD2 is shown in green and DAPI in blue; non-confocal mode, scale bar 10 μm. c Percentage of centromeric intersects normalized by the total mapped reads in WT and KO1 cells (n = 6); unpaired two-tailed Wilcoxon test. d Relative mRNA expression of 20 chromosomal centromeres in KO1 cells normalized to WT cells. The dashed line indicates fold change = 1; means + s.e.m. (n = 5), one-sample two-tailed t-test (P values for each centromere are indicated on the top). e Comparison of the log2 mean intensity of nuclear levels of histone marks H4K20me1, H3K9me3, and H3K27me3 in WT and KO1 cells; unpaired two-tailed Wilcoxon test. Representative images are shown above; non-confocal mode, scale bar 10 μm. fh Fold enrichment of H4K20me1 (f), H3K9me3 (g), and H3K27me3 (h) signal normalized to IgG in centromeric regions of 4 independent chromosomes in WT and KO1 cells; means + s.d. (n = 3), one-sample two-tailed t-test. i Whole-genome scheme showing the hypermethylated CpG sites in red and hypomethylated CpG sites in blue. Regions shown in pale purple correspond to the centromeres and peri-centromeres. The height of the bars is proportional to the degree of hyper- or hypomethylation. j Chromosomes 6 and 14 showing the peri-centromeric alterations found in KO1 and KO2 cells in red. Number of alterations (insertions, deletions, duplications or inversions) found in WT and KO1 cells in the whole-genome (k) or at the centromeric regions (l). Source data are provided as a Source Data file. The n indicates the number of biological sample replicates for c, d, fh, and number of individual cells for e. For e, individual cells from 4 biological replicates were pooled.
Fig. 5
Fig. 5. MTHFD2 loss impairs mitosis progression.
a Percentage of mitotic cells in HCT116 MTHFD2 wild-type (WT) and knock-out (KO1, KO2) conditions, measured with the mitotic marker histone H3 phospho-Ser10 by high-throughput immunofluorescence; means + s.d. (n = 5), unpaired two-tailed t-test. b Percentage of WT, KO1, and KO2 cells in G1 phase at 0, 0.5, 1, 1.5, 2, and 2.5-hour release after RO-3306 drug treatment for 20 hours; means + s.d. (n = 3), at indicated times, unpaired two-tailed t-test. c Percentage of WT, KO1, and KO2 cells at different mitotic phases; means + s.d. (n = 3), a minimum of 150 mitotic cells per replicate were analyzed, unpaired two-tailed t-test. Representative images (d) and quantification (e) of uncongressed chromosomes in metaphase in WT, KO1 and KO2 cells. CREST is shown in ICA (left) or magenta (right) and DAPI in gray; non-confocal mode, scale bar 10 μm. For the quantification, means + s.d. (n = 3), a minimum of 10 metaphase cells were analyzed, unpaired two-tailed t-test. Representative images (f) and quantification (g) of anaphase defects in WT, KO1 and KO2 cells. CREST is shown in ICA (left) or magenta (right) and DAPI in gray; non-confocal mode, scale bar 10 μm. For the quantification, means + s.d. (n = 3), a minimum of 25 anaphase cells were analyzed, unpaired two-tailed t-test. h Difference between the beta score of all genes in KO and WT cells. Synthetic lethal hits with MTHFD2 KO with a beta score < −1 are shown in red, and synthetic viable hits with MTHFD2 KO with a beta score > 1 are shown in blue. Shared hits between both KOs are indicated with a black stroke. i Percentage of survivor WT, KO1, and KO2 cells normalized to DMSO after etoposide treatment with indicated concentrations for 72 hours; means + s.d. (n = 3), unpaired two-tailed t-test. Inside the graph, a representative scanned image of one replicate (4 technical replicates are shown per condition). Source data are provided as a Source Data file. The n indicates the number of biological sample replicates for ac, e, g, i.
Fig. 6
Fig. 6. Nuclear MTHFD2 is sufficient for mitosis progression.
a Percentage of mitotic cells in HCT116 MTHFD2 wild-type (WT), nuclear (NLS), and knock-out (KO1, KO2) conditions; means + s.d. (n = 3), unpaired two-tailed t-test. b Percentage of WT, NLS and KO1 cells at different mitotic phases; means + s.d. (n = 3), a minimum of 100 mitotic cells per replicate were analyzed, unpaired two-tailed t-test. c Quantification of anaphase bridges in WT, NLS and KO1 cells; means + s.d. (n = 3), a minimum of 10 anaphases per replicate were analyzed, unpaired two-tailed t-test. d Comparison of the log2 mean intensity of nuclear levels of H4K20me1 in WT, NLS, KO1 and KO2 cells; unpaired two-tailed Wilcoxon test. Representative images are shown on the right; non-confocal mode, scale bar 10 μm. Source data are provided as a Source Data file. The n indicates the number of biological sample replicates for ac; and the number of individual cells for d, where 3 biological replicates were pooled.
Fig. 7
Fig. 7. Nuclear MTHFD2 catalytic activity is required for mitosis progression.
a Proportion of HCT116 mitotic cells treated with the indicated concentrations of TH9619 inhibitor for 96 hours normalized to DMSO condition; means + s.d. (n = 3), one-sample two-tailed t-test. b Percentage of HCT116 cells treated with DMSO or 63 nM TH9619 inhibitor for 96 hours at different mitotic phases; means + s.d. (n = 3), a minimum of 300 mitotic cells per replicate were analyzed, unpaired two-tailed t-test. c Quantification of anaphase bridges in HCT116 cells treated with DMSO or 63 nM TH9619 inhibitor for 96 hours; means + s.d. (n = 3), a minimum of 40 anaphase cells per replicate were analyzed, unpaired two-tailed t-test. d Representative images of anaphase defects in HCT116 cells treated with DMSO or 63 nM TH9619 inhibitor for 96 hours. DAPI is shown in gray and H3 phospho-Ser10 (H3PS10) is shown in red (second row) or ICA (third row); non-confocal mode, scale bar 10 μm. e Quantification (left) and representative images (right) of micronuclei in HCT116 cells treated with DMSO or 63 nM TH9619 inhibitor for 96 hours. CREST is shown in magenta and DAPI in gray; non-confocal mode, scale bar 10 μm. For the quantification, means + s.d. (n = 3), a minimum of 3500 cells per replicate were analyzed, unpaired two-tailed t-test. f Comparison of the log2 mean intensity of nuclear levels of H4K20me1 in HCT116 cells treated with DMSO or the indicated concentrations of TH9619 inhibitor for 96 hours; unpaired two-tailed Wilcoxon test. Representative images are shown on the right; non-confocal mode, scale bar 10 μm. Source data are provided as a Source Data file. The n indicates the number of biological sample replicates for ac, e; and the number of individual cells for f, where 3 biological replicates were pooled.

References

    1. Reid, M. A., Dai, Z. & Locasale, J. W. The impact of cellular metabolism on chromatin dynamics and epigenetics. Nat. Cell Biol.19, 1298–1306 (2017). - PMC - PubMed
    1. Wong, C. C., Qian, Y. & Yu, J. Interplay between epigenetics and metabolism in oncogenesis: mechanisms and therapeutic approaches. Oncogene36, 3359–3374 (2017). - PMC - PubMed
    1. Crispo, F. et al. Metabolic dysregulations and epigenetics: a bidirectional interplay that drives tumor progression. Cells8, 798 (2019). - PMC - PubMed
    1. Lin, J. M. G. et al. Metabolic modulation of transcription: The role of one-carbon metabolism. Cell Chem. Biol.29, 1664–1679 (2022). - PubMed
    1. Schvartzman, J. M., Thompson, C. B. & Finley, L. W. S. Metabolic regulation of chromatin modifications and gene expression. J. Cell Biol.217, 2247–2259 (2018). - PMC - PubMed

Publication types

MeSH terms

Substances

Associated data

LinkOut - more resources