. 2024 Nov 12;15(1):9775.
doi: 10.1038/s41467-024-52985-0.

Simultaneous detection of membrane contact dynamics and associated Ca2+ signals by reversible chemogenetic reporters

Affiliations

Simultaneous detection of membrane contact dynamics and associated Ca2+ signals by reversible chemogenetic reporters

Paloma García Casas et al. Nat Commun. .

Abstract

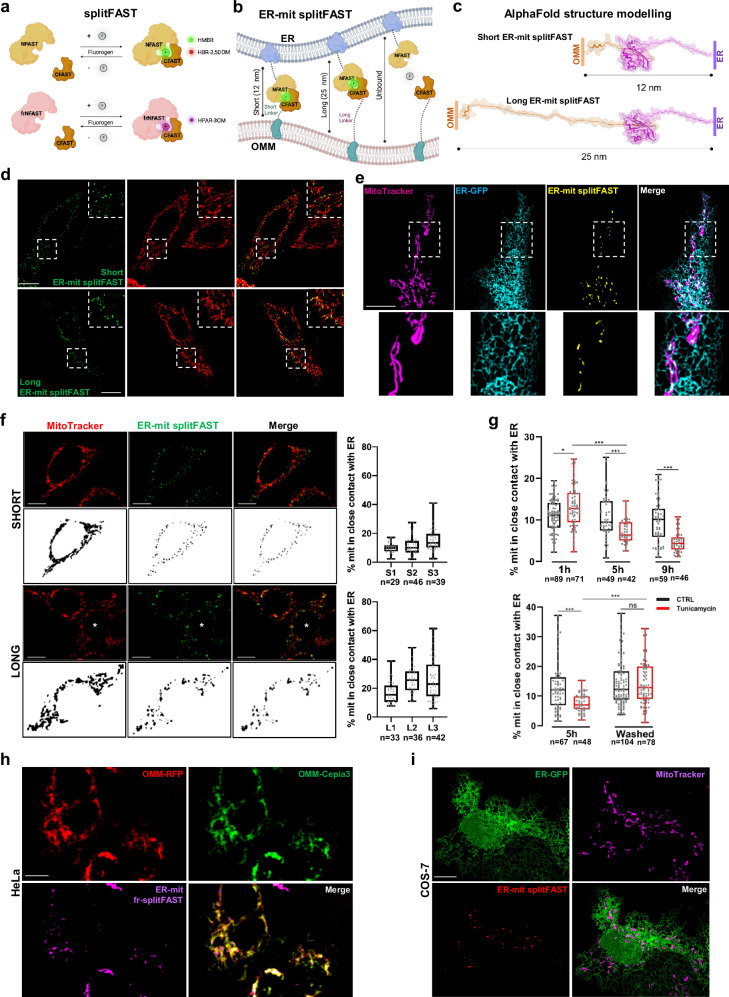
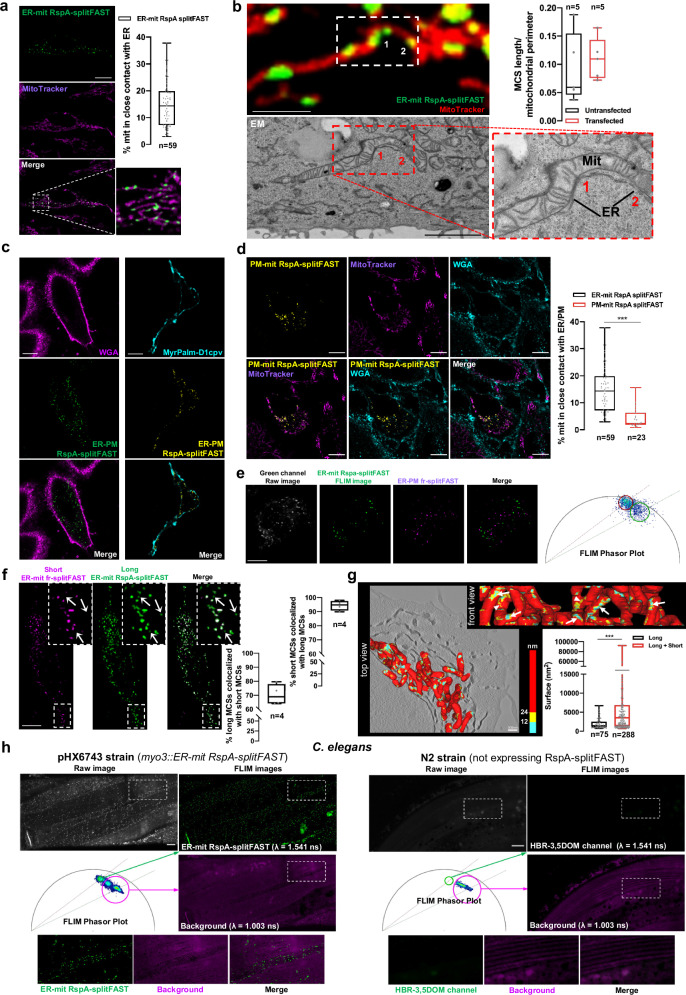
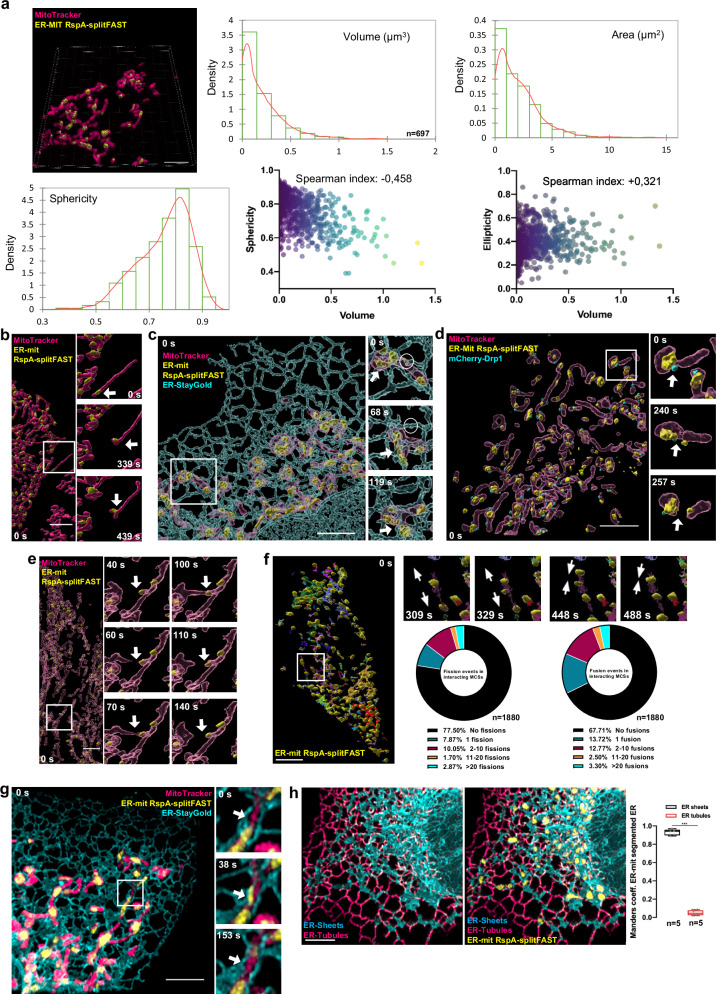
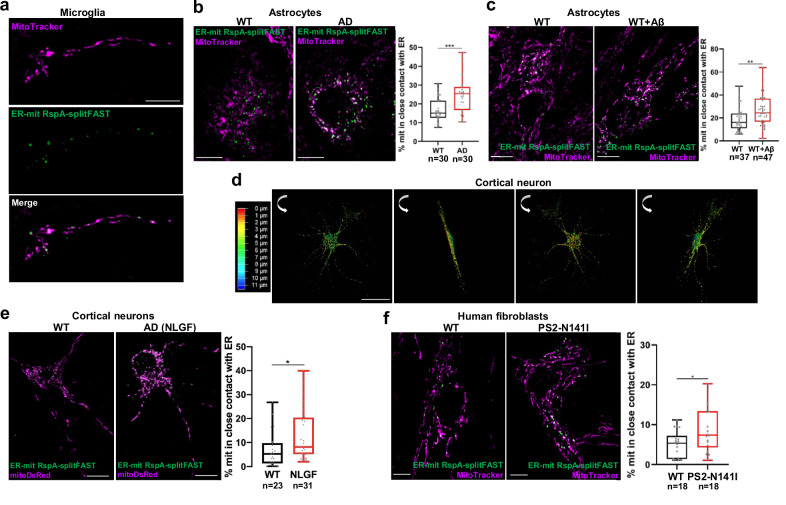
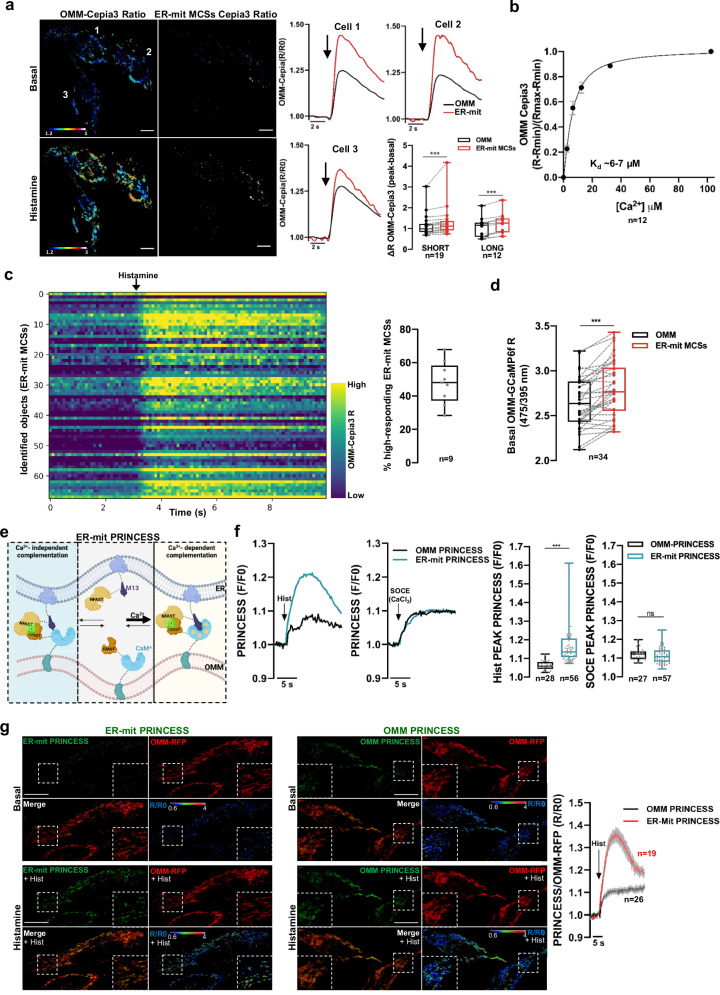
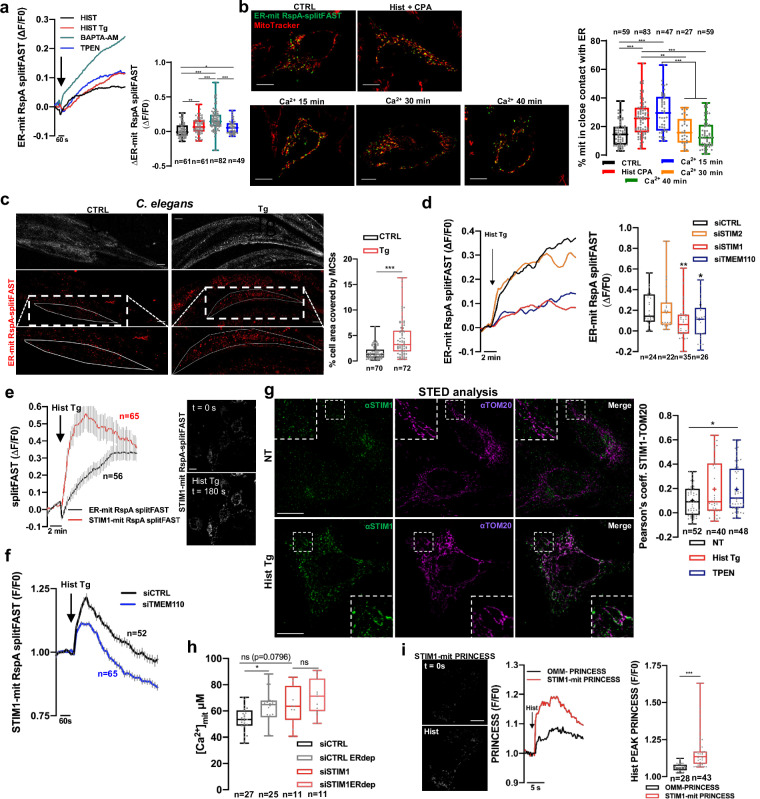
Membrane contact sites (MCSs) are hubs allowing various cell organelles to coordinate their activities. The dynamic nature of these sites and their small size hinder analysis by current imaging techniques. To overcome these limitations, we here design a series of reversible chemogenetic reporters incorporating improved, low-affinity variants of splitFAST, and study the dynamics of different MCSs at high spatiotemporal resolution, both in vitro and in vivo. We demonstrate that these versatile reporters suit different experimental setups well, allowing one to address challenging biological questions. Using these probes, we identify a pathway in which calcium (Ca2+) signalling dynamically regulates endoplasmic reticulum-mitochondria juxtaposition, characterizing the underlying mechanism. Finally, by integrating Ca2+-sensing capabilities into the splitFAST technology, we introduce PRINCESS (PRobe for INterorganelle Ca2+-Exchange Sites based on SplitFAST), a class of reporters to simultaneously detect MCSs and measure the associated Ca2+ dynamics using a single biosensor.


Conflict of interest statement

Competing interests A.G. is co-founder and holds equity in Twinkle Bioscience/The Twinkle Factory, a company commercializing the FAST and split-FAST technologies. The remaining authors declare no competing interests.

Figures

Fig. 1
Fig. 1. The splitFAST system for studying membrane contact site dynamics.
a The cartoon represents the splitFAST system, formed by the NFAST and the CFAST portions, that are not fluorescent per se, unless assembled and bound to a fluorogen: green, red or far-red (this latter requiring frNFAST). Created in BioRender. Garcia Casas, P. (2023) BioRender.com/l67i901. b, c The cartoon (b) represents the tailoring of splitFAST to mark ER-mit MCSs. Created in BioRender. Garcia Casas, P. (2023) BioRender.com/e32h348. By targeting the NFAST portion to the ER membrane and CFAST10 to the OMM, both separated by unstructured linkers of different sizes as modelled by AlphaFold (c), two different probes have been generated to study ER-mit MCSs: the short ER-mit splitFAST, with a length of ~12 nm, and the long ER-mit splitFAST, of ~25 nm. The proposed AlphaFold structures provide static models of the probes in an extended conformation, but the unstructured linkers can bend and adopt multiple conformations (see Methods). d Representative confocal images of HeLa cells co-expressing either the short or the long ER-mit splitFAST (exhibiting a dotted pattern along mitochondria) with a mit-RFP. e Representative confocal image of a COS-7 cell co-expressing the short ER-mit splitFAST and an ER-GFP, stained by MitoTracker Deep Red. A dotted ER-mit splitFAST signal colocalizes with both the ER and mitochondria, marking sites of close contact between the two organelles. f Representative confocal images of stable HeLa cell clones expressing either the short (S1, S2, S3) or the long (L1, L2, L3) version of the ER-mit splitFAST probes. A dotted signal along mitochondria (labelled by MitoTracker Deep Red) is shown, allowing the calculation of the percentage of the mitochondrial surface (% mit) covered by either short or long contacts with the ER (box plots on the right, see “Methods”). The cell indicated with a white asterisk is shown in the corresponding binary image used for analysis. g The box plots represent the dynamic changes of ER-mit MCSs (calculated as in panel (f)) in HeLa cells expressing the short ER-mit splitFAST, upon treatments with Tunicamycin (5 μg/ml). Recovery of basal levels of ER-mit MCSs was observed after Tunicamycin removal. h, i Representative confocal images of (h) HeLa cells co-expressing OMM-RFP, OMM-Cepia3 and short ER-mit fr-splitFAST probe, or (i) of COS-7 cells co-expressing ER-GFP, short ER-mit splitFAST and in which mitochondria were marked with MitoTracker Deep Red. Scale bar: 10 μm (d–f, h, i).
Fig. 2
Fig. 2. The RspA-splitFAST system to investigate ER-mit, ER-PM, PM-mit MCSs in vitro and in vivo.
a Representative confocal images of HeLa cells expressing short ER-mit RspA-splitFAST and stained with MitoTracker Deep Red. The box plot shows the percentage of mitochondrial surface co-localized with ER-mit RspA-splitFAST. b Representative confocal image (top) of a region of a HeLa cell expressing short ER-mit RspA-splitFAST and stained with MitoTracker Red. The fluorescent splitFAST dots (two representative dots were marked “1”/“2”) correspond to sites of close ER-mit membrane juxtaposition, as revealed by the EM slice of the very same cell region (bottom; see also Supplementary Movie 2). The fraction of mitochondrial perimeter in close contact with ER, analysed by CLEM, is similar in untransfected and ER-mit RspA-splitFAST-expressing (transfected) cells (box plots). c Representative confocal images of HeLa cells expressing ER-PM RspA-splitFAST, in which PM was labelled by either WGA staining or MyrPalm-D1cpv expression. ER-PM MCSs were visualized by addition of respectively HMBR (left) or HBR-3,5DOM (right). d Representative confocal images of PM-mit RspA-splitFAST-expressing HeLa cells, stained with MitoTracker and WGA (PM). The box plots represent the percentage of mitochondrial surface in contact with either ER (same as in panel (a)) or PM. e Representative confocal images of HeLa cells co-expressing ER-PM fr-splitFAST and ER-mit RspA-splitFAST. The far-red signal is exclusively emitted by ER-PM fr-splitFAST (marking ER-PM MCSs); the green signal can be emitted by both ER-mit RspA-splitFAST and ER-PM fr-splitFAST (as fr-splitFAST can also incorporate the green and red fluorogens). As the lifetimes of the ER-mit RspA-splitFAST and ER-PM fr-splitFAST green signals are different (see FLIM Phasor Plot, Supplementary Fig. 1i and Methods), ER-mit and ER-PM MCSs were distinguished in the very same cells by FLIM. f Representative confocal images of a HeLa cell, co-expressing ER-long-RspA-NFAST, ER-short-frNFAST and OMM-short-RspA-CFAST to simultaneously visualize short and long ER-mit MCSs. The signals were separated by FLIM (see e). Arrows indicate few long MCSs that do not colocalize with short ones (see box plots on the right). g Tomographic 3D reconstruction of a portion of HeLa cell, showing mitochondrial surface (red) and the regions of juxtaposition with ER, either close (<12 nm, cyan areas, corresponding to short ER-mit MCSs) or wider (12–24 nm range, yellow areas, corresponding to long ER-mit MCSs). Most short ER-mit MCSs are continuous with long ones (white arrows, front view box). The box plot represents the surface of either the few long contacts not containing short ones (Long, white arrowheads in the top view) or those continuous with short MCSs. See also Supplementary Movie 3. h Representative confocal images of the Caenorhabditis elegans strain pHX6743 (expressing ER-mit RspA-splitFAST under the myo3 promoter) or N2 (not expressing RspA-splitFAST). The fluorescent signals of ER-mit RspA-splitFAST (complemented with HBR-3,5DOM) and of background were separated by FLIM (See Phasor Plot). Scale bar: 10 µm (a, c–f, h); 2 µm (b); 500 nm (g).
Fig. 3
Fig. 3. ER-mit MCS dynamics.
a Representative Airyscan 3D image of a COS-7 cell co-expressing ER-mit RspA-splitFAST (surface rendering, yellow), the ER-marker ER-StayGold and stained with MitoTracker Deep Red. Distribution graphs represent the Kernel density (orange) and the histogram (green) of volume, area and sphericity values of ER-mit RspA-splitFAST dots (see “Methods”). Dispersion plots show a negative correlation between volume and sphericity (left) and a positive correlation between volume and ellipticity (right). b Representative lattice light-sheet microscopy 3D image of a HeLa cell clone expressing ER-mit RspA-splitFAST (surface rendering, yellow) and stained with MitoTracker Deep Red. The time-lapse shows the maintenance of an ER-mit MCS during an extensive mitochondrial movement, followed by branching at the MCSs (arrows). See also the corresponding Supplementary Movie 4. c Representative Airyscan image of a COS-7 cell as in panel (a). The time-lapse shows co-sliding of mitochondria, ER and ER-mit RspA-splitFAST dots (arrow), as well as the disappearance of an ER-mit MCS (circle, first frame) upon mitochondria detachment from ER tubules. See also the corresponding Supplementary Movie 5. d Representative Airyscan 3D image (surface rendering) of a COS-7 cell co-expressing ER-mit RspA-splitFAST, mCherry-Drp1 and stained with MitoTracker Deep Red. The time-lapse shows mCherry-Drp1 localization at a site of mitochondria and ER-mit MCS fission (arrow). See also the corresponding Supplementary Movie 6. e Representative image as for panel (b). The time-lapse shows an ER-mit MCS movement (arrow) at a site of mitochondria “Kiss-and-run” fusion (40–70 s) followed by organelle fission (100–140 s). See also the corresponding Supplementary Movie 7. f Representative 3D image of a HeLa cell expressing ER-mit RspA-splitFAST (surface rendering). ER-mit RspA-splitFAST dots (tracked using IMARIS, see Methods) move in space and interact each other. Tracks (coloured continuous lines) report MCS movements and interactions. ER-mit MCSs undergoing fusion/fission are considered part of the same track. Enlarged regions show the time-lapse of a MCS undergoing fission (309–329 s), and two MCSs fusing together (448–488 s). Charts represent the percentage of interacting ER-mit MCS subgroups (tracks) for each range of fission/fusion events, as indicated. See also the corresponding Supplementary Movie 8. g Representative Airyscan 3D image of a COS-7 cell co-expressing ER-mit RspA-splitFAST, ER-StayGold and stained with MitoTracker Deep Red. Enlarged regions show the time-lapse of the appearance (38 s) of an ER-mit MCS (arrow), upon ER and mitochondria membrane docking, and its following disappearance (153 s), upon organelle distancing (arrow). See also the corresponding Supplementary Movie 9. h Representative 3D image of a COS-7 cell co-expressing ER-mit RspA-splitFAST, ER-StayGold and stained with MitoTracker Deep Red. ER-StayGold signal has been segmented (see “Methods”) to separate ER tubules from sheets. Manders’ co-localization M2 coefficient of ER-mit MCSs with ER sheets/tubules is shown (box plots). Scale bar: 5 µm (ah).
Fig. 4
Fig. 4. ER-mit MCSs in different brain cells and Alzheimer’s disease cell models.
af Representative confocal images of different ER-mit RspA-splitFAST-expressing cells. Where indicated, cells were co-stained with MitoTracker Deep Red or mitoDsRed, used as mitochondrial marker. ER-mit MCSs are shown in mouse primary microglia (a), astrocytes (b, c), cortical neurons (d, e) and human fibroblasts (f). In (b, c, e, f) the box plots represent the percentage of mitochondrial surface co-localized with ER-mit RspA-splitFAST for the indicated cell types. In b, astrocytes from WT or AD mice were compared. In (c) astrocytes from WT mice were exposed (WT + Aβ) or not (WT) to a conditioned medium containing naturally generated Aβ peptides (see Methods). In (e) cortical neurons from WT or AD (AppNL-G-F, shortened as NLGF) mice were compared. In (f) primary human skin fibroblasts from either a healthy donor (WT) or a familial AD patient (PS2-N141I) were compared. *p < 0.05; **p < 0.01; ***p < 0.001. d Confocal microscopy 3D projection of the ER-mit RspA-splitFAST fluorescent signal in a cortical neuron from WT mice. The colour bar on the left represents the depth (in µm) along the z-axis. See also the corresponding Supplementary Movie 12. Scale bar: 10 µm (ac, e, f); 50 µm (d).
Fig. 5
Fig. 5. Measurements of Ca2+ signals at MCSs by PRINCESS.
a Representative images of the 475/390 nm ratio (R, see Methods) of OMM-Cepia3, co-expressed in HeLa cells with either short or long ER-mit RspA-splitFAST to mark short or long ER-mit MCSs. The ratio images of OMM-Cepia3 and of the portion of OMM-Cepia3 co-localized with ER-mit RspA-splitFAST (ER-mit MCSs Cepia3 Ratio) are shown, before (basal) and upon histamine (100 µM) stimulation. On the right, traces represent the ratios of OMM-Cepia3 (OMM) or of the portion of OMM-Cepia3 co-localized with short ER-mit RspA-splitFAST (ER-mit) upon histamine stimulation (arrows), for the three cells on the left. The box plots represent the ΔR of OMM-Cepia3 upon histamine stimulation either in the bulk OMM or in the regions co-localized with ER-mit MCSs, in cells expressing either short or long ER-mit RspA-splitFAST, as indicated. b OMM-Cepia3, expressed in HeLa cells, was calibrated by permeabilizing cells with digitonin (25 µM) in intracellular-like buffer and adding fixed Ca2+ concentrations. Ratiometric 475/390 nm measurements were performed (see Methods). Mean ± SEM. c The heat map represents the OMM-Cepia3 Ratio over time in the sub-regions co-localized with short ER-mit MCSs (identified as single objects, y axis) of a HeLa cell (as in a). Upon histamine stimulation, ~50% of ER-mit MCSs experiences high Ca2+ concentrations (box plot on the right). d The box plot represents the 475/390 nm ratio (R, see Methods) of OMM-GCaMP6f in HeLa cells in basal conditions, either in the bulk OMM or at short ER-mit MCSs (identified by co-expression and co-localization with ER-mit RspA-splitFAST). e The cartoon represents the rationale behind ER-mit PRINCESS design. Mutated Calmodulin (CaM*) from Cepia3 and the M13 peptide were incorporated within ER-mit splitFAST, to provide Ca2+-sensing capabilities. Created in BioRender. Garcia Casas, P. (2023) BioRender.com/f06c444. f Representative traces of ER-mit PRINCESS or OMM-PRINCESS fluorescence in HeLa cells, upon histamine (100 µM) stimulation in Ca2+-free mKRB (see Methods), or CaCl2 (2 mM) addition (SOCE) after 6 min depletion of ER Ca2+ content (obtained by histamine and thapsigargin (100 nM) stimulation in Ca2+-free mKRB). On the right, box plots represent the peaks of OMM- or ER-mit PRINCESS fluorescence (expressed as F/F0) upon the indicated treatments. g Representative confocal images of HeLa cells co-expressing OMM-RFP (used to normalize the fluorescent signal) with either ER-mit PRINCESS or OMM-PRINCESS, before (basal) or upon histamine (100 µM) stimulation in Ca2+-free mKRB. The PRINCESS/OMM-RFP ratio images are also shown. See also the corresponding Supplementary Movies 13 and 14. On the right, the corresponding traces (mean ± SEM) of the ratio signals for the indicated conditions are shown. Scale bar: 10 µm (a, g).
Fig. 6
Fig. 6. STIM1 mediates ER-mit MCS remodelling upon ER Ca2+ depletion.
a Representative traces of ER-mit RspA-splitFAST fluorescence in HeLa cells upon ER Ca2+ depletion by different treatments (arrow): 100 μM histamine (HIST); 100 μM histamine plus 100 nM thapsigargin (HIST Tg); pre-treatment (30 min) with 10 µM BAPTA-AM followed by 100 μM histamine plus 100 nM thapsigargin (BAPTA-AM); 500 μM TPEN. The box plot represents the change in ER-mit RspA-splitFAST fluorescence (ΔF/F0) 15 min after the indicated cell stimulations. b Representative confocal images of HeLa cells, expressing ER-mit RspA-splitFAST and labelled with MitoTracker, in different conditions: at basal, (CTRL); 15 min after stimulation with 100 μM histamine plus 20 μM cyclopiazonic acid (Hist CPA) and 15, 30, or 40 min after washing of Hist+CPA and re-addition of 2 mM CaCl2 (to refill ER Ca2+). The box plots represent the corresponding percentages of mitochondrial surface in contact with ER. c Representative confocal images (max projection) of ER-mit RspA-splitFAST signal in pHX6743 worms, either treated with thapsigargin (Tg, see “Methods”) or not (CTRL). The box plot represents the percentage of cell area covered by ER-mit MCSs. d Representative traces of ER-mit RspA-splitFAST fluorescence upon ER Ca2+ depletion (Hist Tg) in HeLa cells transfected with control (siCTRL) or STIM1-, STIM2- or TMEM110-specific siRNAs. The box plot represents the change in ER-mit RspA-splitFAST fluorescence (ΔF/F0) 15 min after cell stimulation. e Traces (mean ± SEM) of either ER-mit RspA-spiltFAST or STIM1-mit RspA-splitFAST fluorescence upon Hist Tg treatment in HeLa cells. Right, representative images of HeLa cells expressing STIM1-mit RspA-splitFAST, before (t = 0 s) or 180 s after exposure to Hist Tg. f Traces (mean ± SEM) of STIM1-mit RspA-splitFAST fluorescence (F/F0) upon ER Ca2+ depletion (Hist Tg) in HeLa cells, co-transfected with either control or TMEM110-specific siRNA. g Representative STED images of HeLa cells untreated (NT) or stimulated for 15 min with Hist Tg, immunolabeled with αSTIM1 + αTOM20 antibodies. The box plot represents the Pearson’s co-localization coefficient between STIM1 and TOM20 signals, after 15 min in the indicated conditions (500 μM TPEN was used as an alternative treatment to deplete ER Ca2+). h The box plots represent mitochondrial Ca2+ peaks upon histamine-induced ER Ca2+ release in Hela cells, expressing mitochondrial Aequorin (see Methods) and transfected with control (siCTRL) or STIM1-specific siRNAs. Before the experiments, cells were transiently (15 min) treated (ERdep) or not with 500 μM TPEN. i Representative images of HeLa cells expressing STIM1-mit PRINCESS, before (t = 0 s) and 2 s after stimulation with histamine (Hist). Representative traces of OMM-PRINCESS or STIM1-mit PRINCESS fluorescence in HeLa cells, treated with histamine (Hist) in Ca2+-free mKRB, are shown. On the right, the box plots represent the peaks of OMM- or STIM1-mit PRINCESS fluorescence (expressed as F/F0) upon histamine stimulation (OMM-PRINCESS data as in Fig. 5f). Scale bar: 10 µm (b, c, e, g, i).

References

    1. Prinz, W. A., Toulmay, A. & Balla, T. The functional universe of membrane contact sites. Nat. Rev. Mol. Cell Biol.21, 7–24 (2020). - PMC - PubMed
    1. Scorrano, L. et al. Coming together to define membrane contact sites.Nat. Commun.10, 1287 (2019). - PMC - PubMed
    1. Filadi, R., Theurey, P. & Pizzo, P. The endoplasmic reticulum-mitochondria coupling in health and disease: molecules, functions and significance. Cell Calcium62, 1–15 (2017). - PubMed
    1. Markovinovic, A., Greig, J., Martín-Guerrero, S. M., Salam, S. & Paillusson, S. Endoplasmic reticulum-mitochondria signaling in neurons and neurodegenerative diseases.J. Cell Sci.135, jcs248534 (2022). - PubMed
    1. Rossini, M., Pizzo, P. & Filadi, R. Better to keep in touch: investigating inter-organelle cross-talk. FEBS J.288, 740–755 (2021). - PubMed

Publication types

LinkOut - more resources