. 2024 Nov 12;15(1):9810.
doi: 10.1038/s41467-024-54131-2.

Structural basis of MICAL autoinhibition

Affiliations

Structural basis of MICAL autoinhibition

Matej Horvath et al. Nat Commun. .

Abstract

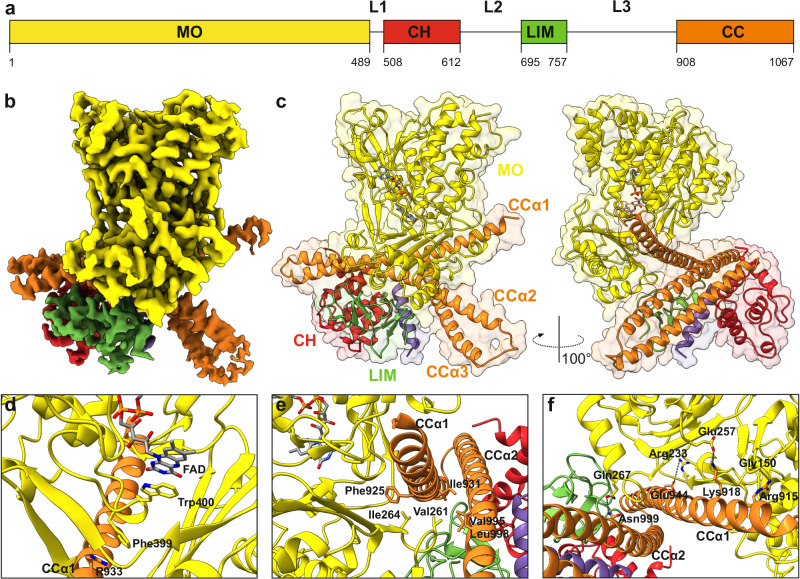
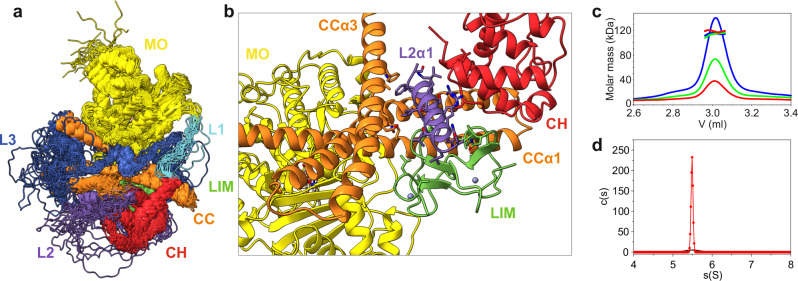
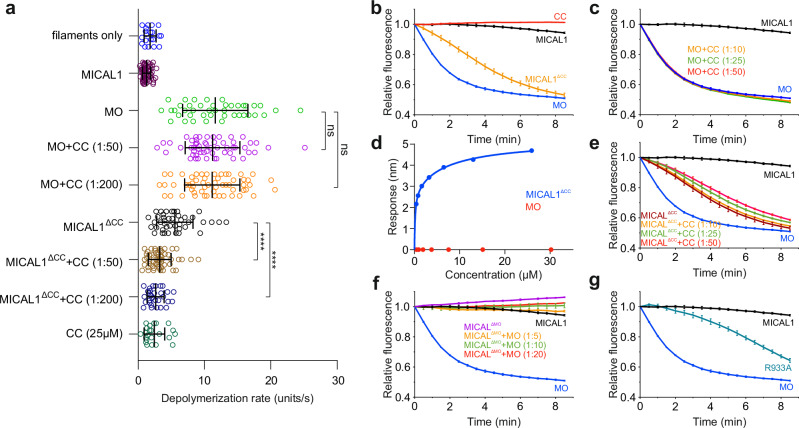
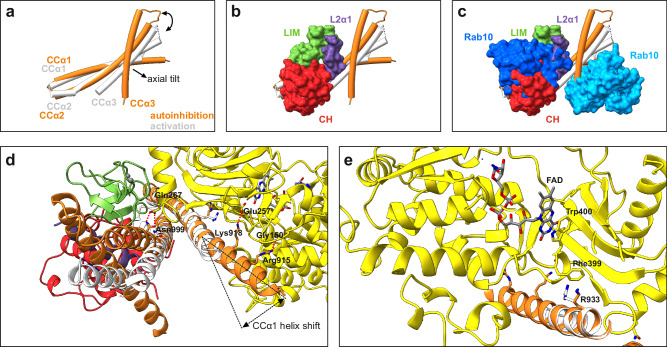
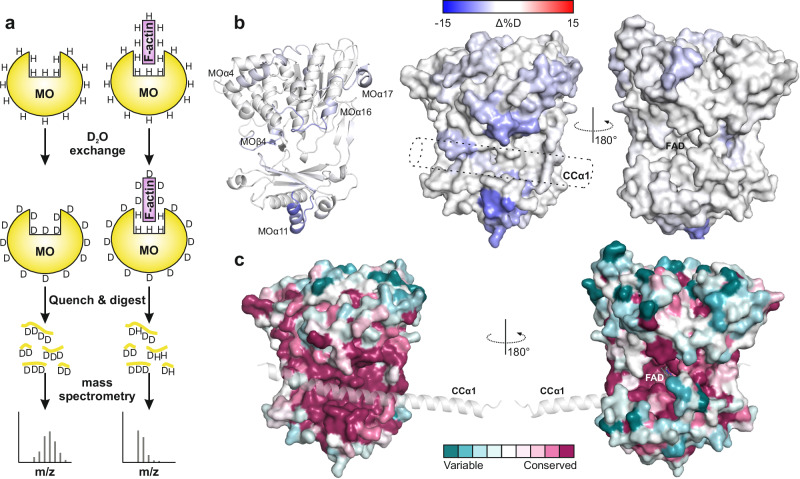
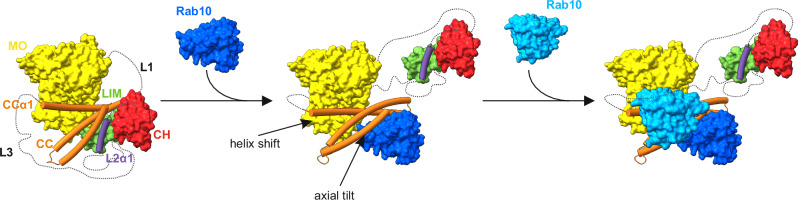
MICAL proteins play a crucial role in cellular dynamics by binding and disassembling actin filaments, impacting processes like axon guidance, cytokinesis, and cell morphology. Their cellular activity is tightly controlled, as dysregulation can lead to detrimental effects on cellular morphology. Although previous studies have suggested that MICALs are autoinhibited, and require Rab proteins to become active, the detailed molecular mechanisms remained unclear. Here, we report the cryo-EM structure of human MICAL1 at a nominal resolution of 3.1 Å. Structural analyses, alongside biochemical and functional studies, show that MICAL1 autoinhibition is mediated by an intramolecular interaction between its N-terminal catalytic and C-terminal coiled-coil domains, blocking F-actin interaction. Moreover, we demonstrate that allosteric changes in the coiled-coil domain and the binding of the tripartite assembly of CH-L2α1-LIM domains to the coiled-coil domain are crucial for MICAL activation and autoinhibition. These mechanisms appear to be evolutionarily conserved, suggesting a potential universality across the MICAL family.


Conflict of interest statement

Competing interests The authors declare no competing interests.

Figures

Fig. 1
Fig. 1. Cryo-EM structure of human MICAL1.
a Schematic of the domain organization in human MICAL1, highlighting the monooxygenase (MO) domain, calponin homology (CH) domain, Lin-11, Isl-1, Mec-3 (LIM) domain, and coiled-coil (CC) domain, along with linker regions L1, L2, and L3. b Cryo-EM map of human MICAL1 with individual domains distinctly colored as shown in panel (a). c Ribbon representation of human MICAL1. d Detailed view of the region between MOβ17 and MOα15, showing key residues Trp400 and Phe399. Trp400 stabilizes the isoalloxazine ring of FAD via coaxial stacking, while Phe399 stabilizes the MO-CC interaction through a cation-π interaction with Arg933 from the CCα1 helix. e Hydrophobic contacts stabilizing the MO-CC interaction. Hydrophobic residues Val261 and Ile264, located between MOβ11 and MOα11, interact with a cluster of hydrophobic residues—Phe925, Val995, Leu998, and Ile931—from the CCα1 and CCα2 helices. f Polar contacts stabilizing the MO-CC interaction, primarily consisting of salt bridges (Arg233-Glu944, Glu257-Lys918) and hydrogen bonds (Gln267-Asn999, Gly150-Arg915).
Fig. 2
Fig. 2. Flexible linkers and their role in MICAL1.
a Molecular dynamics simulations of the cryo-EM structure of MICAL1, with flexible linkers modeled using AlphaFold. This representation illustrates the superposition of 21 backbone-traced conformers extracted at 5 ns intervals during molecular dynamics simulations, highlighting the dynamic nature of the linkers. b The amphipathic L2α1 helix, derived from the L2 linker region, is wedged between the CC, CH, and LIM domains. This helix is essential for the stability of the CH-LIM-CC assembly. c Molecular mass determination of MICAL1 in solution via size-exclusion chromatography combined with multi-angle light scattering (MALS), showing an experimental molar mass of 115.1 ± 3.6 kDa. This result corresponds with the theoretical molar mass for a monomer (124.8 kDa), with no peak shift towards higher molecular masses. The initial protein concentrations of 2.0 (blue), 1.0 (green), and 0.5 mg/ml (red) were used. d Sedimentation coefficient distribution of MICAL1 as determined by sedimentation velocity analytical ultracentrifugation at concentrations of 40 µM (red) and 8 µM (black). The calculated sedimentation coefficient (sw(20,w) = 5.5 S) is consistent with the expected value for a monomer.
Fig. 3
Fig. 3. MICAL1 autoinhibition relies on the binding of the CH-L2α1-LIM assembly to the CC domain.
a Single-actin filament TIRF microscopy data revealed that treatment of F-actin with purified full-length MICAL1 did not alter depolymerization rates (1.27 ± 0.61 units/s, N = 60) compared to the control (1.78 ± 0.9 units/s, N = 20). Conversely, the addition of the purified MO domain resulted in a significant increase in depolymerization rates (11.61 ± 4.91 units/s, N = 42). The addition of purified CC to the MO domain at molar ratios of MO to CC at 1:50 or 1:200 exhibited no measurable effect on the depolymerization rate (11.20 ± 4.12 units/s, N = 55 for the 1:50 ratio and 11.15 ± 4.16 units/s, N = 57 for the 1:200 ratio), suggesting that the CC domain alone does not inhibit the MO domain. MICAL1ΔCC exhibited a lower rate of depolymerization (5.51 ± 2.73 units/s, N = 42) compared to that of the MO domain. However, the addition of purified CC to MICAL1ΔCC significantly inhibited depolymerization rates (3.23 ± 1.71 units/s, N = 56 and 2.62 ± 1.23 units/s, N = 30 for molar ratios of 1:50 and 1:200, respectively). As a control, the addition of purified CC alone did not affect the depolymerization rate of F-actin (2.43 ± 1.55 units/s, N = 23) compared to untreated control filaments. In this experiment, the total concentrations were as follows: MICAL1, MO, and MICAL1ΔCC at 500 nM; NADPH at 200 µM; and CC at final concentrations of 25 µM (molar ratio 1:50) and 100 µM (molar ratio 1:200). The estimated surface concentration of actin was 50 molecules/µm². Data are presented as mean values ± standard deviation of depolymerization rates of individually measured actin filaments (N). P-values were calculated using a nonparametric unpaired two-tailed t-test with Welch’s correction: MO + CC (1:50), p = 0.6678 (ns); MO + CC (1:200), p = 0.6281 (ns); MICAL1ΔCC + CC (1:50), p < 0.0001 (****); MICAL1ΔCC + CC (1:200), p < 0.0001 (****); Representative micrographs are shown in Fig. S6. b, c, e Data from pyrene-labeled actin depolymerization assays demonstrate overall trends that are consistent with the findings from TIRF microscopy (a). In this experiment, the concentrations were as follows: MICAL1, MO, and MICAL1ΔCC at 200 nM; NADPH at 200 µM; CC at final concentrations of 2 µM (1:10 molar ratio), 5 µM (1:25 molar ratio), and 10 µM (1:50 molar ratio); and actin at a final concentration of 2 µM. Data are presented as mean values ± standard deviation of the three independent replicates (n = 3). d BLI binding experiments involved immobilization of biotinylated CC domain on sensor tips and analysis for binding with MO or MICAL1ΔCC. While no measurable binding was observed for MO up to a concentration of 27 µM, MICAL1ΔCC exhibited specific binding with a KD of 0.58 ± 0.17 µM. The data were measured in independent duplicates. f Pyrene-labeled actin depolymerization assays showed that MICAL1ΔMO significantly inhibited the depolymerization activity of the MO domain at all tested molar ratios, with inhibition levels similar to that observed with the full-length MICAL1. The concentrations used were as follows: MICAL1 and MO at 200 nM; NADPH at 200 µM; MICAL1ΔMO at 1 µM (1:5 molar ratio), 2 µM (1:10 molar ratio), and 4 µM (1:20 molar ratio); and actin at 2 µM. Data are presented as mean values ± standard deviation of the three independent replicates (n = 3). g Pyrene-labeled actin depolymerization assays demonstrated that disrupting the interaction between the MO domain and the CCα1 helix releases MICAL1 autoinhibition. Specifically, substituting Arg933 in CCα1, which forms a cation-π interaction with Phe399 in the MO domain in autoinhibited MICAL1, resulted in significant F-actin depolymerization. The concentrations used were as follows: MICAL1, MO, and MICAL1R933A at 200 nM; NADPH at 200 µM; and actin at 2 µM. Data are presented as mean values ± standard deviation of the three independent replicates (n = 3).
Fig. 4
Fig. 4. Rab10-induced conformational changes in the CC domain decrease the MO-CC stability.
a Overlay of the CC domain in its autoinhibited (orange) and Rab-activated (white) states. The overlay was generated by superimposing the CC domains from the previously reported crystal structure of the CC-Rab10 complex and the cryo-EM structure from the current study. In the activated state, the CC domain exhibits a more planar arrangement of individual helices, whereas in the autoinhibited state, the CCα3 helix displays an axial tilt, which disturbs the CC planar arrangement. b The same CC domains as shown in (a) overlaid with the CH-L2α1-LIM assembly from the cryo-EM structure. This overlay demonstrates that the L2α1 helix maintains the CCα3 helix in the axially tilted conformation. c Further overlay of the structures from (b) with two Rab10 molecules from the previously reported CC-Rab10 complex. The low-affinity binding site of Rab10 overlaps with the CH-L2α1-LIM assembly, whereas Rab10 bound to the high-affinity site clashes with the axially tilted CCα3 helix. d Close-up view illustrating the shift of the proximal region of the CCα1 helix between the Rab-activated and autoinhibited states. In the Rab-activated state, the helix shifts away from the MO domain, disrupting critical interactions that stabilize the CC binding to the MO domain. e Detailed view highlighting differences in residue Arg933 between the activated and autoinhibited states. In the autoinhibited state, Arg933 in CCα1 forms a cation-π interaction with Phe399 from the MO domain, which is adjacent to Trp400, stabilizing FAD via coaxial stacking. Conversely, in the Rab-activated state, this cation-π interaction between Arg933 and Phe399 is disrupted.
Fig. 5
Fig. 5. F-actin and the CCα1 helix compete for binding to the MO domain.
a Schematic representation of the HDX-MS experiment. The MO domain, both in the absence and presence of F-actin, was diluted into D2O buffer, allowing hydrogen-deuterium exchange over time. Exchange was quenched at various time points, after which the samples were digested, and the deuterium content was quantified using mass spectrometry. The following concentrations were used: 50 pmol of MO at 12.4 µM per reaction. The MO-F-actin complex was prepared by mixing MO and F-actin at a 1:2 molar ratio. b Local differences in amide hydrogen-deuterium exchange between the MO domain in the absence and presence of F-actin. These differences, measured after a 2-hour deuteration period, are mapped onto both the ribbon and surface representations of the MO structure. Regions with the highest exchange levels are shown in red, while those with the lowest exchange are in blue. The position of CCα1 is schematically indicated by a dashed cylinder. c Visualization of the MO domain with CCα1 helix. The MO domain is presented in a surface representation with the CCα1 helix in a ribbon representation. Color coding reflects residue conservation from sequence alignments shown in Fig. S2, highlighting the most conserved areas near the CCα1 binding site. In contrast, areas surrounding the FAD-binding cavity show varied conservation levels, with direct FAD-contacting residues exhibiting significant conservation. The analyzes were conducted using the Consurf server.
Fig. 6
Fig. 6. Proposed Molecular Mechanism of MICAL1 Autoinhibition and Activation.
Initially, MICAL1 activity is autoinhibited by an intramolecular interaction between the MO domain and the CCα1inh helix. This interaction sterically hinders F-actin from binding to the MO domain. A crucial component of this autoinhibitory mechanism is the tripartite CH-L2α1-LIM complex, which interacts with the CCinh domain to maintain a CC conformation that facilitates the CCα1 helix’s binding to the MO domain. The binding of Rab10 to MICAL1 initiates the dissociation of the CH-L2α1-LIM complex, leading to the straightening or axial adjustment of the CCα3 helix. This triggers an allosteric change in the CCα1inh helix, causing its proximal portion to shift away from the MO domain. While it remains uncertain whether this results in a complete or partial dissociation of the CC domain from the MO domain, this conformational shift likely exposes the F-actin binding site. Additionally, the conformation of the Rab-bound CCact domain may be further stabilized by a second Rab molecule, enhancing the activation process.

References

    1. Terman, J. R., Mao, T., Pasterkamp, R. J., Yu, H. H. & Kolodkin, A. L. MICALs, a family of conserved flavoprotein oxidoreductases, function in plexin-mediated axonal repulsion. Cell109, 887–900 (2002). - PubMed
    1. Hung, R. J. et al. Mical links semaphorins to F-actin disassembly. Nature463, 823–827 (2010). - PMC - PubMed
    1. Hung, R. J., Pak, C. W. & Terman, J. R. Direct redox regulation of F-actin assembly and disassembly by Mical. Science334, 1710–1713 (2011). - PMC - PubMed
    1. Hung, R. J., Spaeth, C. S., Yesilyurt, H. G. & Terman, J. R. SelR reverses Mical-mediated oxidation of actin to regulate F-actin dynamics. Nat. Cell Biol.15, 1445–1454 (2013). - PMC - PubMed
    1. Oztug Durer, Z. A., Diraviyam, K., Sept, D., Kudryashov, D. S. & Reisler, E. F-actin structure destabilization and DNase I binding loop: fluctuations mutational cross-linking and electron microscopy analysis of loop states and effects on F-actin. J. Mol. Biol.395, 544–557 (2010). - PMC - PubMed

Publication types

LinkOut - more resources