. 2024 Nov 12;15(1):9780.
doi: 10.1038/s41467-024-54052-0.

Genetic legacy of ancient hunter-gatherer Jomon in Japanese populations

Collaborators, Affiliations

Genetic legacy of ancient hunter-gatherer Jomon in Japanese populations

Kenichi Yamamoto et al. Nat Commun. .

Abstract

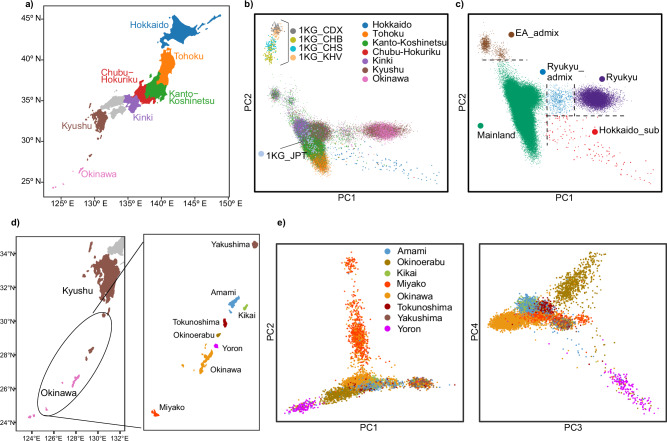
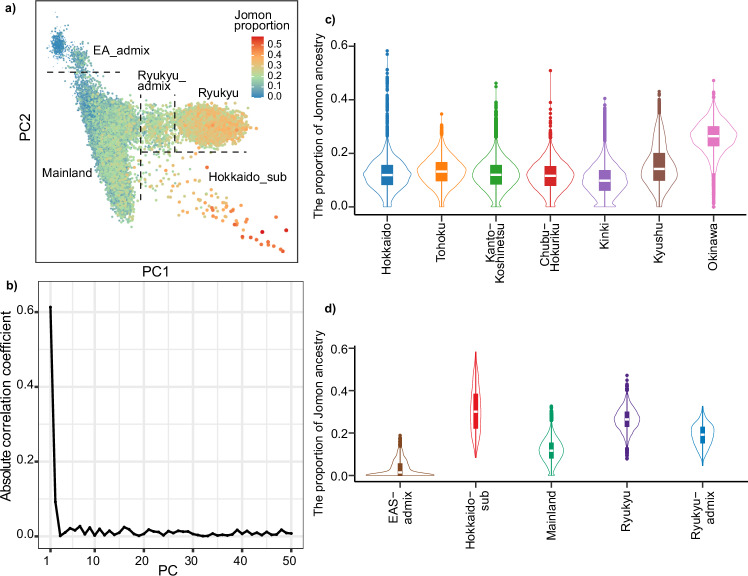
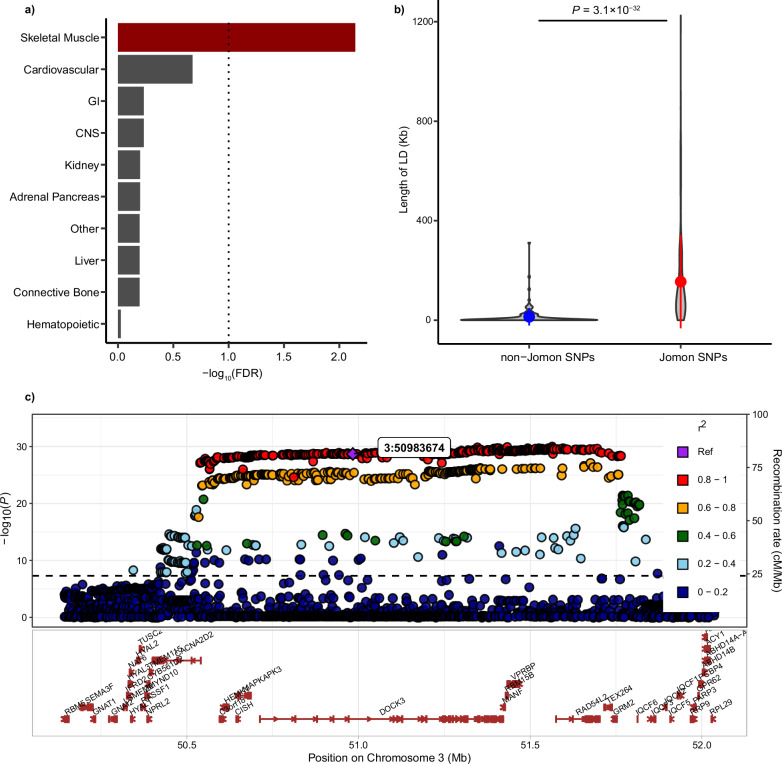
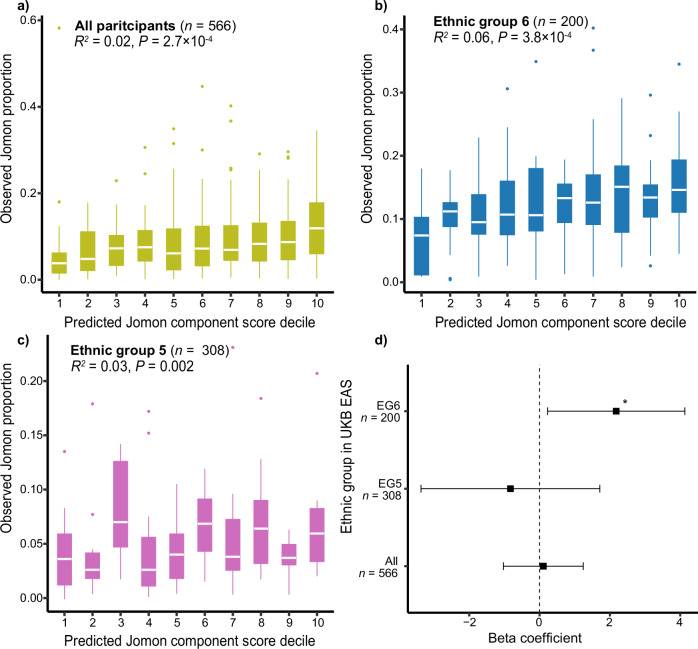
The tripartite ancestral structure is a recently proposed model for the genetic origin of modern Japanese, comprising indigenous Jomon hunter-gatherers and two additional continental ancestors from Northeast Asia and East Asia. To investigate the impact of the tripartite structure on genetic and phenotypic variation today, we conducted biobank-scale analyses by merging Biobank Japan (BBJ; n = 171,287) with ancient Japanese and Eurasian genomes (n = 22). We demonstrate the applicability of the tripartite model to Japanese populations throughout the archipelago, with an extremely strong correlation between Jomon ancestry and genomic variation among individuals. We also find that the genetic legacy of Jomon ancestry underlies an elevated body mass index (BMI). Genome-wide association analysis with rigorous adjustments for geographical and ancestral substructures identifies 132 variants that are informative for predicting individual Jomon ancestry. This prediction model is validated using independent Japanese cohorts (Nagahama cohort, n = 2993; the second cohort of BBJ, n = 72,695). We further confirm the phenotypic association between Jomon ancestry and BMI using East Asian individuals from UK Biobank (n = 2286). Our extensive analysis of ancient and modern genomes, involving over 250,000 participants, provides valuable insights into the genetic legacy of ancient hunter-gatherers in contemporary populations.


Conflict of interest statement

Competing interests The authors declare no competing interests.

Figures

Fig. 1
Fig. 1. Population structure of Biobank Japan.
a Seven geographic regions, each represented by a different color, indicate the locations where participants were registered at local hospitals. b A scatter plot of PCA for BBJ participants with 1KG EAS samples. The colors of the BBJ participants correspond to those used in (a). c Clustering results of BBJ participants based on PCA. d Geographic locations of the Ryukyu Islands. e Scatter plots of PCA for BBJ participants from the Ryukyu Islands. The individuals are colored differently according to the locations of their registered hospitals. In (a, d) the map of Japan is drawn using the R package “jpndistrict” (https://github.com/uribo/jpndistrict). PC Principal component, 1KG 1000 Genomes Project, JPT Japanese in Tokyo, CDX Chinese Dai in Xishuangbanna, CHB Han Chinese in Beijing, CHS Han Chinese South, KHV Kinh in Ho Chi Minh City, NEA Northeast Asian, EA East Asian.
Fig. 2
Fig. 2. Variation in tripartite ancestry structures across groups of Biobank Japan participants.
Bar plots show the proportions of three distinct ancestors. a Populations are defined either as a group of the entire BBJ samples or by the regions where participants were registered (Hokkaido = 7955, Tohoku = 11,013, Kanto-Koshinetsu = 94,981, Chubu-Hokuriku = 9489, Kinki = 25,200, Kyushu = 15,962, and Okinawa = 5804). b Individuals recruited from the Ryukyu Islands are grouped by their specific islands (Yakushima = 431, Amami = 1531, Kikai = 561, Okinoerabu = 845, Tokunoshima = 476, Yoron = 167, Okinawa = 4795, and Miyako = 827). c The BBJ samples are split into five different insular populations based on their PCA clusters shown in Fig. 1 (Mainland = 159,642, Hokkaido_sub = 139, Ryukyu = 9847, Ryukyu_admix = 640, and EA_admix = 1019). Proportions in the bar plots represent the mean values of three ancestral components estimated using qpAdm, with error bars indicating standard errors. Values at the top of each bar indicate the tail probabilities of the tripartite model for each group. NEA Northeast Asian, EA East Asian.
Fig. 3
Fig. 3. Genetic legacy of Jomon ancestry throughout Japanese populations.
Proportions of Jomon ancestry are estimated through admixture modeling under models optimal for each individual (n = 163,243). a Projection of the Jomon proportions onto the PCA plots. b Absolute values of the correlation coefficients between the Jomon proportions and PCs. The correlation coefficient is calculated using Pearson’s method. c Boxplots representing variation in the Jomon proportion across BBJ participants within each of their registered regions. d Boxplots representing variation in the Jomon proportion across the participants within each of different genetic clusters defined by PCA. In (c, d), boxes denote the interquartile range (IQR) and the median is shown as white horizontal bars; whiskers extend to 1.5 times the IQR; outliers are shown as individual points. PC Principal component, EA East Asian.
Fig. 4
Fig. 4. Associations of Jomon ancestry with 80 complex traits.
Associations are tested using a generalized linear model in (a) the entire BBJ participants (n = 163,243) and (b) the participants only in the Mainland cluster (n = 152,148). The quantitative traits are modeled by linear regression, while the binary traits are analyzed with logistic regression. The direction of the triangle corresponds to the sign of the beta coefficient for each trait. The gray dashed line represents the statistical significance based on the Bonferroni correction (P < 0.05/80 = 6.3 × 10−4). Control indicates 10 dummy phenotypes. All traits labeled on the plots have nominal significance with P < 0.05. Details of statistical test results are presented in Supplementary Data 6 and 7. P-values are computed by linear regression or logistic regression. All statistical tests are two-sided and unadjusted for multiple comparisons. BMI Body mass index, BW Body weight, LVM Left ventricular mass, E/A E/A ratio, RBC Red blood cell count, MCH Mean corpuscular volume, LDLC low-density lipoprotein cholesterol.
Fig. 5
Fig. 5. Functional and genomic characterization of Jomon-related marker SNPs.
a Stratified LD score regression analysis is conducted with major 10 cell type groups. False discovery rate (FDR) is calculated using the Benjamini-Hochberg method. A dotted vertical line represents the FDR of 0.1. b Violin plots compare the lengths of regions in strong LD with each of 132 Jomon-related SNPs (r2 > 0.8) to those of 132 frequency-matched non-Jomon-related SNPs. Dots represent the mean lengths, with bars showing the standard deviations. A p-value (3.1 × 10−32) is calculated by the Wilcoxon rank sum test, reflecting a two-sided test. c A locus plot highlights a Jomon-related SNP, which is shown as a purple diamond in the upper plot, that is linked with the longest haplotype among all 132 variants. A dashed line defines a statistical significance as a p-value of 5.0 × 10−8. Lower plots represent the protein-coding genes, based on GENCODE, that are present in the highlighted region. The P-value is computed by inverse variance weighted meta-analysis using METAL. All statistical tests are two-sided and unadjusted for multiple comparisons. GI Gastrointestinal, CNS Central nerve system, LD Linkage disequilibrium, SNP Single nucleotide polymorphism.
Fig. 6
Fig. 6. Validation of the genetic legacy of Jomon ancestry and the predictive power of 132 Jomon-related variants using an independent cohort of BBJ-2nd.
a The PCA plots include all individuals from BBJ-2nd (n = 68,632), with their respective Jomon proportions overlaid. b The Jomon component prediction scores measured from all individuals within the cohort (n = 72,695) are split into the deciles. The boxplot shows the distribution of observed Jomon proportions in each decile of the predicted scores. R2 indicates the squared value of the Pearson’s correlation coefficient between the prediction score and the residuals of the Jomon proportion regressed out with 10 PCs. P-value reflects a two-sided test. In (b), boxes denote the interquartile range (IQR) and the median is shown as white horizontal bars; whiskers extend to 1.5 times the IQR; outliers are shown as individual points. PC Principal component.
Fig. 7
Fig. 7. Prediction of Jomon ancestry and replication of phenotypic association using UKB EAS.
Jomon component prediction scores are split into deciles. The boxplot shows the distribution of observed Jomon proportions in a given decile of the predicted scores based on (a) all UKB EAS participants (n = 566), (b) EG6 (self-reported Other ethnic population; n = 200), and (c) EG5 (self-reported Chinese population; n = 308). The EG number is referred from Data-coding of UKB. d The forest plots represent the effect size of Jomon ancestry on BMI in UKB EAS, EG5, and EG6. Squares indicate the point estimates, while error bars indicate 95% confidence intervals. Asterisks represent P < 0.05 (P = 0.03 in EG6). In (a, b, c), boxes denote the interquartile range (IQR) and the median is shown as white horizontal bars; whiskers extend to 1.5 times the IQR; outliers are shown as individual points. R2 indicates the squared value of the Pearson’s correlation coefficient between the prediction score and the residuals of the Jomon proportion regressed out with 10 PCs. P-values reflect two-sided tests. In (d), P-values are computed by linear regression. All statistical tests are two-sided and unadjusted for multiple comparisons.

References

    1. Bergström, A., Stringer, C., Hajdinjak, M., Scerri, E. M. L. & Skoglund, P. Origins of modern human ancestry. Nature590, 229–237 (2021). - PubMed
    1. Lazaridis, I. et al. Ancient human genomes suggest three ancestral populations for present-day Europeans. Nature513, 409–413 (2014). - PMC - PubMed
    1. Yang, M. A. et al. 40,000-year-old individual from Asia provides insight into early population structure in Eurasia. Curr. Biol.27, 3202–3208.e9 (2017). - PMC - PubMed
    1. Lazaridis, I. et al. Genomic insights into the origin of farming in the ancient Near East. Nature536, 419–424 (2016). - PMC - PubMed
    1. Wang, C.-C. et al. Genomic insights into the formation of human populations in East Asia. Nature591, 413–419 (2021). - PMC - PubMed

Publication types

LinkOut - more resources