. 2024 Nov 12;15(1):9797.
doi: 10.1038/s41467-024-54136-x.

HSF-1 promotes longevity through ubiquilin-1-dependent mitochondrial network remodelling

Affiliations

HSF-1 promotes longevity through ubiquilin-1-dependent mitochondrial network remodelling

Annmary Paul Erinjeri et al. Nat Commun. .

Abstract

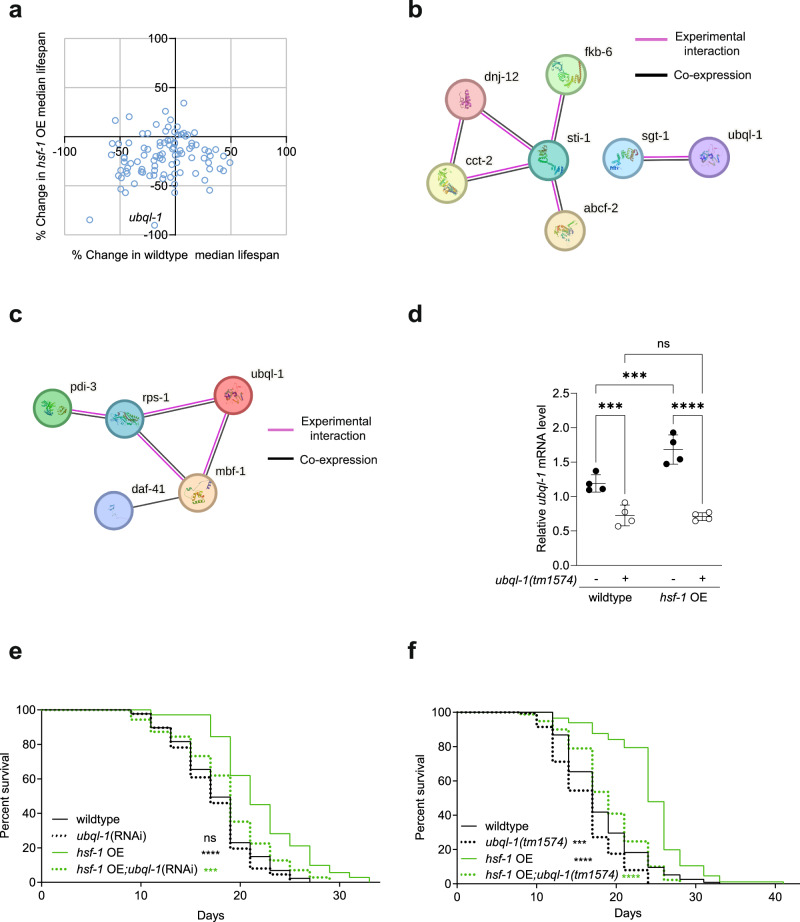
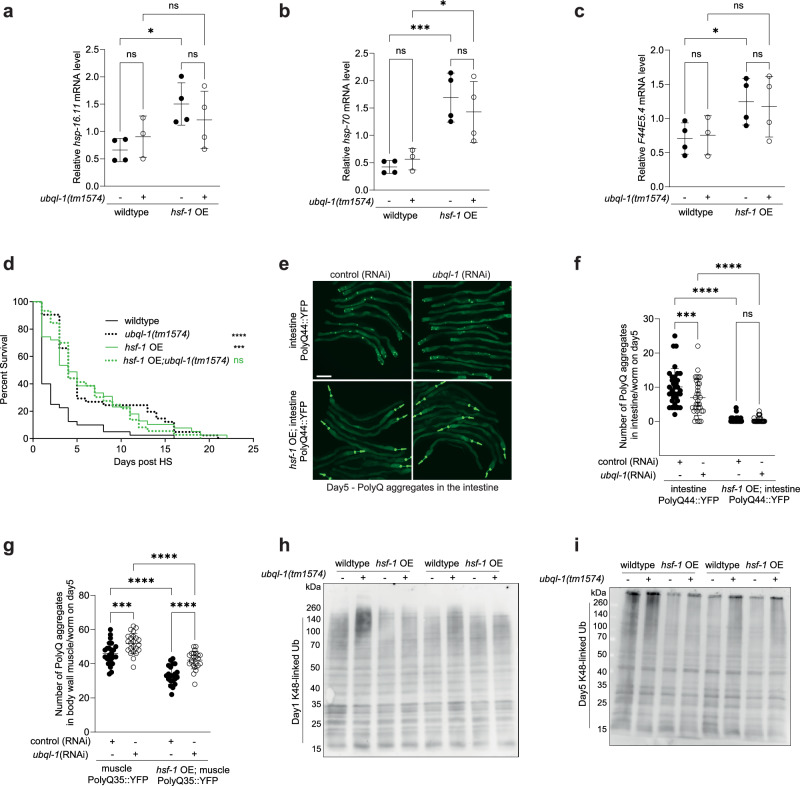
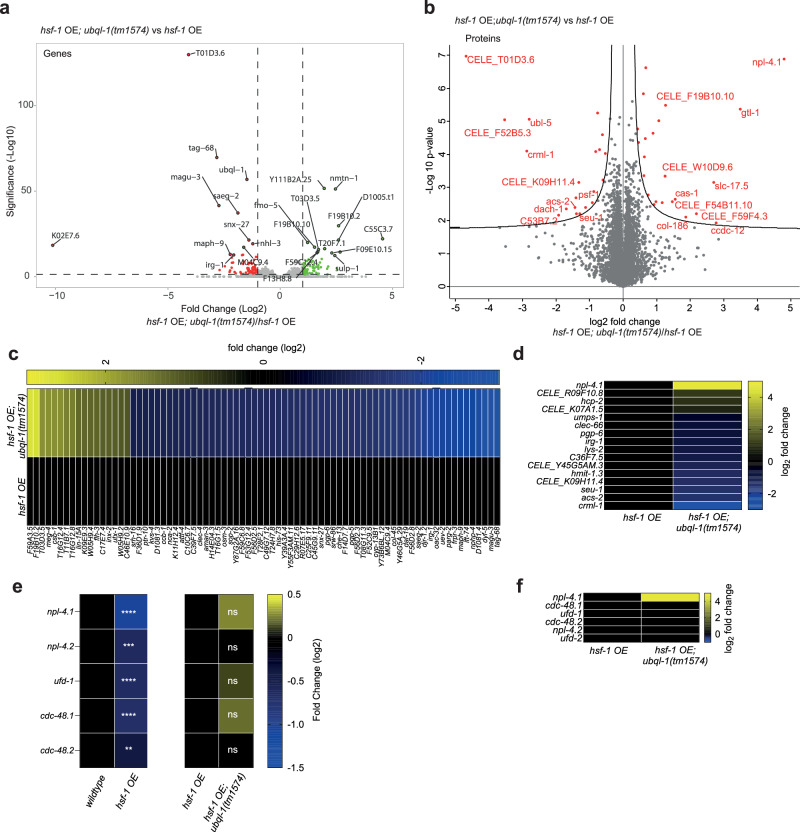
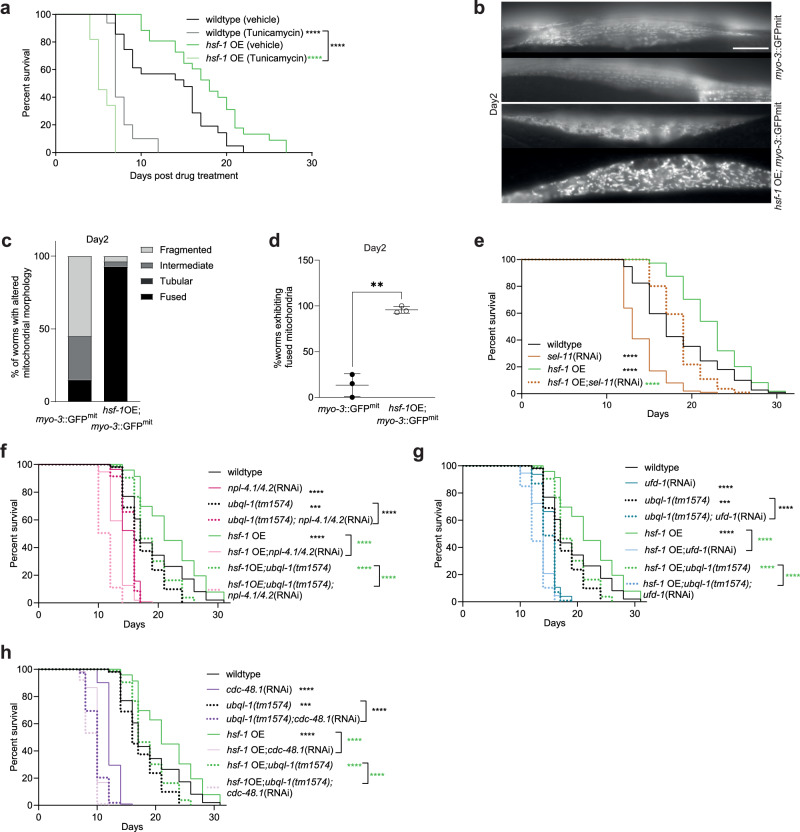
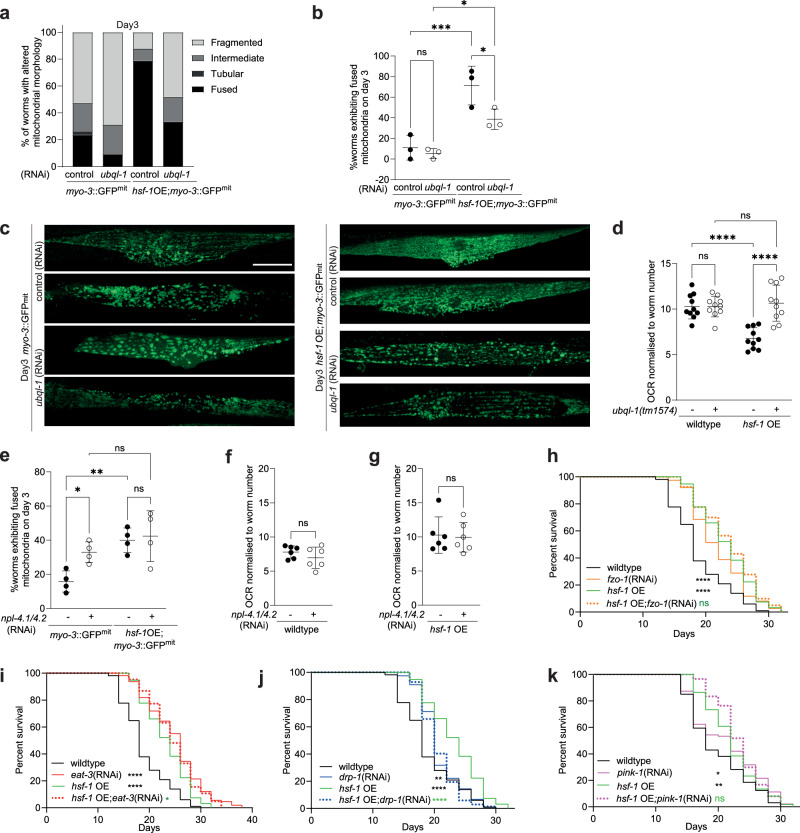
Increased activity of the heat shock factor, HSF-1, suppresses proteotoxicity and enhances longevity. However, the precise mechanisms by which HSF-1 promotes lifespan are unclear. Using an RNAi screen, we identify ubiquilin-1 (ubql-1) as an essential mediator of lifespan extension in worms overexpressing hsf-1. We find that hsf-1 overexpression leads to transcriptional downregulation of all components of the CDC-48-UFD-1-NPL-4 complex, which is central to both endoplasmic reticulum and mitochondria associated protein degradation, and that this is complemented by UBQL-1-dependent turnover of NPL-4.1. As a consequence, mitochondrial network dynamics are altered, leading to increased lifespan. Together, our data establish that HSF-1 mediates lifespan extension through mitochondrial network adaptations that occur in response to down-tuning of components associated with organellar protein degradation pathways.


Conflict of interest statement

Competing interests The authors declare no competing interests.

Figures

Fig. 1
Fig. 1. Ubql-1 is necessary for hsf-1 OE to extend lifespan.
a Changes in median lifespan in wildtype and hsf-1 overexpressing (hsf-1 OE) worms after RNAi against HSF-1 target genes (sample numbers for all groups can be found within Supplementary Data 1). b, c STRING networks of screened genes that, when knocked down, were found to (b) decrease hsf-1 OE lifespan by > 20% with no effect on wild-type lifespan, or (c) increase hsf-1 OE lifespan by > 20% but decrease wildtype lifespan by the same degree. Black lines represent interaction by co-expression, and purple lines represent evidence of experimental interaction. ubql-1 was included in (c) for reference, and genes without any connections were removed. d Relative expression of ubql-1 mRNA on day 1 of adulthood in wildtype, ubql-1(tm1574), hsf-1 OE, and hsf-1 OE; ubql-1(tm1574) animals grown on OP50. Values were normalised to the geometric mean of the housekeeping genes rpb-2, pmp-3, and cdc-42. Data plotted are the mean of 4 biological replicates +/− SD (wildtype vs ubql-1(tm1574), p = 0.0008; hsf-1OE vs hsf-1OE;ubql-1(tm1574), p < 0.0001; wildtype vs hsf-1OE, p = 0.0005; ubql-1(tm1574) vs hsf-1OE;ubql-1(tm1574), p = 0.8662). e, f Lifespan of (e) wildtype and hsf-1 OE animals on empty vector and ubql-1(RNAi) (wildtype vs ubql-1(RNAi), p = 0.2886; wildtype vs hsf-1OE, p < 0.0001; hsf-1OE vs hsf-1OE;ubql-1(RNAi), p = 0.0002) and (f) wildtype, ubql-1(tm1574), hsf-1 OE, hsf-1 OE;ubql-1(tm1574) animals grown on OP50 (wildtype vs ubql-1(tm1574), p = 0.0002; wildtype vs hsf-1OE, p < 0.0001; hsf-1OE vs hsf-1OE;ubql-1(tm1574), p < 0.0001). Statistical significance was calculated using (d) two-way ANOVA with Fishers LSD and (e, f) Mantel-Cox log-rank test. ns, not significant (p > 0.05), **p < 0.01, ***p < 0.001, ****p < 0.0001. Full statistics for lifespan trials (including n values) can be found in Supplementary Data 2. Source data are provided as a Source Data file.
Fig. 2
Fig. 2. Ubql-1 is not required for hsf-1 OE to suppress age-related protein aggregation.
ac Relative expression of hsp-16.11, hsp-70 and F44E5.4 mRNA on day 1 of adulthood in wildtype, ubql-1(tm1574), hsf-1 OE, and hsf-1 OE;ubql-1(tm1574) animals grown on OP50 and subjected to heat shock (33 °C, 30 mins). Values were normalised to the geometric mean of the housekeeping genes rpb-2, pmp-3 and cdc-42, and data are the mean of 4 biological replicates. Statistical comparisons are: (a) hsp-16.11 (wildtype vs ubql-1(tm1574), p = 0.4326; hsf-1OE vs hsf-1OE;ubql-1(tm1574), p = 0.3181; wildtype vs hsf-1OE, p = 0.0115; ubql-1(tm1574) vs hsf-1OE;ubql-1(tm1574), p = 0.3286), (b) hsp-70 (wildtype vs ubql-1(tm1574), p = 0.6431, hsf-1OE vs hsf-1OE;ubql-1(tm1574), p = 0.3581, wildtype vs hsf-1OE, p = 0.0007; ubql-1(tm1574) vs hsf-1OE;ubql-1(tm1574), p = 0.0138), (c) F44E5.4 (wildtype vs ubql-1(tm1574), p = 0.8607; hsf-1OE vs hsf-1OE;ubql-1(tm1574), p = 0.7737; wildtype vs hsf-1OE, p = 0.0463; ubql-1(tm1574) vs hsf-1OE;ubql-1(tm1574), p = 0.1324). d Survival of wildtype, ubql-1(tm1574), hsf-1 OE, hsf-1 OE;ubql-1(tm1574) animals on D1 of adulthood following exposure to heat shock (35˚C for 4 h) (wildtype vs ubql-1(tm1574), p < 0.0001; wildtype vs hsf-1OE, p = 0.0001; hsf-1OE vs hsf-1OE;ubql-1(tm1574), p = 0.9380). e Representative images of wildtype and hsf-1 OE worms expressing intestinal polyQ44::YFP grown on the empty vector (EV) or ubql-1(RNAi) at day 5 of adulthood. Scale bar, 200 µm. f, g Number of polyglutamine::YFP aggregates present in the (f) intestine (Q44::YFP) and (g) body wall muscle (Q35::YFP) on D5 of adulthood in wildtype and hsf-1 OE animals grown on empty vector and ubql-1(RNAi). One of three independent experiments has been represented for intestinal and muscle PolyQ sensors. Intestinal and muscle data are presented as the mean values +/− SD. Statistical comparisons are (f) iPolyQ EV (n = 35) vs iPolyQ;ubql-1(RNAi) (n = 32), p = 0.0009; hsf-1OE;iPolyQ EV (n = 33) vs hsf-1OE;iPolyQ;ubql-1(RNAi) (n = 36), p = 0.9424; iPolyQ EV vs hsf-1OE;iPolyQ EV, p < 0.0001; iPolyQ; ubql-1(RNAi) vs hsf-1OE; iPolyQ;ubql-1(RNAi), p < 0.0001, and (g) mPolyQ EV (n = 25) vs mPolyQ;ubql-1(RNAi) (n = 23), p = 0.0008; hsf-1OE;mPolyQ EV (n = 21) vs hsf-1OE;mPolyQ;ubql-1(RNAi) (n = 23), p < 0.0001; mPolyQ EV vs hsf-1OE;mPolyQ EV, p < 0.0001; mPolyQ;ubql-1(RNAi) vs hsf-1OE;mPolyQ;ubql-1(RNAi), p < 0.0001. h, i western blotting for K48-linked ubiquitylated proteins on (h) day 1 or (i) day 5 of adulthood in wildtype, ubql-1(tm1574), hsf-1 OE, and hsf-1 OE;ubql-1(tm1574) animals. Blots are representative of 4 independent experiments. All error bars denote SD. Statistical significance was calculated using (ac, f and g) two-way ANOVA with Fishers LSD and (d) Mantel-Cox log-rank test. ns, not significant (p > 0.05), *p < 0.05, **p < 0.01, ***p < 0.001, ****p < 0.0001. Full statistics for lifespan trials (including n values) can be found in Supplementary Data 2. Source data are provided as a Source Data file.
Fig. 3
Fig. 3. Ubql-1 is necessary for elevated NPL-4.1 levels in hsf-1 OE animals.
a, b Volcano plots representing differentially regulated (a) genes (green dots = up-regulated, red dots = down-regulated, FDR p < 0.05) and (b) proteins (red dots in the right and left region of the volcano plot represent proteins significantly up-or down-regulated, respectively (two-tailed student’s t test, FDR < 0.05) in hsf-1 OE vs hsf-1 OE; ubql-1(tm1574) worms on day 1 of adulthood. Values are the mean of 4 biological replicates. c, d Heatmaps of ubql-1 dependent changes in (c) gene expression and (d) protein abundance in hsf-1 OE worms. e Heatmap showing the relative expression of CDC-48-NPL-4-UFD-1 complex associated genes within RNA-seq datasets from wildtype vs hsf-1 OE worms, and hsf-1 OE vs hsf-1 OE; ubql-1(tm1574) worms. f Heatmap showing the relative abundance of CDC-48-NPL-4-UFD-1 complex associated proteins within proteomics datasets from hsf-1 OE vs hsf-1 OE; ubql-1(tm1574) worms. Source data are provided as a Source Data file.
Fig. 4
Fig. 4. Animals overexpressing HSF-1 exhibit altered mitochondrial morphology and are sensitive to knockdown of the CDC-48-UFD-1-NPL-4 complex.
a Survival of wildtype and hsf-1 OE worms exposed to Tunicamycin (50 µg/ml) or DMSO (0.2%) on NGM plates from day 1 of adulthood onwards (wildtype DMSO vs wildtype tunicamycin, p < 0.0001; hsf-1 OE DMSO vs hsf-1OE tunicamycin, p < 0.0001; wildtype tunicamycin vs hsf-1OE tunicamycin, p < 0.0001). b Representative fluorescence images of myo-3p::GFPmit in wildtype or hsf-1 OE muscle tissues on day 2 of adulthood. Scale bar, 20 µm. c Proportion of mitochondria exhibiting specific morphologies in wildtype or hsf-1 OE muscle tissues on day 2 of adulthood (myo-3::GFP(mit), n = 20; hsf-1OE; myo-3::GFP(mit), n = 28). d Relative prevalence of fused mitochondria in wildtype or hsf-1 OE muscle tissues on day 2 of adulthood. Data are presented as the mean values +/− SD of 3 independent experiments (p = 0.0046). This experiment was also run +/− ubql-1 RNAi, which is plotted in Fig. S5b. e Lifespan analysis of wildtype and hsf-1 OE animals subjected to sel-11 RNAi (wildtype vs sel-11(RNAi), p < 0.0001; wildtype vs hsf-1OE, p < 0.0001; hsf-1OE vs hsf-1OE;sel-11(RNAi), p < 0.0001). fh Lifespan analyses of wildtype, ubql-1 (tm1574) mutants, hsf-1 OE and hsf-1 OE;ubql-1(tm1574) animals subjected to empty vector pL4440 and RNAi-mediated (f) npl-4.1/4.2, (g) ufd-1 and (h) cdc-48.1 knockdown (wildtype vs npl-4.1/4.2(RNAi), p < 0.0001; wildtype vs ubql-1(tm1574), p = 0.0008; ubql-1(tm1574) vs ubql-1(tm1574);npl-4.1/4.2(RNAi), p < 0.0001; wildtype vs hsf-1OE, p < 0.0001; hsf-1OE vs hsf-1OE;npl-4.1/4.2(RNAi), p < 0.0001; hsf-1OE vs hsf-1OE;ubql-1(tm1574), p < 0.0001; hsf-1OE;ubql-1(tm1574) vs hsf-1OE; ubql-1(tm1574); npl-4.1/4.2(RNAi), p < 0.0001; wildtype vs ufd-1(RNAi), p < 0.0001; wildtype vs ubql-1(tm1574), p = 0.0008; ubql-1(tm1574) vs ubql-1(tm1574); ufd-1(RNAi), p < 0.0001, wildtype vs hsf-1OE, p < 0.0001; hsf-1OE vs hsf-1OE; ufd-1(RNAi), p < 0.0001; hsf-1OE vs hsf-1OE;ubql-1(tm1574), p < 0.0001; hsf-1OE;ubql-1 (tm1574) vs hsf-1OE;ubql-1(tm1574);ufd-1(RNAi), p < 0.0001; wildtype vs cdc-48.1(RNAi), p < 0.0001; wildtype vs ubql-1(tm1574), p = 0.0008; ubql-1(tm1574) vs ubql-1(tm1574);cdc-48.1 (RNAi), p < 0.0001; wildtype vs hsf-1OE, p < 0.0001; hsf-1OE vs hsf-1OE;cdc-48.1 (RNAi), p < 0.0001; hsf-1OE vs hsf-1OE;ubql-1(tm1574), p < 0.0001; hsf-1OE;ubql-1(tm1574) vs hsf-1OE;ubql-1(tm1574); cdc-48.1 (RNAi), p < 0.0001). Statistical significance was calculated using (d) two-way ANOVA with Fishers LSD or (a, and eh) Mantel-Cox log-rank test. **p < 0.01, ***p < 0.001, ****p < 0.0001. Full statistics for lifespan trials (including n values) can be found in Supplementary Data 2. Source data are provided as a Source Data file.
Fig. 5
Fig. 5. hsf-1 overexpression reduces respiration and promotes mitochondrial fusion in a ubql-1 dependent manner.
a Proportion of mitochondrial morphologies observed in pmyo-3::GFP(mit) worms and hsf-1 OE; pmyo-3::GFP(mit) worms grown on empty vector control or ubql-1(RNAi) on day 3 of adulthood (myo-3::GFP(mit), n = 38; myo-3::GFP(mit);ubql-1(RNAi), n = 32; hsf-1OE; myo-3::GFP(mit), n = 33; hsf-1OE; myo-3::GFP(mit); ubql-1(RNAi), n = 27. b Prevalence of fused mitochondria in muscle tissues of wildtype and hsf-1 OE worms, +/− ubql-1 (RNAi), on day 3 of adulthood. Values are the mean +/- SD of three independent experiments (myo-3::GFP(mit) vs myo-3::GFP(mit);ubql-1(RNAi), p = 0.6018; hsf-1OE; myo-3::GFP(mit) vs hsf-1OE; myo-3::GFP(mit);ubql-1(RNAi), p = 0.0120; myo-3::GFP(mit) vs hsf-1OE;myo-3::GFP(mit), p = 0.0003; myo-3::GFP(mit);ubql-1(RNAi) vs hsf-1OE; myo-3::GFP(mit);ubql-1(RNAi), p = 0.0113). c Representative confocal microscope images of myo-3p::GFPmit within muscle tissues of wildtype or hsf-1 OE worms +/− ubql-1(RNAi) on day 3 of adulthood. Scale bar, 20 µm. d Basal Oxygen consumption rates (OCR) in wildtype, ubql-1(tm1574), hsf-1 OE and hsf-1 OE; ubql-1(tm1574) animals at day 1 of adulthood. Mean values +/− SD (n = 10 replicates per group where each replicate has 10 worms) are plotted. One of three independent experiments has been represented for OCR (wildtype vs ubql-1(tm1574), p = 0.9947; hsf-1OE vs hsf-1OE;ubql-1(tm1574), p < 0.0001; wildtype vs hsf-1OE, p < 0.0001; ubql-1 (tm1574) vs hsf-1OE;ubql-1(tm1574), p = 0.5736). e Prevalence of fused mitochondria in muscle tissues of wildtype and hsf-1 OE worms, +/− npl-4.1 (RNAi), on day 3 of adulthood. The plotted values are from four independent experiments. The number of worms imaged per experiment was: Experiment 1, n = 10 for all groups; Experiment 2, n = 10 for all groups except wildtype npl-4.1(RNAi) (n = 5); Experiment 3 and 4, n = 15 for all groups. Statistical comparisons are: myo-3::GFP(mit) vs myo-3::GFP(mit);npl-4.1/4.2(RNAi), p = 0.0230; hsf-1OE; myo-3::GFP(mit) vs hsf-1OE; myo-3::GFP(mit); npl-4.1/4.2(RNAi), p = 0.7201; myo-3::GFP(mit) vs hsf-1OE;myo-3::GFP(mit), p = 0.0032; myo-3::GFP(mit);npl-4.1/4.2(RNAi) vs hsf-1OE; myo-3::GFP(mit); npl-4.1/4.2(RNAi), p = 0.1766. (f and g) Basal OCR in (f) wildtype or (g) hsf-1 OE animals, +/− npl-4.1/4.2 (RNAi), at day 1 of adulthood. Mean values are plotted +/− SD (n = 6 replicates per group where each replicate has 10 worms (wildtype vs wildtype;npl-4.1/4.2(RNAi), p = 0.2869; hsf-1OE vs hsf-1OE;npl-4.1/4.2(RNAi), p = 0.8256. One of two independent experiments has been shown. hk Lifespan of wildtype and hsf-1 OE animals on empty vector and (h) fzo-1(RNAi) (fusion) (wildtype vs wildtype;fzo-1(RNAi), p < 0.0001; wildtype vs hsf-1OE, p < 0.0001; hsf-1OE vs hsf-1OE;fzo-1(RNAi), p = 0.3953), (i) eat-3 (RNAi) (fusion) (wildtype vs wildtype;eat-3(RNAi), p < 0.0001; wildtype vs hsf-1OE, p < 0.0001; hsf-1OE vs hsf-1OE;eat-3(RNAi), p = 0.0134) (j) drp-1(RNAi) (fission) (wildtype vs wildtype;drp-1(RNAi), p = 0.0086; wildtype vs hsf-1OE, p < 0.0001; hsf-1OE vs hsf-1OE;drp-1(RNAi), p < 0.0001) and (k) pink-1 (RNAi) (mitophagy) (wildtype vs wildtype;pink-1(RNAi), p = 0.0166; wildtype vs hsf-1OE, p = 0.0020; hsf-1OE vs hsf-1OE;pink-1(RNAi), p = 0.1268). All error bars denote SD. Statistical significance was calculated by (b, d, and e) two-way ANOVA with Fishers LSD test, (f, g) two-tailed, unpaired Students t test, or (hk) Mantel-Cox Log-rank test. ns, not significant (p > 0.05), *p < 0.05, **p < 0.01, ***p < 0.001 ****p < 0.0001. Full statistics for lifespan trials (including n values) can be found in Supplementary Data 2. Source data are provided as a Source Data file.

References

    1. Lopez-Otin, C., Blasco, M. A., Partridge, L., Serrano, M. & Kroemer, G. Hallmarks of aging: An expanding universe. Cell186, 243–278 (2023). - PubMed
    1. Douglas, P. M. & Dillin, A. Protein homeostasis and aging in neurodegeneration. J. Cell Biol.190, 719–729 (2010). - PMC - PubMed
    1. Labbadia, J. & Morimoto, R. I. The biology of proteostasis in aging and disease. Annu. Rev. Biochem.84, 435–464 (2015). - PMC - PubMed
    1. Akerfelt, M., Morimoto, R. I. & Sistonen, L. Heat shock factors: integrators of cell stress, development and lifespan. Nat. Rev. Mol. Cell Biol.11, 545–555 (2010). - PMC - PubMed
    1. Gomez-Pastor, R., Burchfiel, E. T. & Thiele, D. J. Regulation of heat shock transcription factors and their roles in physiology and disease. Nat. Rev. Mol. Cell Biol.19, 4–19 (2018). - PMC - PubMed

Publication types

MeSH terms

Substances

Associated data