. 2024 Nov 12;15(1):9770.
doi: 10.1038/s41467-024-54174-5.

Mechanics-activated fibroblasts promote pulmonary group 2 innate lymphoid cell plasticity propelling silicosis progression

Affiliations

Mechanics-activated fibroblasts promote pulmonary group 2 innate lymphoid cell plasticity propelling silicosis progression

Yangyang He et al. Nat Commun. .

Abstract

Crystalline silica (CS) particle exposure leads to silicosis which is characterized as progressive fibrosis. Fibroblasts are vital effector cells in fibrogenesis. Emerging studies have identified immune sentinel roles for fibroblasts in chronic disease, while their immune-modulatory roles in silicosis remain unclear. Herein, we show that group 2 innate lymphoid cell (ILC2) conversion to ILC1s is closely involved in silicosis progression, which is mediated by activated fibroblasts via interleukin (IL)-18. Mechanistically, Notch3 signaling in mechanics-activated fibroblasts modulates IL-18 production via caspase 1 activity. The mouse-specific Notch3 knockout in fibroblasts retards pulmonary fibrosis progression that is linked to attenuated ILC conversion. Our results indicate that activated fibroblasts in silicotic lungs are regulators of ILC2-ILC1 conversion, associated with silicosis progression via the Notch3-IL-18 signaling axis. This finding broadens our understanding of immune-modulatory mechanisms in silicosis, and indicates potential therapeutic targets for lung fibrotic diseases.


Conflict of interest statement

Competing interests The authors declare no competing interests.

Figures

Fig. 1
Fig. 1. CS particles in lungs alter ILC phenotypes.
a Experimental schematic showing mouse treatments and sacrifice time points. Week 8 post-CS treatment was regarded as the fibrogenesis stage. b The lung ILC gating strategy. Lineage (Lin) is an antibody cocktail containing CD5, CD45R (B220), CD11b, Ly-6B.2, Gr-1, and Ter-119. Bar graphs comparing ILC percentages (c) and cell numbers (d) in CS or saline-treated counterparts (n = 16 biological replicates). Flow histogram comparing ILCs expressing cytokine receptors, including CD127 (IL-7R), CD25 (IL-2Rα), ST-2 (IL-33R) (e), and IL-18Rα (f) in silicotic or saline-treated lungs. The bar graph compares the MFI of indicated cytokine receptors on ILCs (n = 8 biological replicates). g Flow plot showing the percentage of ILCs expressing the cell retention-related markers CD69, CD103, and CXCR6. Bar graphs compare indicated cell retention marker percentages on ILCs (n = 8 biological replicates). Flow plot showing ILCs expressing MHC-II (h) and ICOS (i) in fibrotic or saline-treated lungs. Bar graphs compare the percentage of ILCs expressing MHC- II (h) and ICOS (i) in silicotic or saline-treated lungs (n = 8 biological replicates). Flow histograms comparing ILCs expressing NRP-1 (j), KLRG1 (k), and PD-1, PD-L1, CD73 (l) in saline or CS-treated lungs. The bar graph compares the MFI of molecules on ILCs in lungs (n = 8 biological replicates). m Flow cytometric analysis of IFN-γ and IL-13 expression in ILCs from saline or CS-treated lung. Bar graphs compare IFN-γ and IL-13 percentages in ILCs (n = 8 biological replicates). FMO control, fluorescence minus one control. Bar graphs represent the combined results of four biologically independent experiments with similar results. Individual mice are plotted on graphs. Data are shown as the mean ± SEM. P values were calculated using two-tailed unpaired Student’s t-tests and indicated in graphs. Source data are provided in a source data file.
Fig. 2
Fig. 2. Pulmonary ILCs shift from ILC2 to ILC1s as silicosis progresses.
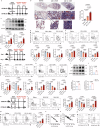
a Experimental schematic. Saline or CS was administered to C57BL6J mice that were sacrificed at time 1: 8–10 weeks or time 2: 12–14 weeks post treatments. b Representative Masson’s trichrome staining in lung section images showing whole lung lobes and zoomed in areas. Scale bar = 600 μm (upper panel), 200 μm (middle panels), and 50 μm (lower panels). The bar graph compares fibrotic area percentages in lung sections (n = 5 biological replicates). c Western blot showing fibronectin (FN) and collagen I (Col1) expression in CS-treated mouse lung groups. β-Actin was used as a loading control. Uncropped blots are in source data. The bar graph compares relative protein expression in lungs from different group (n = 4 biological replicates). d Flow plots showing NKp46+ (ILC1) and ST-2+ (ILC2) percentages in ILCs at indicated times. Bar graphs compare NKp46+ and ST-2+ percentages in ILCs and NKp46+/ST-2+ ILC ratios in lungs (n = 8 biological replicates). e Flow plots showing T-bet+ and Gata-3+ percentages in ILCs at indicated times. Bar graphs compare T-bet+ and Gata-3+ percentages in ILCs and T-bet+/Gata-3+ ILC ratios in lungs (n = 8 biological replicates). f Experimental schematic design: Saline or CS was administered to Rag1–/– mice that were sacrificed at indicated time points. g Flow plots showing NKp46+ (ILC1) and ST-2+ (ILC2) percentages in ILCs at indicated times. Bar graphs compare NKp46+ and ST-2+ percentages in ILCs and NKp46+/ST-2+ ILC ratios in lungs (n = 5 biological replicates in the saline group, n = 7 biological replicates CS 8-10 week, n = 8 biological replicates CS 12–14 weeks). h Flow plots showing T-bet+ and Gata-3+ percentages in ILCs at indicated time. Bar graphs compare T-bet+ and Gata-3+ percentages in ILCs and the T-bet+/Gata-3+ ratio in lungs (n = 6 biological replicates). i Western blot comparing fibronectin (FN) and collagen I (Col1) expressions in CS-treated C57BL/6 J and Rag1–/– mice lungs 12–14 weeks after CS treatment. β-Actin was used as a loading control. Uncropped blots are in source data. The bar graph compares relative protein expressions from different group (n = 4 biological replicates). j Bar graphs compare ratios of T-bet+/Gata3+ ILC in C57BL/6J and Rag1–/– mice lungs 12–14 weeks after CS treatment (n = 8 biological replicates in C57BL/6 group, n = 6 biological replicates in Rag1–/– group). k Schematic depicting bleomycin (BLM)-induced pulmonary fibrosis: BLM was administered to C57BL6J mice twice, at weeks 0 and 1. Mice were sacrificed at time 1: week 3 or time 2: week 5 post the last BLM treatment. l Flow plots showing NKp46+ (ILC1) and ST-2+ (ILC2) percentages in ILCs at indicated time points. Bar graphs compare NKp46+ and ST-2+ percentages in total ILCs and the NKp46+/ST-2+ ILC ratio in lungs (n = 8 biological replicates). m Flow plot showing ST-2 and IL-18Rα expression levels in ILCs from B6 mouse silicotic lungs. Bar graphs compare IL-18Rα+ST-2+ ILC percentages with silicosis progression (n = 8 biological replicates). Correlated ST2 and IL-18Rα expression (n) and correlated NKp46 and ST-2 expression levels (o) on ILCs from CS-treated B6 mice (n = 12 biological replicates). p Flow plots showing cell retention marker expression on IL-18Rα+ST-2+ ILCs in silicotic lungs at 12–14 weeks after CS treatment. Flow plots and bar graphs were representative of four biologically independent experiments with similar results. Individual mice are plotted on graphs. Data are shown as the mean ± SEM. P values were calculated using two-tailed unpaired Student’s t-tests (two groups) or one-way ANOVA followed by Tukey’s tests (three groups) and indicated on graphs. Source data are provided in a source data file.
Fig. 3
Fig. 3. IL-18 mediates ILC2 conversion to ILC1s in silicotic lungs.
a Experimental schematic showing the ILC2 transfer experimental design. Details are described in methods. b Flow plot analyzing ST-2 and NKp46 expression on donor ILC2s before and after transfer. IL-18Rα levels were then analyzed on ST-2NKp46+ ILCs (n = 6 biological replicates). c Flow plot showing transcription factor T-bet and Gata3 expression on donor ILC2s before and after transfer. The flow histogram compares IL-18Rα on ST-2+T-bet (blue) and ST-2T-bet+ ILCs (red). NK-1.1 and Gata-3 expression was analyzed on ST-2T-bet+ transferred ILCs (n = 4 biological replicates). d Schematic showing ST2-eGFP reporter construction. Details are provided in methods. e Flow plots showing ILC2 (eGFP+) and non-ILC2 (eGFP) percentages expressing IL-18Rα concomitant with silicosis progression (n = 8 biological replicates). f Bar graph compares MFI values for IL-18Rα in (eGFP+)IL-18Rα+ ILC2s and (eGFP)IL-18Rα+ non-ILC2s (n = 8 biological replicates). g Schematic showing the IL-18Rα blocking experiment: silicotic B6 mice were blocked with IL-18Rα or treated with isotype-matched antibodies. Details are described in methods. h Flow plots showing NKp46+ (ILC1) and ST-2+ (ILC2) percentages in pulmonary ILCs. Bar graphs compare NKp46+ and ST-2+ percentages in ILCs and the NKp46+/ST-2+ ILC ratio in lungs (n = 5 biological replicates). i Western blot shows FN and Col1 levels in lungs. Uncropped blots are in source data. Bar graph compares relative protein levels across different lung treatments (n = 4 biological replicates). j Flow plots showing NKp46+ (ILC1) and ST-2+ (ILC2) percentages in pulmonary wild-type and Il18–/– littermate silicotic ILCs at different times. Bar graphs compare NKp46+ (ILC1) and ST-2+ (ILC2) ILC percentages and ILC1/ILC2 ratios in silicotic lungs (n = 8 biological replicates). k Western blot shows FN and Col1 levels in wild-type and Il18–/– mouse lungs. Uncropped blots are in source data. The bar graph compares relative protein levels in lungs (n = 4 biological replicates). Littermate mice were used in (j), (k). l Schematic showing the ILC2 transfer experimental design; recipients were Rag1–/–Il18–/– dKO mice. m Flow plot showing ST-2, NKp46, T-bet, and Gata-3 expression on donor ILC2s before and after transfer. n Bar graph comparing T-bet percentages in transferred ILCs in different recipients (n = 4 biological replicates). Bar graphs represent the combined results of four biologically independent experiments with similar results. Individual mice are plotted on graphs. Data are shown as the mean ± SEM. P values were calculated using two-tailed unpaired Student’s t-tests (f, h, n) or one-way ANOVA followed by Tukey’s tests (e, i, j, k). P values are indicated on graphs. Source data are provided in a source data file. Mouse figures in panel (a) and (l) were created in BioRender. Fan, Y. (2024) BioRender.com/u22s346.
Fig. 4
Fig. 4. Mechanics-activated fibroblasts secrete IL-18 which modulates ILC2 conversion to ILC1s.
a Schematic showing the macrophage deletion experiment: Clodronate liposomes (CL) were intraperitoneally (i.p) injected into mice to delete IMs or, i.t. instilled to delete AMs. Treatment details are in methods. b Flow plots showing NKp46+ (ILC1) and ST-2+ (ILC2) percentages in pulmonary ILCs. Bar graphs compare NKp46+ and ST-2+ percentages in ILCs and the NKp46+/ST-2+ ILC ratio in lungs of mice in different treatment groups (n = 6 biological replicates). c Schematic showing the construction of bone-marrow chimeric mice. Treatment details are in methods. d Flow plots showing NKp46+ (ILC1) and ST-2+ (ILC2) percentages in pulmonary ILCs. Bar graphs compare NKp46+ and ST-2+ percentages in ILCs and the NKp46+/ST-2+ ratio in lungs (n = 3 biological replicates wild-type→wild-type, n = 4 biological replicates Il18–/–→wild-type). e Confocal immunofluorescence images showing lungs in silicosis mice. DAPI (blue), Lineage (green), Gata-3 (purple), and α-SMA (red) labeling. Solid arrows indicate fibroblasts and hollow arrows indicate ILC2s. Scale bar = 5 μm (left panel), 20 μm (right panel). (Representative image from 4 biological independent replicates with similar results). f Immunofluorescence images showing pro-IL-18 staining in primary lung fibroblasts cultured on soft (~1 kPa) or stiff (~25 kPa) matrix gels, Scale bar = 20 μm (Representative image from 6 independent cultures with similar results). g Flow histogram showing caspase 1 activity (FLICA) of primary lung fibroblasts cultured on soft (~1 kPa) and stiff (~25 kPa) matrix gels. The bar graph compares fibroblast FLICA MFI values in different groups (n = 5 biological replicates). h IL-18 levels in primary lung fibroblast culture medium (CM) on soft (~1 kPa) or stiff (~25 kPa) matrix gels were detected by ELISA (n = 5 biological replicates). i Schematics showing sorted ILC2s cultured in fibroblast CM. See methods for details. j Flow plots showing NK1.1 and ST-2+ expression in ILC2s cultured on soft (~1 kPa) or stiff (~25 kPa) matrix gels. Bar graphs compare NK1.1+ST-2+ and NK1.1ST-2+ ILC percentages and the number of NK1.1+ST-2+ cells (n = 5 biological replicates). k Schematic showing the primary lung fibroblast and sorted lung ILC2 co-culturing system used in (l). See methods for details. l Flow cytometry data showing NKp46 and ST-2 expression of upper-chamber ILC2s which were co-cultured with lower-chamber primary lung fibroblast on soft (~1 kPa) or stiff (~25 kPa) matrix gels for 60 h (n = 3 biological replicates). m Schematic showing the primary lung fibroblast and sorted lung ILC2 co-culturing system used in (n). n Flow cytometry data showing NKp46 and ST-2 expression of upper-chamber ILC2s which were co-cultured with lower-chamber wildtype or Il18–/– primary lung fibroblast on stiff (~25 kPa) matrix gels for 60 h (n = 4 biological replicates). o qPCR analysis of Mmp9 and Tgfb1 transcripts in upper-chamber ILC2s which were co-cultured with lower-chamber primary lung fibroblast on soft (~1 kPa) or stiff (~25 kPa) matrix gels for 60 h (n = 4 biological replicates). Bar graphs represent the combined results from three biologically independent experiments with similar results. Individual values are plotted in graphs. Data are shown as the mean ± SEM. P values were calculated using two-tailed unpaired Student’s t-tests (d, g, h, j, l, n) or one-way ANOVA followed by Tukey’s tests (b) and are indicated in graphs. Source data are provided in a source data file.
Fig. 5
Fig. 5. Notch3 signaling is essential for IL-18 expression in mechanics-activated fibroblasts.
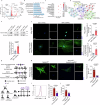
a Volcano plot of differentially expressed genes in bulk RNA-Sequencing dataset of soft (~1 kPa) or stiff (~25 kPa) gel cultured fibroblasts. Upregulated genes and downregulated genes are highlighted in red and blue (n = 3 biological replicates). b GO analysis of upregulated genes in stiff gel cultured fibroblasts predicts the involved biological processes. c KEGG enrichment analysis of upregulated genes. d Bioinformatics analysis of the protein–protein interaction network using STRING. e Western blot showing Notch3 intracellular domain (ICD) expression in primary lung fibroblasts cultured on different stiffness matrix gels. Uncropped blots are in source data. The bar graph compares Notch3 intracellular domain (ICD) expression in soft (~1 kPa) or stiff (~25 kPa) gel cultured fibroblasts (n = 3 biological replicates). f Immunofluorescence images showing Notch3 ICD staining in MLg2908 and primary lung fibroblasts cultured on soft (~1 kPa) or stiff (~25 kPa) matrix gels. DAPI was used to label nuclei. Scale bar = 20 μm. Bar graphs compare Notch3 ICD fluorescence intensities (n = 7 biological replicates, MLg2908; n = 4 biological replicates, primary fibroblasts). g Schematic showing Notch3 flox mouse construction, and the breeding strategy for fibroblast-specific Notch3 depletion mice. Lung primary fibroblasts were then isolated for in vitro experiments. h Immunofluorescence images showing pro-IL-18 staining in primary lung fibroblasts isolated from Notch3fl/fl and Notch3fl/fl Col1a2-creERT littermates cultured on stiff (~25 kPa) matrix gel. Scale bar = 20 μm. The bar graph compares pro-IL-18 fluorescence intensity of Notch3fl/fl and Notch3fl/fl Col1a2-creERT primary lung fibroblasts cultured on stiff (~25 kPa) matrix gel (n = 7 biological replicates). i Flow histogram showing primary lung fibroblast caspase 1 activity (FLICA). The bar graph compares FLICA MFI values in Notch3fl/fl and Notch3fl/fl Col1a2-creERT primary lung fibroblasts cultured on stiff (~25 kPa) matrix gel. (n = 5 biological replicates). j Bar graph comparing IL-18 levels in culture medium from stiff (~25 kPa) matrix gel stimulated primary lung fibroblasts isolated from Notch3fl/fl and Notch3fl/fl Col1a2-creERT littermates as detected by ELISA (n = 5 biological replicates). Bar graphs represent the combined results of three biologically independent experiments with similar results. Individual values are plotted in graphs. Data are shown as the mean ± SEM. P values were calculated using two-tailed unpaired Student’s t-tests and are indicated in graphs. Source data are provided in a source data file.
Fig. 6
Fig. 6. Notch3 signaling in fibroblasts mediates ILC2 conversion to ILC1s, and is associated with an attenuated fibrotic phenotype.
a Flow plot showing fibroblasts (CD45CD140a+CD90.2+) in CS-treated lungs. Flow histogram and bar graph compare Notch3 MFI values in fibroblasts from saline or CS-treated lungs (saline, n = 4 biological replicates; CS 8–10 weeks, n = 8 biological replicates). b Schematic showing tamoxifen (TAM)-induced fibroblast-specific Notch3 depletion. TAM was applied at early fibrogenesis stages (week 3–4 after CS treatment). c Flow plots showing NKp46+(ILC1) and ST-2+(ILC2) percentages in lungs (n = 5 biological replicates). Bar graphs compare ILC2 and ILC1 percentages in ILCs and ILC1/ILC2 ratios in lungs. d Masson’s staining showing lung section images of whole lung lobes and zoomed in areas evaluating the degree of pulmonary fibrosis at weeks 8–10 and 12–14 or saline-treated counterparts. Scale bar = 600 μm (upper panel), 200 μm (middle panels), and 50 μm (lower panels). Bar graph compares fibrotic area percentages in sections (n = 5 biological replicates). e Western blot showing FN and Col1 levels in lungs. Uncropped blots are in source data. The bar graph compares relative protein levels in mouse lungs (n = 4 biological replicates). f Hydroxyproline (HYP) content in mouse lungs. The bar graph compares HYP content in lungs (n = 4 biological replicates). g Schematic showing TAM-induced fibroblast-specific Notch3 depletion. TAM was applied at fibrosis progression stage (week 8–9 after CS treatment). h Flow plots showing NK1.1+(ILC1) and ST-2+(ILC2) percentages in CS-treated mouse lungs (n = 5 biological replicates). Bar graphs compare ILC2 and ILC1 percentages in ILCs and ILC1/ILC2 ratios in lungs. i Schematic showing BLM-induced pulmonary fibrosis and TAM-induced fibroblast-specific Notch3 depletion. TAM was applied at the inflammatory stage (week 1–2 after BLM treatment). j Flow plots showing NKp46+ (ILC1) and ST-2+ (ILC2) percentages in BLM-treated mouse lungs (n = 5 biological replicates). Bar graphs compare ILC2 and ILC1 percentages in pulmonary ILCs and ILC1/ILC2 ratios in lungs. Bar graphs represent the combined results of four biologically independent experiments with similar results. Individual values are plotted in graphs. Littermate mice were used in experiments. Data are shown as the mean ± SEM. P values were calculated using one-way ANOVA followed by Tukey’s tests (c, d, e, f) or two-tailed unpaired Student’s t-tests (a, h, j). P values are indicated in graphs. Source data are provided in a source data file.
Fig. 7
Fig. 7. Schematic illustration that activated fibroblasts modulate ILCs plasticity in silicosis progression.
Mechanics-activated fibroblasts secreting IL-18through Notch3 signaling promoted ILC2 conversion to ILC1 related to silicosis progression. Figure was partially created in BioRender. Fan, Y. (2023) BioRender.com/h98u449.

Similar articles

Cited by

References

    1. Cavalin, C. et al. Beyond silicosis, is the world failing on silica hazards? Lancet Respir. Med.7, 649–650 (2019). - PubMed
    1. Hoy, R. F. & Chambers, D. C. Silica-related diseases in the modern world. Allergy75, 2805–2817 (2020). - PubMed
    1. Si, S. et al. The Australian work exposures study: prevalence of occupational exposure to respirable crystalline silica. Ann. Occup. Hyg.60, 631–637 (2016). - PubMed
    1. Sharma, N., Kundu, D., Dhaked, S. & Das, A. Silicosis and silicotuberculosis in India. Bull. World Health Organ94, 777–778 (2016). - PMC - PubMed
    1. Davidson, S. et al. Fibroblasts as immune regulators in infection, inflammation and cancer. Nat. Rev. Immunol.21, 704–717 (2021). - PubMed

Publication types

MeSH terms

LinkOut - more resources