. 2024 Nov 12;14(1):27012.
doi: 10.1038/s41598-024-73776-z.

Sea-level rise and extreme Indian Ocean Dipole explain mangrove dieback in the Maldives

Affiliations

Sea-level rise and extreme Indian Ocean Dipole explain mangrove dieback in the Maldives

Lucy Carruthers et al. Sci Rep. .

Abstract

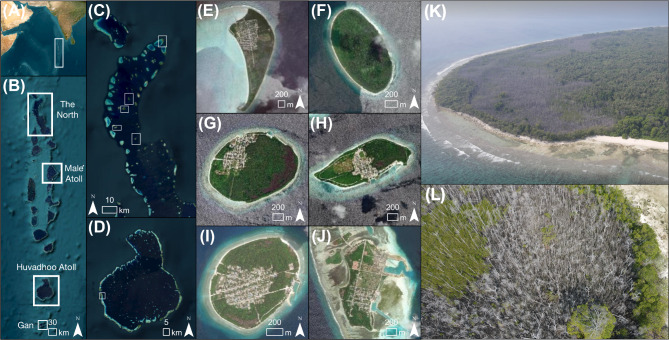
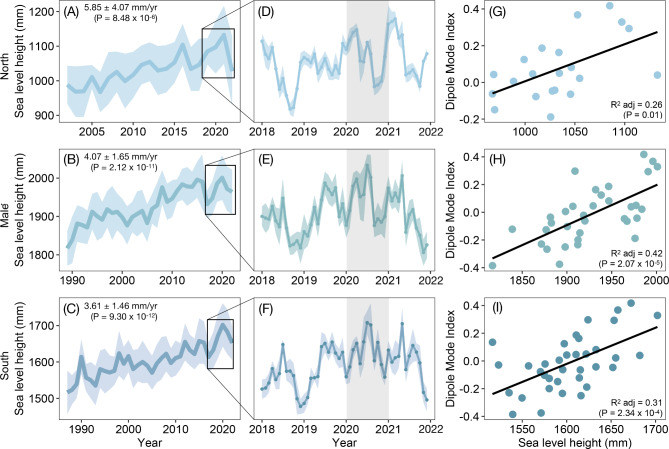
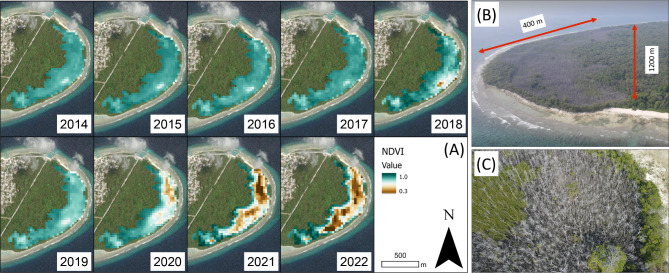
Mangrove forests enhance Small Island Developing States' resilience to climate change, yet in 2020, a mangrove dieback impacted ~ 25% of mangrove-containing islands in the Maldives. Using remote sensing, dendrology and sediment geochemistry, we document a significant decrease in mangrove health post-2020 (NDVI: 0.75 ± 0.09) compared to pre-2020 (0.85 ± 0.04; P < 0.0001). Dead trees showed reduced stomatal conductance (δ13C: - 26.21 ± 0.11 ‰) relative to living ones (- 27.66 ± 0.14 ‰), indicating salinity stress. Critically, sea-level rise (30.50 ± 23.30 mm/year) outpaced mangrove sediment accretion (6.40 ± 0.69 mm/year) five-fold between 2017 and 2020. We attribute this dieback to salinity stress driven by record-high sea levels in 2020, linked to an extreme positive Indian Ocean Dipole event. These findings reveal the vulnerability of mangrove ecosystems to rapid sea-level rise and highlights the urgent need for adaptive conservation strategies in Small Island Developing States.


Conflict of interest statement

Declarations Competing interests The authors declare no competing interests.

Figures

Fig. 1
Fig. 1
The Maldives. (A) The location of the Maldives within the Indian Ocean, (B) The Maldives Archipelago, (C) The five study islands in the North, (D) Location of the study island in Huvadhoo Atoll, in the southern region of the Maldives, (E) Remote sensing sites (HA. Kelaa, HDh. Keylakunu, HDh. Neykurendhoo, Sh. Goidhoo, Sh. Feydhoo, GDh. Hoandedhdhoo); and (F) GDh. Hoandedhdhoo Island as the field site for dendrology and sediment geochemistry. (Imagery source: ESRI, 2023 and Lucy Carruthers. Software used to generate maps; ArcGIS Pro version 2.9.0, https://www.esri.com/en-us/arcgis/products/arcgis-pro).
Fig. 2
Fig. 2
Sea level trends in the Maldives. Tide gauge records showing annual average sea level height (mm) (above datum) and rates for (A) HDh. Hanimaadhoo (2002 to 2022, UHSLC ID:117), (B) K. Malé (1989 to 2022, UHSLC ID: 108), (C) S. Gan (1987 to 2022, UHSLC: 109). Panels D to F show monthly averages from 2018 to 2022. Shaded areas denote standard deviation and grey vertical bars indicate the year of the dieback. Panels G to I illustrate the relationship between sea level height and the Western Indian Ocean Dipole Mode Index (DMI).
Fig. 3
Fig. 3
Mangrove health through time. (A) Temporal trends in annual NDVI for all study islands from 2014 to 2022; and (B) The difference in annual NDVI for all study islands between 2014 to 2018 and 2019 to 2022.
Fig. 4
Fig. 4
Mangrove health through time. (A) Temporal trends in NDVI on Neykurendhoo (Imagery source: ESRI, 2023) Software used to generate maps; ArcGIS Pro version 2.9.0, https://www.esri.com/en-us/arcgis/products/arcgis-pro); and (B-C) Oblique aerial drone image of mangrove dieback extent on Neykurendhoo in 2023 (Imagery source: Maldives Resilient Reefs).
Fig. 5
Fig. 5
Differences in mangrove wood. The difference in (A) δ13C (‰) (P < 0.05); and (B) Intrinsic water use-efficiency (iWUE) between dead and living zones (P < 0.05).
Fig. 6
Fig. 6
Modelling mangrove dieback on Hoadehdhoo Island. The press-pulse framework adapted from Harris et al. showing changes in mangrove health (A) due to climate change (B) and extreme events (C). Dashed red lines indicate the 1997 and 2019 extreme positive Indian Ocean Dipole events. Mangrove threshold reached in 2020 when sea level reached its highest point on tide gauge records (indicated by dashed brown line). (D) Basin forest vulnerability due to extreme shifts in sea level rise. Satellite imagery (Google Earth Pro version 7.3.6 https://www.google.com/earth) for visualization of before (E) and after (F) the dieback.

References

    1. Ball, M. C. Ecophysiology of mangroves. Trees2, 129–142 (1988).
    1. Ruslan, N. F. N., Goh, H. C., Hattam, C., Edwards-Jones, A. & Moh, H. H. Mangrove ecosystem services: Contribution to the well-being of the coastal communities in Klang Islands. Mar. Policy144, 105222 (2022).
    1. Veitayaki, J., Waqalevu, V., Varea, R. & Rollings, N. Mangroves in Small Island Development States in the Pacific: An Overview of a Highly Important and Seriously Threatened Resource. (2017). 10.1007/978-4-431-56481-2_11
    1. Menéndez, P., Losada, I. J., Torres-Ortega, S., Narayan, S. & Beck, M. W. The global flood protection benefits of mangroves. Sci. Rep.10, 1–11 (2020). - PMC - PubMed
    1. IPCC. The Ocean and Cryosphere in a Changing Climate. (2019).

LinkOut - more resources