. 2024 Nov 12;11(1):1214.
doi: 10.1038/s41597-024-04060-y.

Spatially integrated cortico-subcortical tracing data for analyses of rodent brain topographical organization

Affiliations

Spatially integrated cortico-subcortical tracing data for analyses of rodent brain topographical organization

Martin Øvsthus et al. Sci Data. .

Abstract

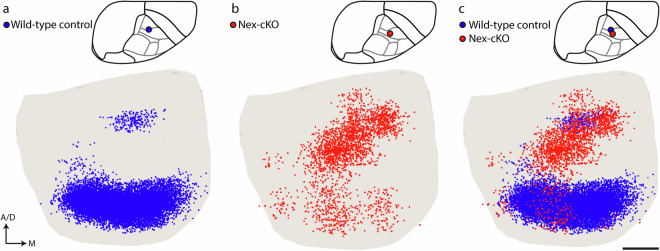
The cerebral cortex extends axonal projections to several subcortical brain regions, including the striatum, thalamus, superior colliculus, and pontine nuclei. Experimental tract-tracing studies have shown that these subcortical projections are topographically organized, reflecting the spatial organization of sensory surfaces and body parts. Several public collections of mouse- and rat- brain tract-tracing data are available, with the Allen mouse brain connectivity atlas being most prominent. There, a large body of image data can be inspected, but it is difficult to combine data from different experiments and compare spatial distribution patterns. To enable co-visualization and comparison of topographical organization in mouse brain cortico-subcortical projections across experiments, we represent axonal labelling data as point data in a common 3D brain atlas space. We here present a collection of point-cloud data representing spatial distribution of corticostriatal, corticothalamic, corticotectal, and corticopontine projections in mice and exemplify how these spatially integrated point data can be used as references for experimental investigations of topographic organization in transgenic mice, and for cross-species comparison with corticopontine projections in rats.


Conflict of interest statement

Competing interests The authors declare that the research was conducted in the absence of any commercial or financial relationships that could be construed as a potential conflict of interest. Author TBL is an Editorial Board Member for Scientific Data.

Figures

Fig. 1
Fig. 1
Workflow for deriving atlas-integrated data points. Methodological steps used to extract point coordinate data representing axonal labelling from image data and co-visualizing them in reference atlas space. Inputs to the workflow are either images of serial histological sections generated using tract tracing (top row) or public collections of image data, in our case images downloaded from the Allen mouse brain connectivity atlas. Following image pre-processing steps images are in parallel run through an atlas registration procedure and image extraction procedure. For the images from the Allen Institute, these steps involved validation and adjustment of pre-existing atlas registrations and binarization of pre-existing segmentation images. For automatic extraction of point coordinate data in atlas-defined regions of interest, binary images and corresponding atlas images are processed using the Nutil tool. As an alternative to feature extraction using automated methods, the location of labelling can be recorded by manual annotation using the LocaliZoom tool. The quantification steps produce lists of point coordinates, either as.csv or.json files, representing the extracted feature. The outputs of the workflow are point coordinate data that can be visualized together with atlas structures, e.g. using the MeshView tool, or used for other analytic purposes.
Fig. 2
Fig. 2
Examples showing reproducibility and variability in the data sets. (ac,fh,km) show 3D visualizations of rat brain data points in the right pontine nuclei, originating from nine tracer experiments in which injections were placed in different S1 body representations, either the S1 upper lip representation (ac, black dots), the S1 whisker E4/E5 representation (fh, red dots) or the S1 whisker E2 representation (k–m, blue dots). Injection site locations in the rat cerebral cortex are illustrated in the left column. (d,i,n) show data points combined from three similar experiments (organized in rows), revealing that the cases together occupy a slightly more expansive space in the pontine nuclei. This reflects biological and methodological variability in the data, and the degree with which findings can be replicated. Compared across columns, the data show that moderate displacement of cortical injection sites, from S1 upper lip to the S1 whisker E4/5 (~2,5 mm distance) or S1 whisker E2 (~3,5 mm distance) representation, result in consistent shifts in the distribution of the point clouds. This reflects the granularity of the data, and the degree with which the data allow discrimination of topographical patterns. This is visible in panel s, showing the colour coded data from all nine cases, concentrically distributed in an inside-out fashion. Graph plots in the right column (f,j,o) and bottom row (pr) show measurements of the minimum Euclidean distance between a point in one cloud and the nearest point in another cloud. Distance units are Waxholm Space voxel coordinates, 1 voxel = 39 µm isotropic. Plots in the right column shows measurements from cases in the left column (a,f,k) to the other two data sets in the same row, and plots in the bottom row showing measurements from cases in the top row (a,b,c) to the other two data sets in the same column. The plot in panel t shows the measurements from the accumulated data points in d to the accumulated data shown in i and n. The nearest neighbour measurements show that the average Euclidean distance is low when comparing cases with similar injection sites, and slightly higher when comparing cases with dissimilar injection sites. Abbreviations: BDA, biotinylated dextran amine; FR, FluoroRuby; Pha-L, Phaseolus vulgaris leucoagglutinin; UL, upper lip. Scale bars, 1 mm.
Fig. 3
Fig. 3
Comparison of manual and automated feature extraction methods. 3D visualization of data points representing corticopontine projections in an experiment downloaded from the Allen Mouse Brain Connectivity Atlas, in which a tracer injection was placed in the primary somatosensory cortex (case #112229814). (a) shows a dorsal view diagram of the right mouse brain hemisphere, with the injection site location indicated by a blue/red circle. (b) and (c) show the pontine nuclei from the Allen mouse brain atlas (CCFv3) rendered as a transparent surface in view from anteroventral, with manually (b, blue points) and automatically (c, red points) extracted point representing corticopontine projections observed in this experiment. The visualized point clouds feature an overall comparable topographic distribution pattern, with a dense, horizontally oriented cluster caudally in the pontine nuclei, and a smaller, rostrally located cluster, but the comparison shows that automatic feature extraction method yields more abundant and widely distributed data points in some regions, including more labelled axons and thus emphasizing regions with relatively low labelling densities. Abbreviations: A, anterior; D, dorsal; M, medial. Scale bars: (A) 1 mm, (B) and (C): 200 µm.
Fig. 4
Fig. 4
Colour coded visualization of injection sites and data point populations in mouse and rat brains reveals graded topographic distribution patterns. Visualizations of colour coded 3D point data representing corticopontine projections from 24 cortical injection sites in the rat brain (b), and corticopontine, corticostriatal, corticothalamic, and corticotectal projections from 35 cortical injection sites in the mouse brain (d–g). Diagrams show the right hemispheres of the rat (a) and mouse (c) brain in dorsal view, indicating the location of injection sites (coloured circles) in relation to different brain regions. Regions in the Waxholm Space rat brain atlas v.4 are colour coded as following: blue (primary and secondary motor cortex with frontal association area 3); pink (primary somatosensory cortex); green (posterior parietal cortex); yellow (visual/occipital cortex); purple (auditory cortex). The regions in the Allen mouse brain atlas (CCFv3_2017) are colour coded as following: blue (somatomotor areas); turquoise (retrosplenial area); red (somatosensory areas); green (posterior parietal association areas); purple (auditory areas and temporal association areas), yellow (visual areas). (b) shows the cortical projections to the pontine nuclei in the Waxholm Space rat brain atlas v.4, while (d–g) show cortical projections to different subcortical regions in Allen mouse brain atlas CCFv3 (including the pontine nuclei, caudoputamen, thalamus and superior colliculus) rendered as transparent surfaces. The inset transparent surface models of the atlases indicate the orientations in which data points are displayed. The data are colour coded according to the cortical location of injection sites, following a gradient from anterolateral (yellow) to progressively more frontal, medial, and occipital locations (increasingly darker shades of green). The visualized point clouds show that the subcortical projections are topographically organized, with concentric patterns in the pontine nuclei and thalamus, and more linear, fan-like distributions in the caudoputamen and superior colliculus. Abbreviations: M, medial; A, anterior; D, dorsal. Scale bars: A and C, 1 mm; B and D-G, 500 µm.
Fig. 5
Fig. 5
Comparison of topograpical organization in corticopontine, corticostriatal, corticothalamic, and corticotectal projections in the mouse brain. Visualizations of colour coded 3D point data representing subcortical projections from 3 selected tract-tracing experiments in the mouse somatosensory cortex. The diagram in (a) shows the right mouse brain hemisphere in dorsal view, with coloured circles indicating the location of tracer injections in the mouth (red, case #114290938), upper limb (yellow, case #112229814), and lower limb (blue, case #114292355) representations in the primary somatosensory cortex. The Allen mouse brain atlas (CCFv3) is shown in view from ventral in (b) and (c), with the four main subcortical target regions rendered as solid (b) or transparent surfaces (c). Subcortical projections from the three experiments are co-visualized as colour-coded points in the pontine nuclei (d, viewed én face, obliquely from rostroventral), caudoputamen (e, rostral view), thalamus (f, rostral view), and superior colliculus (g, rostral view). For each region, a 50 µm thick sagittal slice is cut through the point clouds, at levels indicated with lines in (c). Viewed from medial, the slices reveal different concentric or graded patterns of spatial distribution (d’-g’). Abbreviations: M, medial; A, anterior; D, dorsal; P, posterior; CPu, caudoputamen; Thal, thalamus; PN, pontine nuclei; SC, superior colliculus. Scale bars: A, 1 mm; B and C, 2 mm; D, D’, 200 µm; E - G’, 500 µm.
Fig. 6
Fig. 6
Altered topographical distribution of corticopontine projections in transgenic mice lacking the area patterning gene Nr2f1. The example illustrates how co-visualization of atlas-integrated data points representing corticopontine projections can be used to demonstrate topographical shifts in the distribution of axons in mice lacking the area patterning gene Nr2f1, which is known to contribute to the establishment of topographically organized neural networks. 3D visualization of data points representing corticopontine projections from closely corresponding locations in the primary somatosensory cortex (S1) in a wild-type control mice (a, case #112229814, blue points) and a Nex-cKO mutant mouse lacking Nr2f1 expression (b, case #19423_7, red points). The data points are shown within a transparent surface rendering of the pontine nuclei in view from ventral. Co-visualization of the data points (c) show that corticopontine projections from the S1 upper limb representation are clearly shifted to a more rostral location in the pontine nuclei, compared to the wild-type control. For a detailed analysis of the altered subcortical projections in mice lacking Nr2f1, see original paper by Tocco et al.. Abbreviations: D, dorsal; M, medial. Scale bars: 200 µm.

Similar articles

References

    1. Diamond, M. E., Petersen, R. S. & Harris, J. A. Learning through maps: functional significance of topographic organization in primary sensory cortex. J Neurobiol41, 64–68 (1999). - PubMed
    1. Chklovskii, D. B. & Koulakov, A. A. Maps in the brain: What can we learn from them? Annual Review of Neuroscience27, 369–392, 10.1146/annurev.neuro.27.070203.144226 (2004). - PubMed
    1. Cline, H. T., Lau, M. & Hiramoto, M. Activity-dependent Organization of Topographic Neural Circuits. Neuroscience508, 3–18, 10.1016/j.neuroscience.2022.11.032 (2023). - PMC - PubMed
    1. Kaas, J. H. Topographic maps are fundamental to sensory processing. Brain Res Bull44, 107–112, 10.1016/s0361-9230(97)00094-4 (1997). - PubMed
    1. Harding-Forrester, S. & Feldman, D. E. Somatosensory maps. 1 edn, Vol. 151 (Elsevier B.V., 2018). - PubMed

LinkOut - more resources