. 2024 Nov 12;7(1):1495.
doi: 10.1038/s42003-024-07130-4.

Single-cell transcriptomics reveals the molecular basis of human iPS cell differentiation into ectodermal ocular lineages

Affiliations

Single-cell transcriptomics reveals the molecular basis of human iPS cell differentiation into ectodermal ocular lineages

Laura Howard et al. Commun Biol. .

Abstract

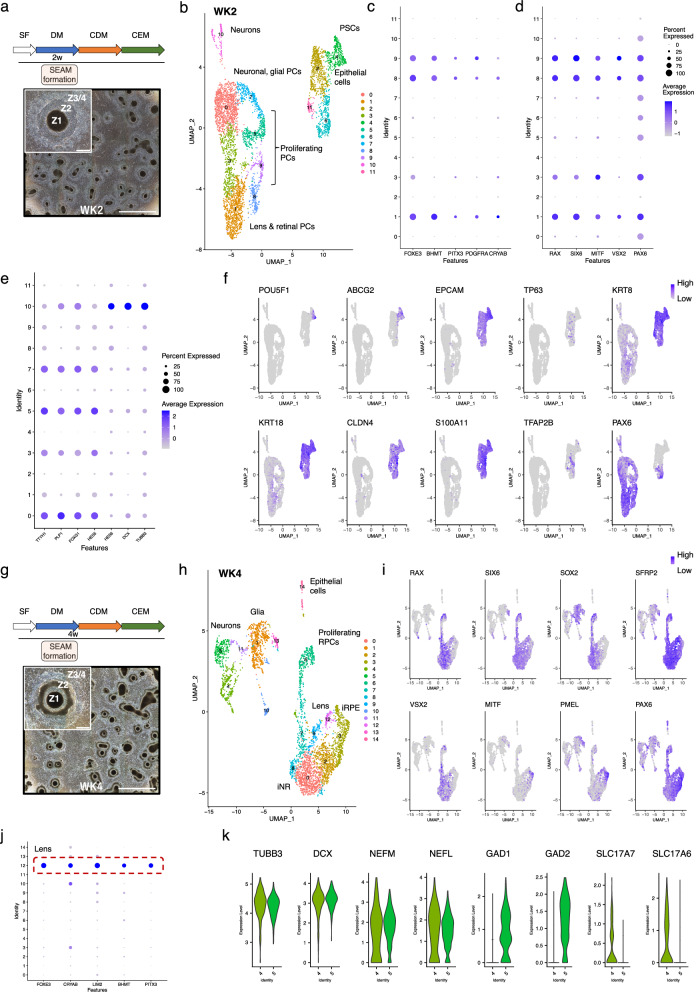
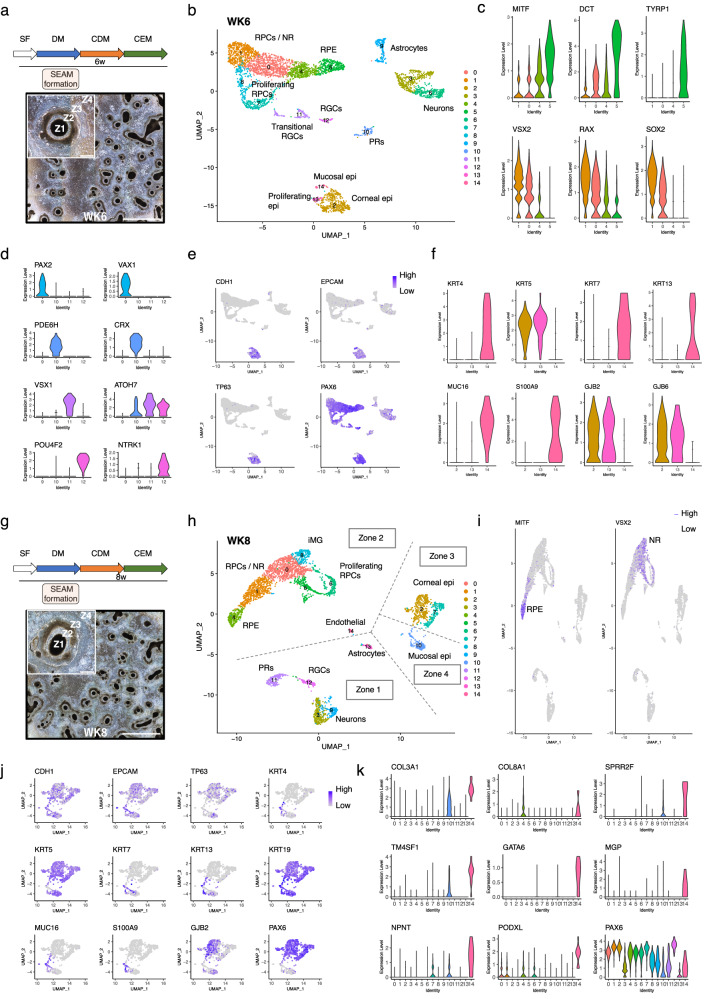
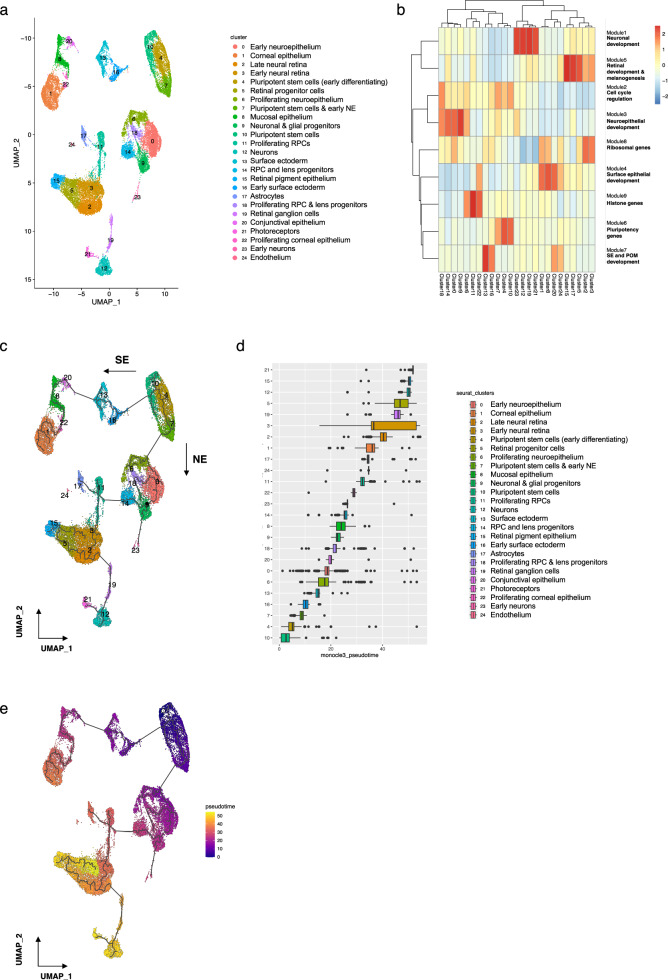
The generation of a self-formed, ectodermal, autonomous multi-zone (SEAM) from human induced pluripotent stem cells (hiPSCs) offers a unique perspective to study the dynamics of ocular cell differentiation over time. Here, by utilising single-cell transcriptomics, we have (i) identified, (ii) molecularly characterised and (iii) ascertained the developmental trajectories of ectodermally-derived ocular cell populations which emerge within SEAMs as they form. Our analysis reveals interdependency between tissues of the early eye and delineates the sequential formation and maturation of distinct cell types over a 12-week period. We demonstrate a progression from pluripotency through to tissue specification and differentiation which encompasses both surface ectodermal and neuroectodermal ocular lineages and the generation of iPSC-derived components of the developing cornea, conjunctiva, lens, and retina. Our findings not only advance the understanding of ocular development in a stem cell-based system of human origin, but also establish a robust methodological paradigm for exploring cellular and molecular dynamics during SEAM formation at single-cell resolution and highlight the potential of hiPSC-derived systems as powerful platforms for modelling human eye development and disease.


Conflict of interest statement

Competing interests The authors declare no competing interests.

Figures

Fig. 1
Fig. 1. scRNAseq analysis of WK0 and WK1 SEAMs.
a Phase-contrast image of a typical differentiating SEAM after 40 days of culture, showing the four characteristic zones. Scale bar: 100 μm. b Schematic depicting relationship of each zone to the developing embryonic eye. c Experimental timeline and representative phase-contrast image showing WK0 SEAMs in culture. Scale bar: 5000 μm; inset, 500 μm. d UMAP plot of WK0 SEAMs. e Feature plots showing expression of pluripotency markers. f Feature plots showing expression of early markers of ocular differentiation. g Experimental timeline and representative phase-contrast image showing WK1 SEAMs in culture. Scale bar: 5000 μm; inset, 500 μm. h UMAP plot of WK1 SEAMs. i Violin plots showing restriction of pluripotent gene expression (POU5F1) and expression of surface ectoderm markers in clusters 5 and 6. j Dot plot showing co-expression of CNN / POM markers by cells in cluster 5 and 6. k Feature plots showing segregation of pluripotent, neuroectodermal and surface ectodermal cells in WK1 SEAMs. Z1 Zone 1, Z2 Zone 2, Z3 Zone 3, Z4 Zone 4, SF StemFit medium, DM differentiation medium, CDM corneal differentiation medium, CEM corneal epithelium maintenance medium, EFTFs eye-field transcription factors, NE neuroectoderm, NC neural crest, RC retinal cells, RPE retinal pigment epithelium, NR neural retina, LE lens, OSE ocular surface ectoderm, SE surface ectoderm, CE corneal epithelium, CjE conjunctival epithelium, EK epidermal keratinocyte, PSC pluripotent stem cell, CNN cranial neural crest, POM periocular mesenchyme.
Fig. 2
Fig. 2. scRNAseq analysis of WK2 and WK4 SEAMs.
a Experimental timeline and representative phase-contrast image showing WK2 SEAMs in culture. Scale bar: 5000 μm; inset, 500 μm. b UMAP plot of WK2 SEAMs. c Dot plots showing expression of lens progenitor cell markers FOXE3, BHMT, PITX3, PDGFRA and CRYAB. d Dot plots illustrating overlapping expression domains of NR markers and RPE marker MITF. e Dot plots showing expression of glial and neural markers. f Feature plots showing populations of stem (POU5F1, ABCG2) and surface ectoderm-derived epithelial cells. Elevated PAX6 expression indicates ocular lineages. g Experimental timeline and representative phase-contrast image showing WK4 SEAMs in culture. Scale bar: 5000 μm; inset, 500 μm. h UMAP plots of WK4 SEAMs. i Feature plots showing widespread expression of PAX6, SIX6 and SFRP2 and reciprocal expression of VSX2, SOX2 and RAX in developing NR compared with MITF and PMEL in RPE. j Lens marker expression in Seurat cluster 12. k Violin plots showing contribution of neuronal cell subtypes to clusters 4 and 5. Z1 Zone 1, Z2 Zone 2, Z3 Zone 3, Z4 Zone 4, SF StemFit medium, DM differentiation medium, CDM corneal differentiation medium, CEM corneal epithelium maintenance medium, PSC pluripotent stem cell, PC progenitor cell, RPC retinal progenitor cell, NR neural retina, RPE retinal pigment epithelium. ‘i‘ denotes immature cells.
Fig. 3
Fig. 3. scRNAseq analysis of WK6 and WK8 SEAMs.
a Experimental timeline and representative phase-contrast image showing WK6 SEAMs in culture. Scale bar: 5000 μm; inset, 500 μm. b UMAP plot of WK6 SEAMs. c Violin plots illustrating progressive delineation of developing RPE (MITF, DCT, TYRP1) and NR (VSX2, RAX, SOX2. d Violin plots showing expression patterns indicative of astrocytes (PAX2, VAX1), RGCs (POU4F2, NTRK1, ATOH7), bipolar interneurons (VSX1) and cone photoreceptors (PDE6H, CRX). e Feature plots showing expression of epithelial markers. f Violin plots showing expression of corneal (KRT5), basal epithelial (GJB2, GJB6) and mucosal (KRT4, KRT7, KRT13, MUC16, S100A9) markers in epithelial subsets. g Experimental timeline and representative phase-contrast image showing WK8 SEAMs in culture. Scale bar: 5000 μm; inset, 500 μm. h UMAP plot of WK8 SEAMs indicating contribution of clusters to SEAM zones. i Feature plots showing non-overlapping domains of NR and RPE cells in the SEAM. j Feature plots showing expression patterns in subsets of epithelial cells. k Violin plots showing expression of endothelial markers in cluster 14. Z1 Zone 1, Z2 Zone 2, Z3 Zone 3, Z4 Zone 4, SF StemFit medium, DM differentiation medium, CDM corneal differentiation medium, CEM corneal epithelium maintenance medium, PSC pluripotent stem cell, epi epithelium, PC progenitor cell, RPC retinal progenitor cell, NR neural retina, RPE retinal pigment epithelium, RGC retinal ganglion cells, PR photoreceptors, MG Müller glia. ‘i‘ denotes immature cells.
Fig. 4
Fig. 4. scRNAseq analysis of WK10 and WK12 SEAMs.
a Experimental timeline and representative phase-contrast image showing WK10 SEAMs in culture. Scale bar: 5000 μm; inset, 500 μm. b UMAP plot of WK10 SEAMs. c Dot plot showing expression profiles of specialised cells in the SEAM. d Feature plots showing expression of epithelial markers and keratin subtypes across clusters. e Violin plots illustrating expression of basal epithelium (GJB2, GJB6), lacrimal gland (LCN2, DEFB1), skin & mucosal (DSG3, CXCL17, MUC1, MUC16), mucociliary (AGR3) and migratory cell (MMP10, POSTN) markers. f Experimental timeline and representative phase-contrast image showing WK12 SEAMs in culture. Scale bar: 5000 μm; inset, 500 μm. g UMAP plot of WK12 SEAMs. h Dot plot showing expression profiles of specialised cells in the SEAM. i Feature plots showing expression of epithelial markers and keratin subtypes across clusters. j Violin plots illustrating expression of basal epithelium (GJB2, GJB6), lacrimal gland (LCN2, DEFB1), skin & mucosal (DSG3, CXCL17, MUC4, MUC16), and migratory cell (MMP10, POSTN) markers. Z1 Zone 1, Z2 Zone 2, Z3 Zone 3, Z4 Zone 4, SF StemFit medium, DM differentiation medium, CDM corneal differentiation medium, CEM corneal epithelium maintenance medium, epi epithelium, mig migratory, PC progenitor cell, RPC retinal progenitor cell, NR neural retina, RPE retinal pigment epithelium, RGC retinal ganglion cells, PR photoreceptors, ACs astrocytes, RCs retinal cells, MG Müller glia. ‘m’ denotes mature cells.
Fig. 5
Fig. 5. Combined data and trajectory inference.
a UMAP representation of combined data, grouped by Seurat cluster. b Clustered heatmap showing aggregated expression of all genes in Monocle3 modules across Seurat clusters. Co-expressed genes were clustered into modules using find_gene_modules and heatmaps were generated using the ‘pheatmap’ package. c Monocle3 trajectory inference predicted by learn_graph. Surface ectodermal vs. neuroectodermal lineages are indicated by arrows. d Boxplot showing distribution of Monocle3 pseudotime values within each Seurat cluster, with clusters reordered based on their median pseudotime values. e UMAP plot with cells coloured by pseudotime. The root of the trajectory is labelled (1). SE surface ectoderm, NE neuroectoderm.

References

    1. Hayashi, R. et al. Co-ordinated ocular development from human iPS cells and recovery of corneal function. Nature531, 376–380 (2016). - PubMed
    1. Hayashi, R. et al. Coordinated generation of multiple ocular-like cell lineages and fabrication of functional corneal epithelial cell sheets from human iPS cells. Nat. Protoc.12, 683–696 (2017). - PubMed
    1. Gehring, W. J. The master control gene for morphogenesis and evolution of the eye. Genes Cells1, 11–15 (1996). - PubMed
    1. Grocott T., Lozano-Velasco E., Mok G. F. & Munsterberg A. E. The Pax6 master control gene initiates spontaneous retinal development via a self-organising Turing network. Development147, dev185827 (2020). - PMC - PubMed
    1. Watanabe, S. et al. Human iPS cells engender corneal epithelial stem cells with holoclone-forming capabilities. iScience24, 102688 (2021). - PMC - PubMed