. 2024 Nov 12;7(1):318.
doi: 10.1038/s41746-024-01296-1.

The effects of a digital health intervention on patient activation in chronic kidney disease

Collaborators, Affiliations

The effects of a digital health intervention on patient activation in chronic kidney disease

Courtney J Lightfoot et al. NPJ Digit Med. .

Abstract

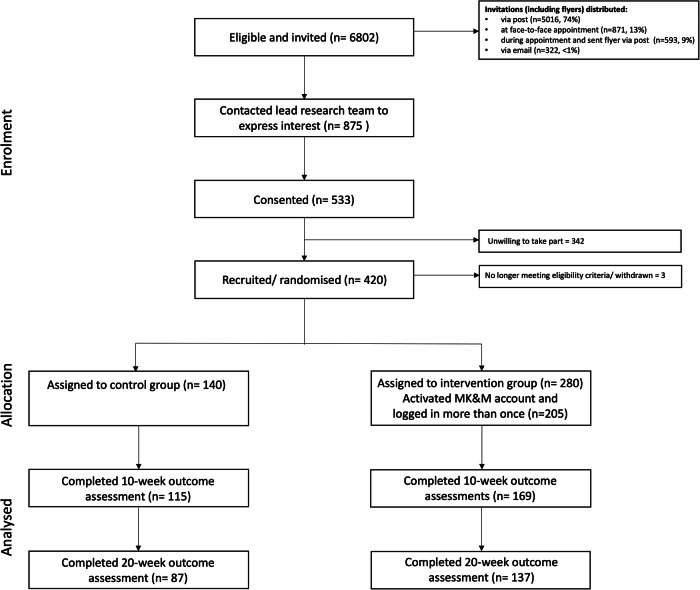
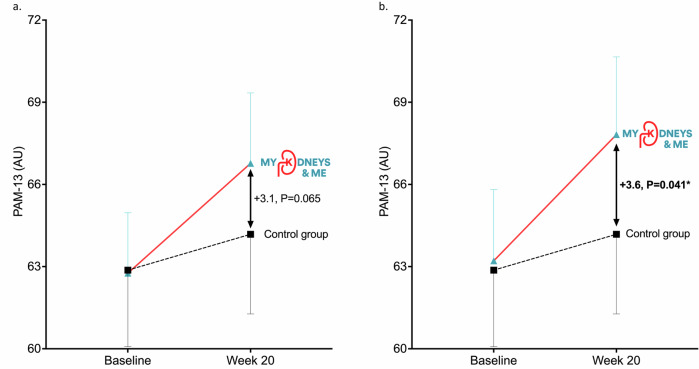
My Kidneys & Me (MK&M), a digital health intervention delivering specialist health and lifestyle education for people with CKD, was developed and its effects tested (SMILE-K trial, ISRCTN18314195, 18/12/2020). 420 adult patients with CKD stages 3-4 were recruited and randomised 2:1 to intervention (MK&M) (n = 280) or control (n = 140) groups. Outcomes, including Patient Activation Measure (PAM-13), were collected at baseline and 20 weeks. Complete case (CC) and per-protocol (PP) analyses were conducted. 210 (75%) participants used MK&M more than once. PAM-13 increased at 20 weeks compared to control (CC: +3.1 (95%CI: -0.2 to 6.4), P = 0.065; PP: +3.6 (95%CI: 0.2 to 7.0), P = 0.041). In those with low activation at baseline, significant between-group differences were observed (CC: +6.6 (95%CI: 1.3 to 11.9), P = 0.016; PP: +9.2 (95%CI: 4.0 to 14.6), P < 0.001) favouring MK&M group. MK&M improved patient activation in those who used the resource compared to standard care, although the overall effect was non-significant. The greatest benefits were seen in those with low activation.


Conflict of interest statement

Competing interests The authors declare no competing interests.

Figures

Fig. 1
Fig. 1. My Kidneys & Me dashboard and features.
Illustration of the My Kidneys & Me dashboard and key features.
Fig. 2
Fig. 2. CONSORT diagram.
Flowchart depicting progress through the trial phases.
Fig. 3
Fig. 3. Changes in PAM-13 score from baseline to week 20.
a CC analysis - includes all participants who completed PAM-13. b PP analysis - includes those who logged in, created an account and used the programme more than once. Data is shown as mean and standard deviation.
Fig. 4
Fig. 4. Changes in PAM-13 score from baseline to week 20 for participants with low and high baseline patient activation.
a CC analysis - includes all participants who completed PAM-13. b PP analysis - includes those who logged in, created an account and used the programme more than once. Data shown as mean and standard deviation. High baseline group was defined as those with PAM-13 Levels 3 and 4, low baseline group was defined as those with PAM-13 Levels 1 and 2. Horizontal dashed lines indicate the cut-off between low and high activation.

References

    1. GBD Chronic Kidney Disease Collaboration. Global, regional, and national burden of chronic kidney disease, 1990-2017: a systematic analysis for the Global Burden of Disease Study 2017. Lancet395, 709-733 (2020). - PMC - PubMed
    1. Kidney Research UK. Kidney disease: A UK public health emergency. The health economics of kidney disease to 2033. (2023).
    1. Hull, S. A., Nitsch, D., Caplin, B., Griffith, K. & Wheeler, D. C. The National CKD Audit: a primary care condition that deserves more attention. Br. J. Gen. Pract. : J. R. Coll. Gen. Practitioners68, 356–357 (2018). - PMC - PubMed
    1. Kovesdy, C. P. Epidemiology of chronic kidney disease: an update 2022. Kidney Int Suppl. (2011)12, 7–11 (2022). - PMC - PubMed
    1. Greer, R. C., Crews, D. C. & Boulware, L. E. Challenges perceived by primary care providers to educating patients about chronic kidney disease. J. Ren. Care38, 174–181 (2012). - PMC - PubMed

LinkOut - more resources