. 2024 Dec;43(24):6705-6739.
doi: 10.1038/s44318-024-00301-3. Epub 2024 Nov 12.

Determinants of chemoselectivity in ubiquitination by the J2 family of ubiquitin-conjugating enzymes

Affiliations

Determinants of chemoselectivity in ubiquitination by the J2 family of ubiquitin-conjugating enzymes

Anuruti Swarnkar et al. EMBO J. 2024 Dec.

Abstract

Ubiquitin-conjugating enzymes (E2) play a crucial role in the attachment of ubiquitin to proteins. Together with ubiquitin ligases (E3), they catalyze the transfer of ubiquitin (Ub) onto lysines with high chemoselectivity. A subfamily of E2s, including yeast Ubc6 and human Ube2J2, also mediates noncanonical modification of serines, but the structural determinants for this chemical versatility remain unknown. Using a combination of X-ray crystallography, molecular dynamics (MD) simulations, and reconstitution approaches, we have uncovered a two-layered mechanism that underlies this unique reactivity. A rearrangement of the Ubc6/Ube2J2 active site enhances the reactivity of the E2-Ub thioester, facilitating attack by weaker nucleophiles. Moreover, a conserved histidine in Ubc6/Ube2J2 activates a substrate serine by general base catalysis. Binding of RING-type E3 ligases further increases the serine selectivity inherent to Ubc6/Ube2J2, via an allosteric mechanism that requires specific positioning of the ubiquitin tail at the E2 active site. Our results elucidate how subtle structural modifications to the highly conserved E2 fold yield distinct enzymatic activity.

Keywords: ER-associated Protein Degradation; Noncanonical Ubiquitination; Posttranslational Modification; RING E3 Ligase; Ubiquitin-conjugating Enzyme.


Conflict of interest statement

Disclosure and competing interests statement. The authors declare no competing interests.

Figures

Figure 1
Figure 1. Active site architecture of the J2 family E2 Ubc6.
(A) Cartoon representation of the 1.33 Å resolution X-ray structure of the yeast Ubc6 UBC domain in gray (PDB: 9EN5). The GRF loop, the active site loop and the Thr-flap are colored in cyan, orange, and pink, respectively. Side chains for Arg85, Cys87, and Asp92-His94 of the active site loop are shown as sticks. Numbering of helices according to the convention for canonicals E2s. (B) Structural overlay the Ubc6 UBC domain with the canonical E2 Ube2D2 (PDB: 6SQO). Coloring for Ubc6 as in (A), Ube2D2 in green. To highlight structural rearrangement in Ubc6 compared to canonical E2s, the HPN motif-containing loop (HPN-loop) and the corresponding GRF loop in Ubc6 are shown in blue and cyan, respectively. Likewise, the CES/D site-containing loop and the corresponding Thr-flap of Ubc6 are shown in purple and pink, respectively. (C) Zoomed-in views of the active site arrangement from (A). Black dashed lines indicate electrostatic interactions between conserved residues. Coloring and labeling as in (A). (D) Weblogo for the active site proximal region of Ube2J2/Ubc6 homologs, generated from an alignment of 199 sequences from diverse set of eukaryotes. Conserved features are colored as in (A). Symbol heights within a stack represent relative frequency of each residue. The residue numbering corresponds to S. cerevisiae Ubc6. The alignment used for generating the Weblogo can be found in Dataset EV1.
Figure 2
Figure 2. Structure of Ubc6 UBC domain linked to ubiquitin.
(A) Cartoon representation of the Ub-loaded UBC domain of Ubc6. The native thioester linkage was replaced with an isopeptide bond by mutating Cys87 to Lys. The asymmetric unit contains two copies of this assembly. In the first copy, Ubc6 is labeled as in Fig. 1B and Ub in light blue, in the second copy, Ubc6 and Ub are labeled in pale cyan and pale green, respectively. (B) Structural overlay of copy 1 of Ubc6-Ub as in (A) and the crystal structure of the heterotrimeric Rnf4-Ube2D1-Ub complex (PDB: 4AP4, Rnf4 not shown) with Ube2D1 and Ub in pale green and light pink, respectively. (C) Chemical shift perturbation (CSP) in 15N-ubiquitin, disulfide linked to WT Ubc6 and Ubc6 S89A, in gray and red, respectively. The dashed lines along with a star on the X-axis correspond to the residues of ubiquitin that display NMR signal broadening from interaction with Ubc6 as a result of slowed exchange rate. (D) Zoomed-in view of the ubiquitin attachment site in the native Ubc6-Ub complex derived from MD simulations. Parts of the active site loop, the Thr-Flap and the ubiquitin tail are shown as sticks with coloring as in Fig. 1 and in (A). Hydrogen bonds and salt bridges are indicated as dashed yellow and blue lines, respectively. The table on the right provides the frequencies and types of interactions between key residues (Res 1 and 2) over all simulation replicates. DA donor-acceptor; AD acceptor-donor; SB salt bridge. (E) Cartoon representation of Ubc6-Ub as derived from molecular dynamics (MD) simulations of the native, thioester-linked complex. Key residues are shown as sticks. The putative Doa10 binding site is highlighted in yellow. Coloring by per-residue root mean square fluctuation (RMSF) over a total of 100 µs of MD simulations. (F) Configurations of His94 relative to the thioester are depicted as a function of orientation angle and distance from the thioester plane. The orientation is determined as the angle between the center of mass (COM) of the imidazole ring, the unprotonated ε-nitrogen (Nε) and the carbonyl carbon of Gly76Ub. The offset is determined by the signed distance between Nε and the thioester plane. Positive distances represent orientations where the ε-nitrogen faces the solvent cavity, negative distances denote configurations where the ε-nitrogen is situated on the bulk solvent side of the thioester plane. Two example configurations are shown on the panels to the right. The colored stars indicate the orientation and offset values of these configurations.
Figure 3
Figure 3. Mutations of residues in the active site loop and Thr-flap stabilize Ubc6.
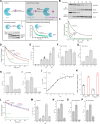
(A) Cycloheximide (CHX) chase analysis of HA-tagged wild-type (WT) Ubc6 and the indicated mutants expressed from a plasmid under the control of the endogenous UBC6 promoter in a S. cerevisiae ubc6Δ background. The degradation of Ubc6-HA was followed after inhibition of protein synthesis by CHX. Whole-cell extracts of cells collected at the indicated time points were analyzed by SDS-PAGE and western blotting. Ubc6-HA was detected with an anti-HA antibody. Phosphoglycerate kinase (Pgk1) was used as a loading control. (B) Quantification of three experiments as in (A). Error bars represent mean ± one standard deviation. (C) Box chart quantification of the fraction of Ubc6-HA remaining 1 h after CHX addition representing mean ± one standard deviation from three independent experiments as in (A). * and ** denote P values < 0.1 and <0.01, respectively, derived from one-way ANOVA significance tests with Tukey’s post hoc analysis. Individual P values are: 0.0000374 (C87A, WT), 0.00898 (S89A, WT), 0.000123 (H94A, WT), 0.00212 (H94Q, WT), and 0.099 (T121A, WT). Source data are available online for this figure.
Figure 4
Figure 4. His94 in Ubc6 is required for reactivity toward the hydroxy group.
(A) Time course of Ubc6 autoubiquitination in the absence of Doa10. Fluorescently labeled wild-type (WT) Ubc6 or its indicated variants were reconstituted into liposomes and incubated with E1, ubiquitin, and ATP. Where indicated, ATP was omitted. Samples were analyzed by reducing SDS-PAGE and fluorescence scanning. The concentration of Ubc6 was identical for variants; the varying signal strength is due to different labeling efficiencies. (B) Time course of Ubc6 autoubiquitination as in (A), but with co-reconstituted Doa10 (Top). In the same samples, autoubiquitination of fluorescently labeled Doa10 was analyzed (Bottom). Ubc6 and Doa10 were detected in separate fluorescence channels at 700 and 800 nm, respectively. (C) Quantification of the autoubiquitinated fraction of the indicated Ubc6 variants from experiments as in (A, B). Data points and error bars indicate mean ± one standard deviation from the mean (SDM) from three experiments. Solid and dashed lines connect means for experiments with and without Doa10, respectively. N = 3 for reactions without Doa10, N = 4 for reactions with Doa10. (D) Time course of ubiquitination of WT Sbh2 and its mutant Sbh2 4KS. Fluorescently labeled Sbh2 variants were co-reconstituted with Doa10. In addition, either Ubc6, Ubc7/Cue1, or all three proteins were co-reconstituted. Samples were analyzed by SDS-PAGE and fluorescence scanning. The asterisk marks a band that appears upon co-reconstitution of Doa10 with fluorescently labeled Sbh2. It probably reflects a partially SDS-resistant complex of the two proteins. (E) Quantification of Sbh2, Sbh2 4KS and 4KR ubiquitination in the presence of Doa10 and Ubc6 from at least four experiments as in (D) and Fig. EV3B. Solid lines connect means. N = 10 for WT Sbh2, N = 7 for Sbh2 4KR, N = 4 for Sbh2 4KS. (F) Quantification of Sbh2, Sbh2 4KS, and 4KR ubiquitination in the presence of Doa10 and Ubc7/Cue1 from at least four different experiments as in (D) and Fig. EV3B. Data points and error bars indicate mean ± SDM. N = 7 for WT Sbh2, N = 4 for Sbh2 4KR, N = 3 for Sbh2 4KS. (G) Quantification of Sbh2, Sbh2 4KS, and 4KR ubiquitination in the presence of Doa10 and Ubc6 H94Q. Data points, connected by dashed lines, and error bars indicate mean ± SDM. N = 7 for WT Sbh2, N = 3 for Sbh2 4KR, N = 2 for Sbh2 4KS. For comparison, data from (E) for WT Ubc6 is reproduced here, with data points connected with solid lines. (H) Bar plots showing the fraction of Sbh2 ubiquitination resistant to sodium hydroxide (NaOH) treatment, as an indication for lysine ubiquitination. Individual experiments are shown as dots. Error bars indicate SDM. Samples were collected after 1 h from reactions as in Fig. EV3D,E. For samples containing WT Ubc6, N = 6 for WT Sbh2, N = 4 for Sbh2 4KS, N = 3 for Sbh2 4KR. For WT Sbh2 in combination with Ubc6 H94, N = 4. N = 1 for WT Sbh2 with Ubc7. (I) Time course of the emergence of NaOH-resistant and -sensitive Sbh2 ubiquitinations in reactions with co-reconstituted Doa10 and either WT Ubc6 or a Ube2J2/Ubc6 chimera. Where indicated, samples were treated with NaOH to preserve only lysine modifications. Reactions lacking ATP serve as controls. Samples were analyzed by SDS-PAGE followed by fluorescence scanning. (J) Quantification of experiments as in (I). The NaOH-sensitive fraction represents the difference between the total and NaOH-resistant fraction. For visualization, double-exponential fits to the data are shown as solid lines. N = 4 for Ubc6, N = 3 for Ube2J2/Ubc6 chimera. Source data are available online for this figure.
Figure 5
Figure 5. Intrinsic reactivity profiling of Ubc6 by discharge assays.
(A) Scheme for nucleophile discharge assay. Loading: E1, the UBC domain of Ubc6, and ubiquitin (Ub) are incubated with ATP in the presence of magnesium ions to generate the Ubc6-Ub thioester-linked conjugate. Quenching and chase: EDTA inactivates E1 by chelating magnesium ions, thereby preventing E1-mediated reloading of E2 discharged by hydrolysis or another nucleophile. Reaction rates are determined either by densitometry analysis of SDS-PAGE or by fluorescence anisotropy using fluorescently labeled ubiquitin. (B) Ubc6 discharge assay as described in (A) in the absence or presence of 250 mM glycerol during the chase step. Samples taken at the indicated time points of the chase reaction were analyzed by non-reducing SDS-PAGE and fluorescence scanning. (C) Quantification of discharge rates from experiments as in (B). The fraction of the loaded and discharged state were quantified by densitometry. The data were then globally fitted to determine rate constants for hydrolysis (k1) and discharge by glycerol (k2,glycerol), accounting for a minor fraction of autoubiquitination. Solid lines show the result of the fitting procedure. (D) As in (C), but without and with 100 mM of the indicated free amino acids. (E) Bar plots showing second-order rate constants (k2) for discharge by the indicated free amino acids or glycerol. Individual data points represent fitting results, each derived from an experiment as in (D). Means and 1.5 standard deviations from the mean were determined from at least three experiments (see Source Data for exact N numbers). (FI) Bar plots comparing reactivity of the indicated Ubc6 mutants towards the indicated nucleophiles with that of WT Ubc6. Discharge by hydrolysis is indicated as “H2O”. Rate constants of mutants (kMut) for different nucleophiles were determined as in (D) and averages determined as described for (E). Plotted are fold differences of discharge rates kWTkMut; (F) T122A, (G) T121A, (H) S89A, and (I) H94Q. Average rate constants for each mutant and nucleophile were determined from at least three experiments (see Source Data for exact N numbers). Errors () were calculated from standard deviations of average rate constants (∂k) for each mutant and nucleophile according to kWTkMut=kWTkMutkWTkWT2+kMutkMut2. (J) pH profile of the discharge rate form Ubc6 in the presence of 100 mM glycerol determined by fluorescence anisotropy. WT UBC domain of Ubc6 was loaded with fluorescently labeled ubiquitin at pH 7.4, followed by dilution into buffers of the indicated pH values with 100 mM glycerol. Discharge rates were determined by fitting fluorescence anisotropy traces with a mono-exponential function, resulting in the plotted kobs values for each anisotropy trace. The solid line is derived from a dose-response fit. (K) Bar plots showing a kinetic solvent isotope effect on hydrolysis (k1) and serine-mediated ubiquitin discharge (k2,serine) from either WT Ubc6 or its H94Q mutant. Discharge rates were determined as in (D, E) in either deuterated or non-deuterated solvent. Individual data points represent rates determined from experiments with H2O or D2O performed in parallel, followed by calculation of the ratio of the two rate constants. (L) As in (D), but with yeast Ubc2, comparing discharge without and with 100 mM of the indicated free amino acids. Values for each time point are shown as colored symbols connected by solid lines. (M) As in (E), but with the UBC domain of human Ube2J2. A representative example of the data included here and the result of the fitting procedure is shown in Fig. EV4L. N = 6 for lysine and serine, N = 3 for histidine, NAc-Tyr, and threonine. (NP) Bar plots comparing reactivity of the indicated Ube2J2 mutants towards the indicated nucleophiles with that of WT Ube2J2. Discharge by hydrolysis is indicated as “H2O”. Average rate constants for each mutant and nucleophile were determined from at least three experiments as in (E) (see Source Data for exact N numbers). Plotted are fold differences of WT/mutant discharge rates; (N) S96A, (O) H101Q, (P) T128A. These ratios with associated errors were determined as described for (FI). Source data are available online for this figure.
Figure 6
Figure 6. RING binding enhances intrinsic Ubc6 reactivity toward hydroxy groups.
(A) Ubc6 ubiquitin discharge assay performed by directly diluting purified fluorescently labeled Ubc6-Ub in chase buffer without or with 10 µM of the indicated Doa10 RING domain construct, in the absence of EDTA. Samples taken at the indicated time points were analyzed by non-reducing SDS-PAGE and fluorescence scanning. (B) Quantification of reactions as in (A). In addition, reactions are shown that contained 2 or 5 mM EDTA. Solid lines represent fits of the data. (C) Bar plots showing observed rates of hydrolysis (k1) of Ubc6-Ub in the presence or absence of 10 µM Doa10 RING-CTE, derived from exponential fits of plots as in (B) from 8 and 25 experiments, respectively. Bars show the mean, error bars one standard deviation. (D) Scatter plot showing observed rates of discharge by the indicated free amino acids plotted against the RING-CTE concentration. For reactions containing RING-CTE, each data point represents the apparent rate constant determined by global fitting of a pair of reactions in the absence or presence of the indicated nucleophile. For reaction in the absence of RING-CTE, values determined in experiments for Fig. 5 are reproduced, with error bars indicting the standard deviation from the mean. Solid lines represent linear fits for each nucleophile. Examples of data used here are shown in Fig. EV5C and Appendix Fig. S6D. (E) Bar plots showing reactivity of the indicated Ubc6 variants to free serine at the indicated RING-CTE concentrations. Observed second-order rate constants for discharge by serine (k2obs,serine) were determined as described for (D). Error bars indicate one standard deviation from the mean. The number of replicates is indicated in the table (N). (F) As in (E), but with free lysine as a nucleophile (k2obs,lysine). (G) Ubiquitin discharge assays performed with 2 µM ubiquitin-loaded Ube2J2 in the presence of 50 mM of the indicated nucleophiles and 0.5 µM of a MarchF6 RING-CTE. N = 3 for reactions in the absence of additional nucleophile, lysine, and serine, N = 2 for reactions with histidine and NAc-Tyr. Solid lines represent global exponential fits to all data derived from each nucleophile. For comparison, a hydrolysis reaction is shown in the absence of MarchF6. (H) As in (E), but showing reactivity of the indicated Ube2J2 variants to free serine at the indicated concentrations of MarchF6 RING-CTE (M6-RING-CTE). Source data are available online for this figure.
Figure EV1
Figure EV1. Structures and conformational dynamics of Ubc6 and Ubc6-Ub.
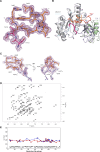
(A) Electron density map (2Fo-Fc, contoured at the 1.5 σ level) for the active site loop (orange) and the Thr-flap (pink) of the UBC domain of Ubc6 (PDB: 9EN5). (B) Comparison of the two copies of the Ubc6-Ub assembly in the asymmetric unit. For alignment in Pymol, the second copy was aligned to the Ubc6 of the first copy. Thr-flap and GRF loop are colored as in Figs. 1 and 2. The active site loop (residues 85–94) is colored orange and red for copies 1 and 2, respectively. The Ubc6-Ub linkage and residue His94 are shown as sticks. The two structures differ markedly in the conformation of the active site proximal region (Lys87-Trp98). Importantly, in the second copy, His94 points away from the ubiquitin attachment site and is involved in crystal packing contacts (not shown). Furthermore, the ubiquitin tails and the relative orientation of ubiquitin towards the UBC domain differ, so that in the second copy, ubiquitin adopts a more “open” conformation (distance CαSer113Ubc6 – CαIle44Ub 6.8 Å and 9.0 Å for copies 1 and 2, respectively). (C) Electron density map (2Fo-Fc, contoured at the 1.0 σ level) for the active site loop (Arg85-His94, in orange) and the ubiquitin tail of the first copy (Leu71-Gly76, in light blue) (PDB: 9EN5). (D) The two-dimensional [15N,1H]-HSQC spectrum of ubiquitin. The assignments are indicated by the corresponding number along the protein primary sequence followed by the one-letter amino acid code. (E) Plot of rotational correlation time (τc) of Ubc6WT-(15N)Ub and Ubc6C89A-(15N)Ub in blue and red, respectively. For comparison τc for free (15N)Ub is shown in gray. Ubc6 and ubiquitin were coupled by a disulfide bond using the ubiquitin mutant G76C. The x-axis denotes residue numbering in ubiquitin.
Figure EV2
Figure EV2. Molecular dynamics simulations of Ubc6-Ub.
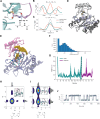
(A) Structure of the C87Ubc6-G76Ub thioester bond. The residues involved are shown as sticks, the rest of the complex is shown in cartoon representation. The inset shows the capped glycine used for assignment and parameterization of the force field parameters. (B, C) Optimization of force field parameters. (B) Dihedral scans of the SG-C-CA-N (Ψ) torsion. QM potential is shown in gray, the initial force field based potential is shown in red and the optimized potential is shown in teal. All potentials were zeroed on the minimum. (C) Dihedral scans of the C-CA-N-C-1 (ϕ) torsion. Plot structure is the same as (B). (D) Cartoon representation of the average structure of the native Ubc6-Ub complex obtained by the simulated annealing procedure. Ubc6 is colored in dark gray, ubiquitin in light gray. The isopeptide-linked Ub-tail from the crystal structure is depicted in yellow, the thioester-linked tail in green. For the parts of the model that were not restrained during simulated annealing (Ubc6 residues 79-98 and 115-128; ubiquitin residues 71-76), every tenth configuration is overlaid in transparent blue. (E) A solvent-filled cavity is present near the active site of the Ubc6-Ub complex. Key residues involved in the formation of this cavity are represented as cyan sticks; the rest of Ubc6 and ubiquitin colored in blue and pink, respectively. Small yellow spheres outline the pocket volume, averaged over all configurations generated during simulated annealing. (F) Volume of the solvent-filled cavity enclosed by the C-terminal tail of ubiquitin. The average volume was 304 s.d. 219 Å3. (G) Root mean square fluctuation (RMSF) of Cα atoms of the Ubc6 (teal) - ubiquitin (purple) complex. The solid line indicates the average of 100 × 1 μs simulations, the shaded area indicates the mean RMSF ± 2σ. (H) Contour plot showing the distribution of the χ1 (N-Cα-Cβ-Cγ) and χ2 (Cα-Cβ-Cγ-Nδ) dihedral angles of His94 with the ε-nitrogen protonated. Each contour level corresponds to 10% of the probability density. The inset plot shows the major configuration (χ1: -64° χ2: -84°). The ε-protonated nitrogen appears to be incompatible with His94 acting as a base, because its imidazole ring was largely confined to a conformation in which the free electron pair of the δ-nitrogen points away from the region from which a nucleophilic attack would occur. For visualization purposes, 200,000 random samples of the χ1 and χ2 values were calculated from the simulation data. Thereafter each sample was incremented by a value chosen at random from [-2π, 0, 2π]; this abrogated the hard boundaries at -π and π. The density was estimated from the resampled data using a Gaussian kernel density estimator. (I) Contour plot showing the distribution of the χ1 and χ2 dihedral angles of His94 with the δ-nitrogen protonated. Each contour level corresponds to 10% of the probability density. The inset plots depict the two major conformations (χ1: -64° χ2: -88°) and (χ1: -63° χ2: 109°), that appeared with similar frequencies. 52% of the structures adopted an Nε outward-facing orientation, 40% adopted the inward-facing orientation, compatible with a base function for His94. An additional conformation, accounting for 8% of the observed structures, exhibited a χ1 dihedral angle rotated by 180°. The histograms at the margins show the distributions of each dihedral angle. The dihedral angles were resampled as described in (H). (J) Exemplary time trace of the χ2 dihedral angles from simulations of the HisD tautomer. The inward and outward-facing conformations interconverted rapidly during simulations and are only separated by an energy barrier of approximately 1 kBT.
Figure EV3
Figure EV3. Reconstitution of Sbh2 ubiquitination.
(A) E1-mediated Ub loading of full-length WT Ubc6 is unaffected in the indicated mutants. Detergent solubilized WT Ubc6 or the indicated mutants were incubated with E1, Ub and ATP. Time course of E1-mediated loading of fluorescently labeled WT Ubc6 and mutants were analyzed by non-reducing SDS-PAGE and detected by fluorescence scanning. Values for each time point are shown as colored symbols connected by solid lines. (B) Time course of ubiquitination of Sbh2 4KR. Fluorescently labeled Sbh2 4KR was co-reconstituted with Doa10. In addition, the indicated E2s/cofactors were co-reconstituted. Samples were analyzed by SDS-PAGE and fluorescence scanning. The asterisk marks a band that appears upon co-reconstitution of Doa10 with fluorescently labeled Sbh2. It probably reflects a partially SDS-resistant complex of the two proteins. (C) Quantification of Sbh2 and Sbh2 4KR ubiquitination in the presence of Doa10 and either WT Ubc6 or Ubc6 mutants S89A and H94A. Data points and error bars indicate mean ± one standard deviation from three experiments. Black for WT Sbh2, yellow for Sbh2 4KR. Solid, dashed and dotted lines for WT Ubc6, Ubc6 S89A, and Ubc6 H94A, respectively. Data for WT Ubc6 is reproduced here from Fig. 4E. (D, E) Representative SDS-PAGE for determining NaOH-resistant and -sensitive Sbh2 ubiquitinations from reactions with either WT Sbh2, Sbh2 4KR, or Sbh2 4KS, co-reconstituted with Doa10 and either Ubc7/Cue1 (D) or the indicated Ubc6 version (E). Samples were collected after 1 h from reactions as in Fig. 4D. Where indicated, samples were treated with NaOH to preserve only lysine modifications. Reactions lacking ATP serve as controls. Samples were analyzed by SDS-PAGE and fluorescence scanning. As in (B), the asterisk marks a band that appears upon co-reconstitution of Doa10 with fluorescently labeled Sbh2. (F) Time course of Sbh2 ubiquitination in liposomes containing Sbh2, Doa10 and the H101Q mutant of the Ube2J2/Ubc6 chimera. Data for the non-mutated chimera is reproduced from Fig. 4J for comparison. For visualization, double-exponential fits to the data are shown as solid lines. N = 3.
Figure EV4
Figure EV4. Discharge of Ubc6-Ub and J2-Ub by small nucleophiles.
(A, B) Deconvoluted mass spectra of yeast ubiquitin (A) (mass 8551.5960 Da, reference 8551.5747 Da) and glycerol-ubiquitin (B) (mass 8625.6326 Da, reference 8625.6115 Da). The mass difference of 74 Da corresponds to the mass of glycerol minus one water molecule. (CF) Ubiquitin discharge assays of WT Ubc6 in the presence of the indicated concentrations of free amino acids. (C) Cysteine, (D) histidine, (E) N-acetyl-histidine, (F) N-acetyl-tyrosine (NAc-Tyr). The fraction of the loaded and discharged state were quantified by densitometry. In each panel, the data were globally fitted to determine rate constants for hydrolysis, and discharge by the indicated free amino acid. Fitting results are shown solid lines; the obtained values for histidine and NAc-Tyr are reported in Fig. 5E. (G) Deconvoluted mass spectrum of histidine-ubiquitin (mass 8688.6482 Da, reference 8688.6336 Da). (H, I) Bar plot comparing reactivity of the Ubc6 mutant E119A (H) or E119D (I) with WT Ubc6 towards the indicated nucleophiles. Discharge by hydrolysis is indicated as “H2O”. Rate constants of mutants for different nucleophiles were determined as in Fig. 5D and averages determined as described for Fig. 5E. Plotted are fold differences of WT/mutant discharge rates. N for the E119A mutant towards the nucleophiles “H2O”, serine, lysine, and histidine is three, two, one, and one, respectively. For the E119D it is three, three, one, and one, respectively. Error bars represent standards deviations as described for Fig. 5F–I. As only single measurements were performed in the presence of free histidine or lysine, these values have no error bars. (J) Boxplot comparing the root mean square fluctuation (RMSF) of the Ubc6118 - Ubc6124 loop between WT Ubc6 and the E119A and E119D mutants. The median and interquartile range between the 25th and 75th percentiles is shown by the boxed area. The center line shows the median. The whiskers extend to all data points within 1.5 times the interquartile range, while all additional points beyond this range are shown as dots. For each variant, 8 simulations were used to calculate the RMSF values of the 7 residues (n = 56). (K) Boxplot comparing the RMSF of the ubiquitin tail (residues 72-76) between WT Ubc6 and the mutants E119A and E119D. The structure of the boxplots is identical to (J). For each variant, 8 simulations were used to calculate the RMSF values of the 5 residues (n = 40). (L) Ubiquitin discharge assay with the UBC domain of human Ube2J2 in the presence of 50 mM of the indicated nucleophiles. Samples taken at the indicated time points were analyzed by non-reducing SDS-PAGE and stain-free imaging. Plots of fractions of Ub-loaded Ube2J2 were globally fitted. Fitting results are shown as solid lines and values are reported in Fig. 5M. (M) Pair-wise alignment of yeast Ubc6 and human Ube2J2 in the region covering the active site loop and the Thr-flap. Source data are available online for this figure.
Figure EV5
Figure EV5. RING-effect on Ubc6 and Ube2J2 activity.
(A) Full-length WT Doa10 is more reactive in Sbh2 ubiquitination than its CTE mutant. Fluorescently labeled Sbh2 was co-reconstituted with Ubc6 and either WT Doa10 or the Doa10 2CTM mutant (G1308L, N1314A). Proteoliposomes were incubated with 1 µM Uba1, 120 µM ubiquitin, and ATP. Samples taken at the indicated time points were analyzed by SDS-PAGE and fluorescence scanning. Indicated samples lacked ATP as a negative control. (B) Quantification of the fraction of unmodified Sbh2 from three experiments as in (A). Solid lines represent global double-exponential fits of the data. (C) Ubiquitin discharge assays performed with WT UBC domain of Ubc6 in the presence of 50 mM of the indicated free amino acids and the indicated Doa10 RING-CTE concentrations. Plots of the fraction of loaded Ubc6 were globally fitted to a mono-exponential function to determine apparent rate constants for hydrolysis and discharge by free amino acids. Solid lines represent fit results. Such data was used to generate the plot in Fig. 6D. (D) Autoubiquitination assay comparing full-length WT Ubc6 and its indicated Ser196 point mutants. A discharge assay with full-length Ubc6 was performed in the presence of the detergent n-dodecyl-β-D-maltoside. After the loading step, EDTA was added to quench E1 activity. Samples collected at indicated time points were analyzed by reducing (top) and non-reducing (bottom) SDS-PAGE and stain-free imaging. The asterisk indicates a band that probably arises from a small fraction of Ubc6-Ub that is autoubiquitinated and Ub-loaded, and that partially converts into a double autoubiquitinated species. (E) Quantification of (D). The fraction of autoubiquitinated Ubc6 was determined by densitometry from the reducing gel and normalized to the loaded fraction at t = 0, as determined from the non-reducing gel. (F) As in (D), but using the indicated fluorescently labeled Ubc6 variants. Samples were analyzed by SDS-PAGE and fluorescence scanning. (G) Quantification of (F), as described in (E).

References

    1. Abdul Rehman SA, Cazzaniga C, Di Nisio E, Antico O, Knebel A, Johnson C, Sahin AT, Ibrahim P, Lamoliatte F, Negri R et al (2024) Discovery and characterization of noncanonical E2-conjugating enzymes. Sci Adv 10:eadh0123 - PMC - PubMed
    1. Abraham MJ, Murtola T, Schulz R, Páll S, Smith JC, Hess B, Lindahl E (2015) GROMACS: High performance molecular simulations through multi-level parallelism from laptops to supercomputers. SoftwareX 1-2:19–25
    1. Afonine PV, Grosse-Kunstleve RW, Echols N, Headd JJ, Moriarty NW, Mustyakimov M, Terwilliger TC, Urzhumtsev A, Zwart PH, Adams PD (2012) Towards automated crystallographic structure refinement with phenix.refine. Acta Crystallogr D Biol Crystallogr 68:352–367 - PMC - PubMed
    1. Ahel J, Fletcher A, Grabarczyk DB, Roitinger E, Deszcz L, Lehner A, Virdee S, Clausen T (2021) E3 ubiquitin ligase RNF213 employs a non-canonical zinc finger active site and is allosterically regulated by ATP. Preprint at bioRxiv 10.1101/2021.1105.1110.443411
    1. Ahel J, Lehner A, Vogel A, Schleiffer A, Meinhart A, Haselbach D, Clausen T (2020) Moyamoya disease factor RNF213 is a giant E3 ligase with a dynein-like core and a distinct ubiquitin-transfer mechanism. eLife 9:e56185 - PMC - PubMed

MeSH terms

LinkOut - more resources