. 2024 Dec;43(24):6410-6443.
doi: 10.1038/s44318-024-00292-1. Epub 2024 Nov 12.

Calcium signaling from damaged lysosomes induces cytoprotective stress granules

Affiliations

Calcium signaling from damaged lysosomes induces cytoprotective stress granules

Jacob Duran et al. EMBO J. 2024 Dec.

Abstract

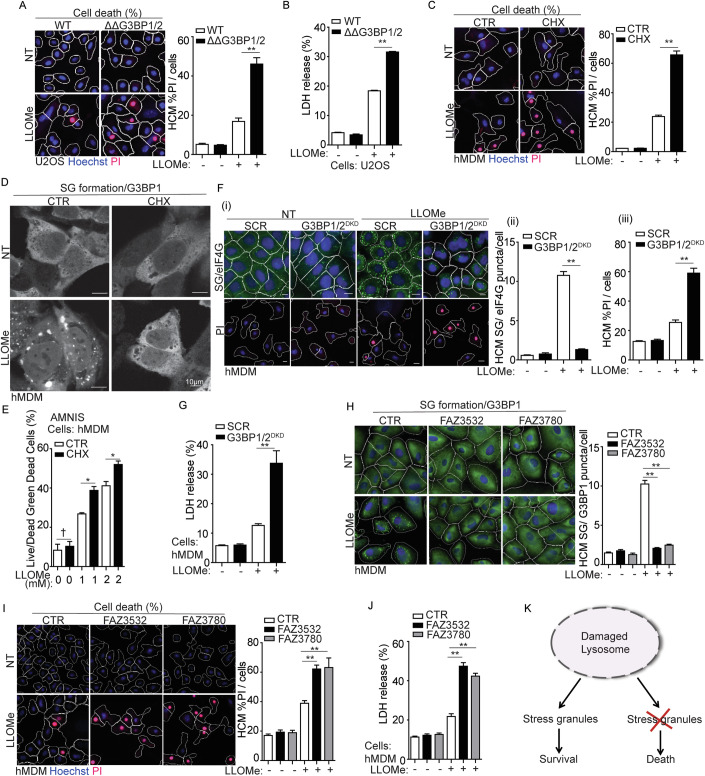
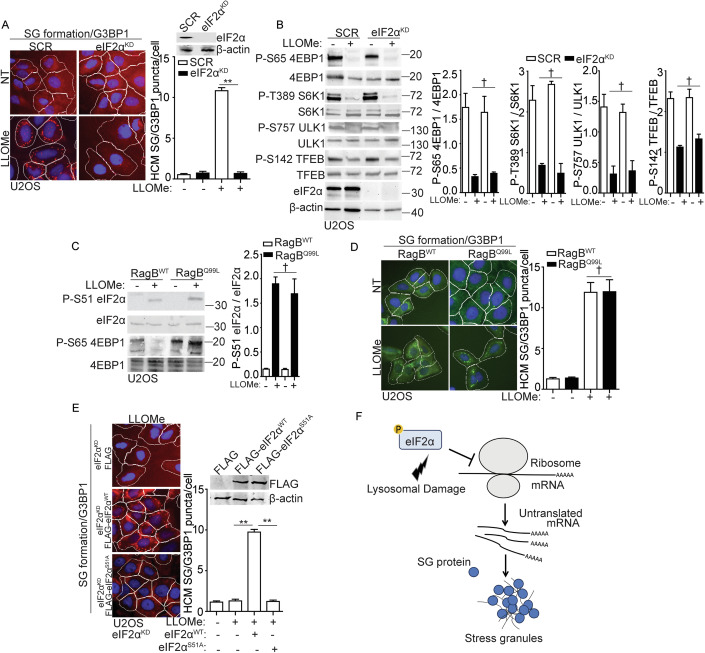
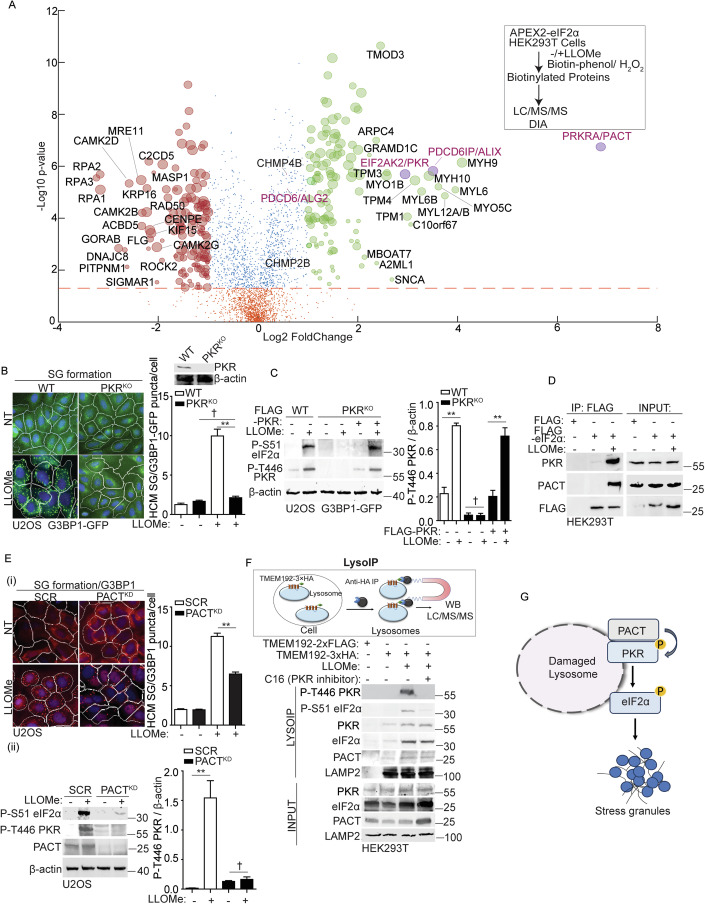
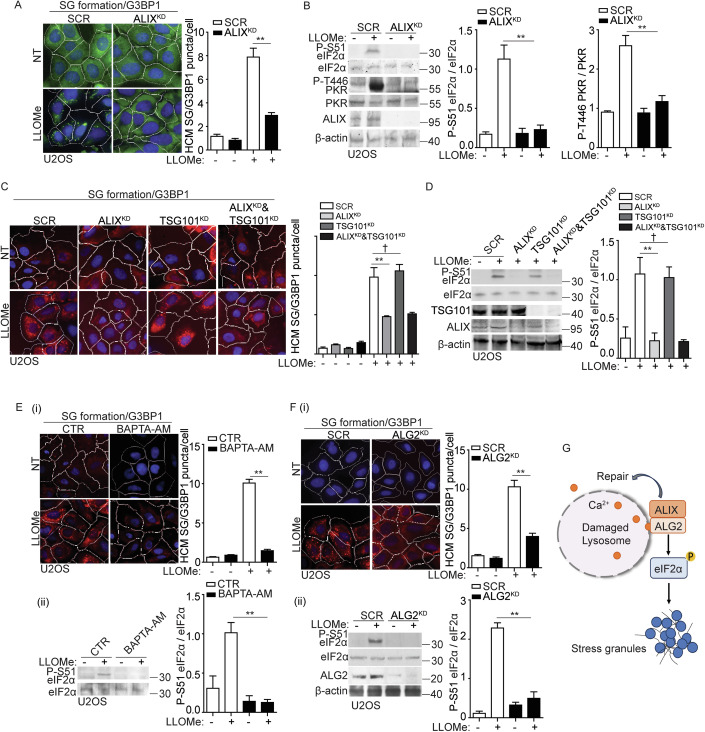
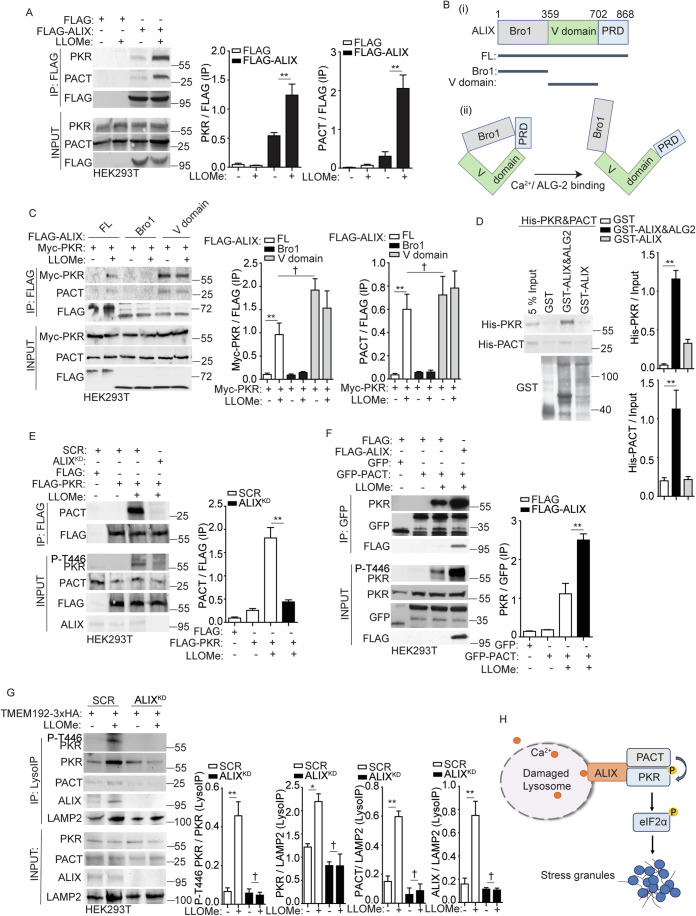
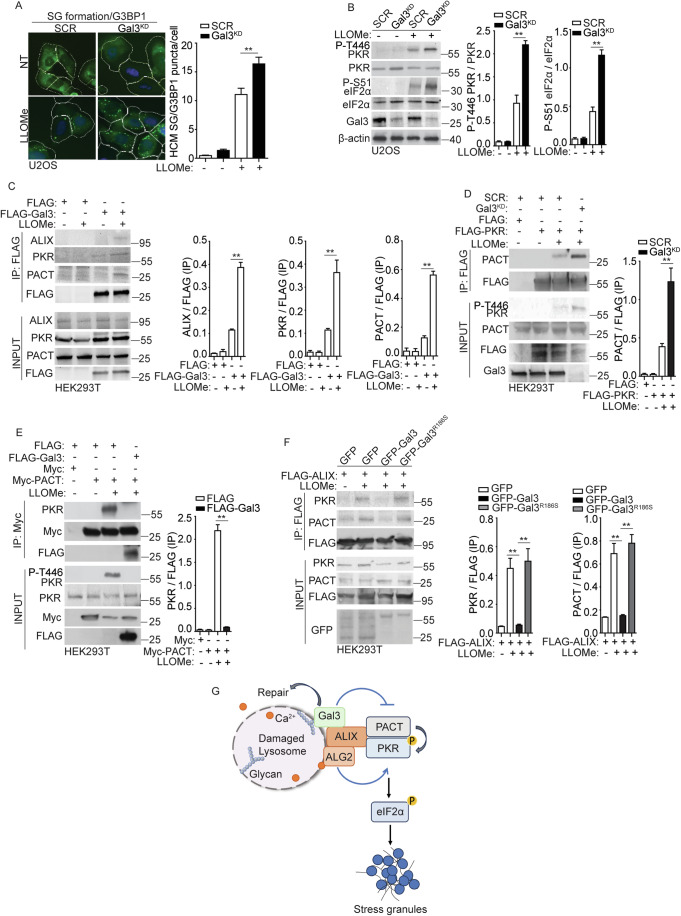
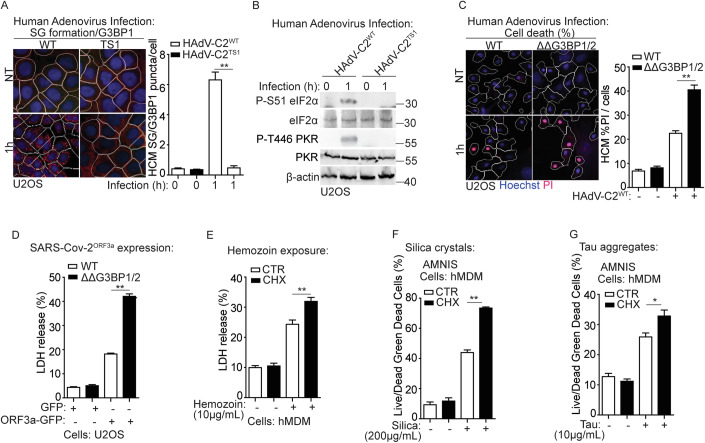
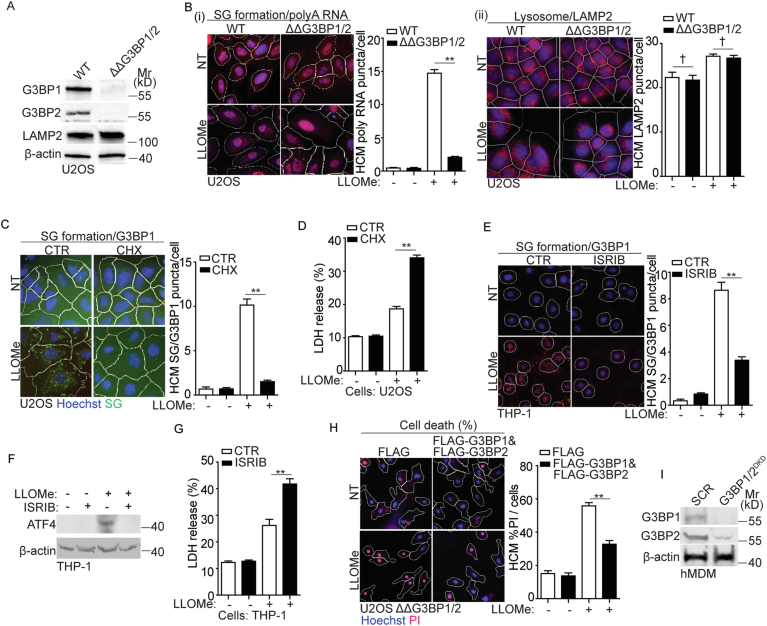
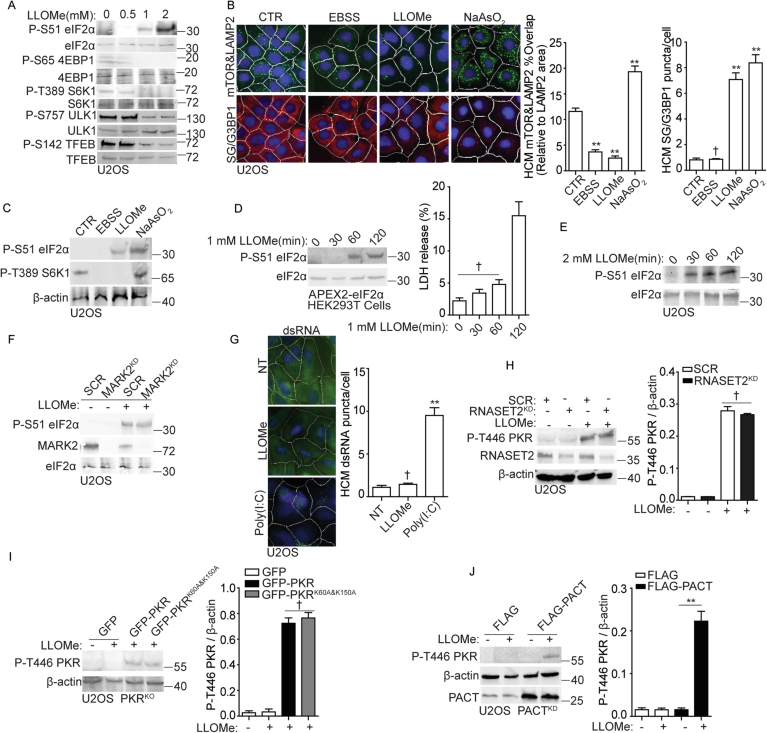
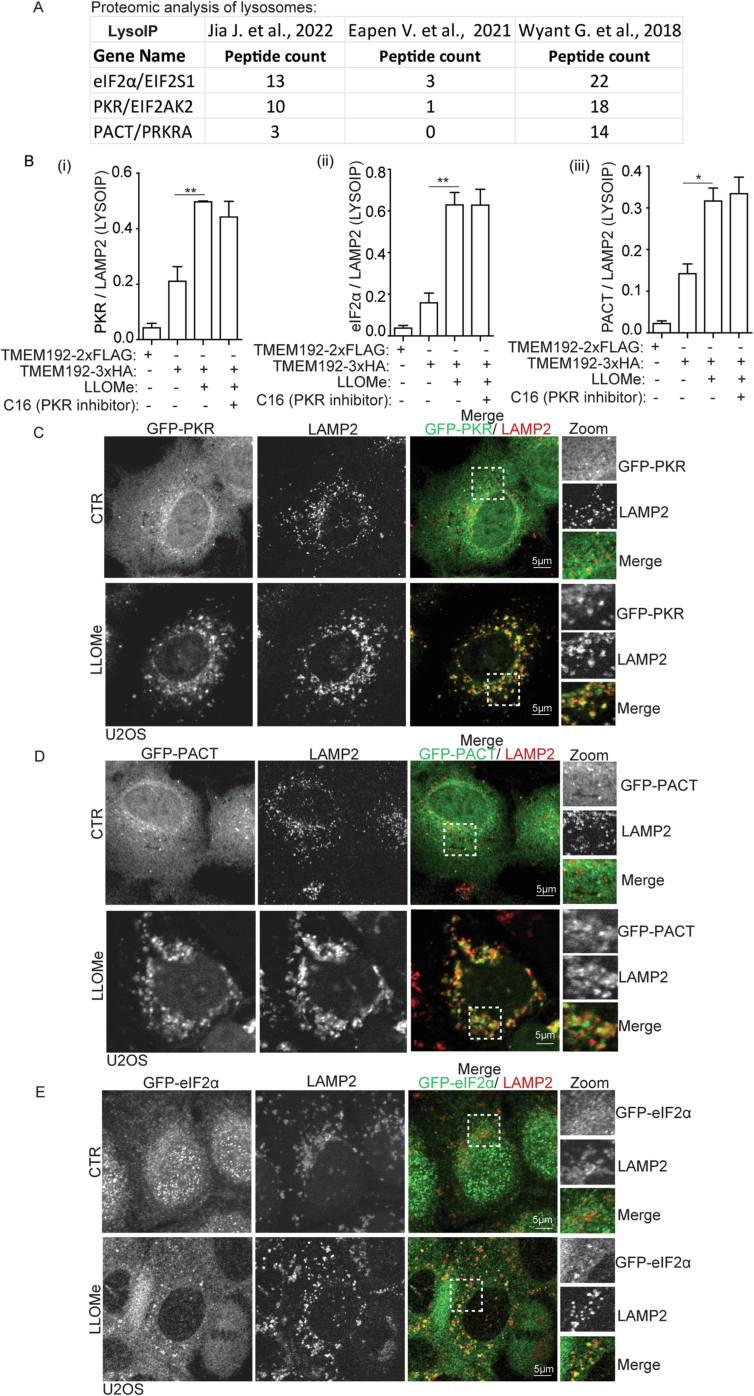
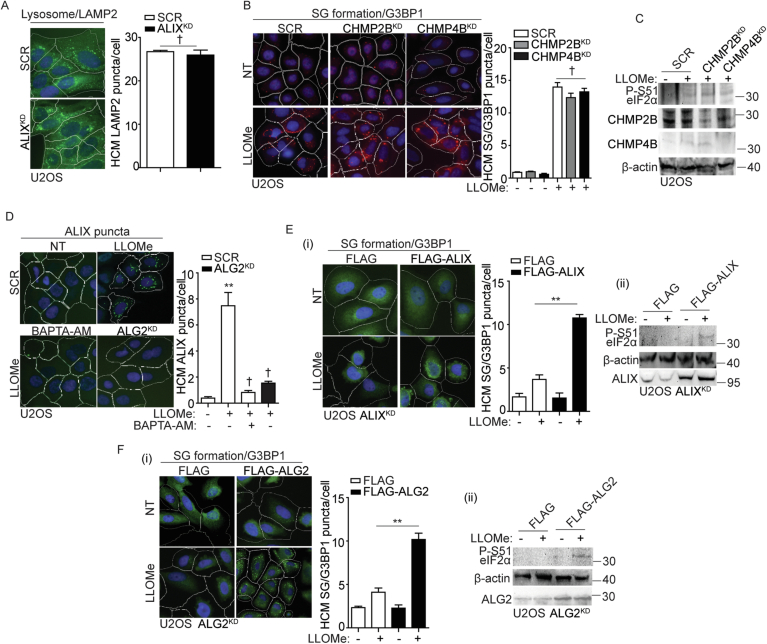
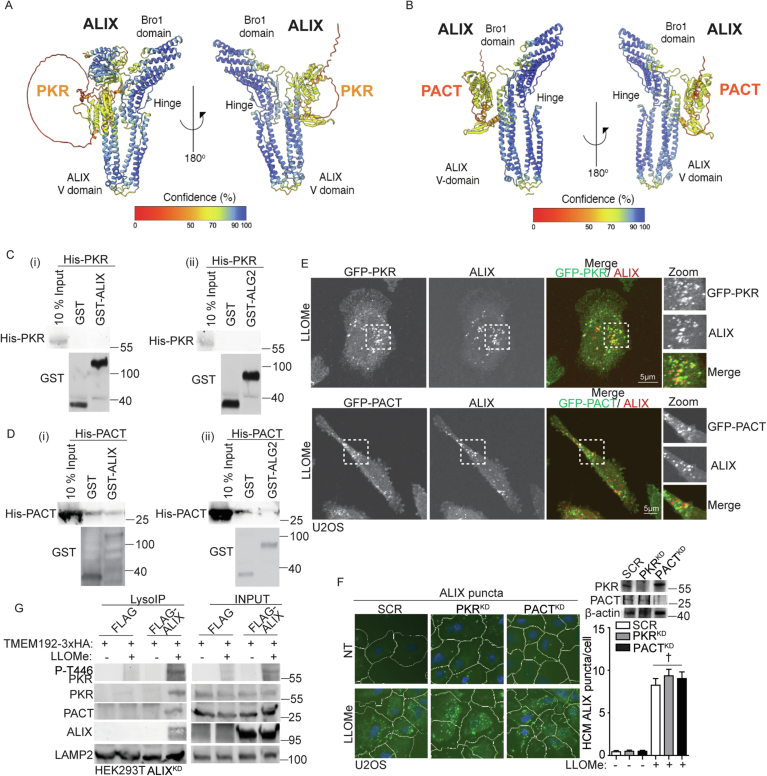
Lysosomal damage induces stress granule (SG) formation. However, the importance of SGs in determining cell fate and the precise mechanisms that mediate SG formation in response to lysosomal damage remain unclear. Here, we describe a novel calcium-dependent pathway controlling SG formation, which promotes cell survival during lysosomal damage. Mechanistically, the calcium-activated protein ALIX transduces lysosomal damage signals to SG formation by controlling eIF2α phosphorylation after sensing calcium leakage. ALIX enhances eIF2α phosphorylation by promoting the association between PKR and its activator PACT, with galectin-3 inhibiting this interaction; these regulatory events occur on damaged lysosomes. We further find that SG formation plays a crucial role in promoting cell survival upon lysosomal damage caused by factors such as SARS-CoV-2ORF3a, adenovirus, malarial pigment, proteopathic tau, or environmental hazards. Collectively, these data provide insights into the mechanism of SG formation upon lysosomal damage and implicate it in diseases associated with damaged lysosomes and SGs.

Keywords: ALG2-ALIX; Calcium-dependent Pathway; Lysosomal Damage; PACT-PKR-eIF2α; Stress Granules.


Conflict of interest statement

Disclosure and competing interests statement. The authors declare no competing interests.

Figures

Figure 1
Figure 1. Stress granule formation promotes cell survival in response to lysosomal damage.
(A) Quantification by high-content microscopy (HCM) of cell death by a propidium iodide (PI) uptake assay in U2OS wild type (WT) and G3BP1&2 double knockout (ΔΔG3BP1/2) cells. Cells were treated with 2 mM LLOMe for 30 min, and then stained with propidium iodide (PI) (dead cells) and Hoechst-33342 (total cells). White masks, algorithm-defined cell boundaries (primary objects); red masks, computer-identified PI+ nuclei (target objects). (B) Cell death analysis of supernatants of U2OS WT and ΔΔG3BP1/2 cells by a LDH release assay. Cells were treated with 2 mM LLOMe for 30 min. (C) Quantification by HCM of cell death by a PI uptake assay in human peripheral blood monocyte-derived macrophages (hMDM). Cells were treated with 2 mM LLOMe in the presence or absence of 10 μg/ml cycloheximide (CHX) for 30 min, and then stained with PI (dead cells) and Hoechst-33342 (total cells). (D) Confocal microscopy analysis of G3BP1 (Alexa Fluor 488) in hMDM treated with 2 mM LLOMe with or without CHX for 30 min. Scale bar, 10 μm. (E) Quantification using AMNIS of cell death by Live/DeadTM stain kit in hMDM. Cells were treated with 2 mM LLOMe with or without CHX for 30 min, and then stained using Live/DeadTM stain kit (ThermoFisher). (F) Quantification by HCM of cell death by a PI uptake assay and SG formation by eIF4G in hMDM transfected with scrambled siRNA as control (SCR) or G3BP1 and G3BP2 siRNA for double knockdown (DKD). Cells were treated with 2 mM LLOMe for 30 min, and then stained with PI (dead cells), Hoechst-33342 (total cells) or eIF4G. (i) HCM images: white masks, algorithm-defined cell boundaries; green masks, computer-identified eIF4G puncta; red masks, computer-identified PI+ nuclei (target objects); (ii and iii) corresponding HCM quantification. Scale bar, 10 μm. (G) Cell death analysis of supernatants of hMDM transfected with either scrambled siRNA as control (SCR) or G3BP1 and G3BP2 siRNA for double knockdown (DKD) using a LDH release assay. Cells were treated with 2 mM LLOMe for 30 min. (H) Quantification by HCM of SG formation by G3BP1 in hMDM treated with 20 µM FAZ3532 or 20 µM FAZ3780 for 20 min, followed by exposure to 2 mM LLOMe for 30 min. Control cells were treated with DMSO. Green masks, computer-identified G3BP1 puncta. (I) Quantification by HCM of cell death by a PI uptake assay in hMDM treated with 20 µM FAZ3532 or 20 µM FAZ3780 for 20 min, followed by exposure to 2 mM LLOMe for 30 min. Control cells were treated with DMSO. Red masks, computer-identified PI+ nuclei. (J) Cell death analysis of supernatants of hMDM treated with 20 µM FAZ3532 or 20 µM FAZ3780 for 20 min, followed by exposure to 2 mM LLOMe for 30 min using a LDH release assay. Control cells were treated with DMSO. (K) Schematic summary of the findings in Fig. 1 and EV1. CTR, control; NT, untreated cells. Data, means ± SEM (n = 3); HCM: n ≥ 3 (each experiment: 500 valid primary objects/cells per well, ≥5 wells/sample). †p ≥ 0.05 (not significant), *p < 0.05, **p < 0.01, ANOVA. See also Fig. EV1. Source data are available online for this figure.
Figure 2
Figure 2. Stress granule formation is controlled by eIF2α pathway but not mTORC1 pathway during lysosomal damage.
(A) Quantification by HCM of G3BP1 puncta in U2OS cells transfected with either scrambled siRNA as control (SCR) or eIF2α siRNA for knockdown (eIF2αKD). Cells were treated with 2 mM LLOMe for 30 min. White masks, algorithm-defined cell boundaries; red masks, computer-identified G3BP1 puncta. (B) Immunoblot analysis of mTORC1 activity by phosphorylation of 4EBP1 (Ser65), S6K (Thr389), ULK1 (Ser757), and TFEB (Ser142) in U2OS cells transfected with either scrambled siRNA as control (SCR) or eIF2α siRNA for knockdown (eIF2αKD). Cells were treated with 2 mM LLOMe for 30 min. Quantification is based on three independent experiments. (C) Immunoblot analysis of phosphorylation of eIF2α (S51) in U2OS cells overexpressing wild-type RagB (RagBWT) or constitutively active RagB mutant (RagBQ99L) treated with 2 mM LLOMe for 30 min. Quantification is based on three independent experiments. (D) Quantification by HCM of G3BP1 puncta in U2OS cells overexpressing wild-type RagB (RagBWT) or constitutively active RagB mutant (RagBQ99L). Cells were treated with 2 mM LLOMe for 30 min. White masks, algorithm-defined cell boundaries; green masks, computer-identified G3BP1 puncta. (E) Quantification by HCM of G3BP1 puncta in eIF2α knockdown (eIF2αKD) U2OS cells transfected with FLAG, FLAG- eIF2αWT or FLAG- eIF2αS51A. Cells were treated with 2 Mm LLOMe for 30 min. White masks, algorithm-defined cell boundaries; red masks, computer-identified G3BP1 puncta. (F) Schematic summary of the findings in Figs. 2 and EV2. NT, untreated cells. Data, means ± SEM (n = 3); HCM: n ≥ 3 (each experiment: 500 valid primary objects/cells per well, ≥5 wells/sample). †p ≥ 0.05 (not significant), **p < 0.01, ANOVA. See also Fig. EV2. Source data are available online for this figure.
Figure 3
Figure 3. PKR and its activator PACT regulate eIF2α phosphorylation on damaged lysosomes.
(A) Quantitative liquid chromatography-tandem mass spectrometry (LC/MS/MS) using the data-independent acquisition (DIA) technique to identify eIF2α binding partners that were proximity-biotinylated by APEX2-eIF2α during lysosomal damage (1 mM LLOMe for 1 h). Scatter (volcano) plot shows log2 fold change (LLOMe/CTR; spectral counts) and –log10 p value for the proteins identified and quantified in three independent experiments. Green dots indicate increase in proximity to eIF2α (log2 fold change ≥ 1), and red dots indicate decrease in proximity to eIF2α (log2 fold change ≤ −1) during LLOMe treatment. Orange dots indicate values below the statistical significance cut-off (P ≥ 0.05). Bubble size represents a normalized value for the total amount of spectral counts for the protein indicated. PACT, PKR and ALIX proteins are highlighted as purple circles (see Dataset EV1). (B) Quantification by HCM of G3BP1-GFP puncta in wild type (WT) or PKR knockout (PKRKO) U2OS G3BP1-GFP cells. Cells were treated with 2 mM LLOMe for 30 min. White masks, algorithm-defined cell boundaries; green masks, computer-identified G3BP1 puncta. (C) Immunoblot analysis of phosphorylation of eIF2α (S51) and PKR (T446) in WT or PKRKO U2OS G3BP1-GFP cells, as well as in cells overexpressing FLAG-PKR in PKRKO U2OS G3BP1-GFP cells. Cells were treated with 2 mM LLOMe for 30 min. The level of phosphorylation of PKR (T446) was quantified based on three independent experiments. (D) Co-IP analysis of interactions between eIF2α and PKR/PACT during lysosomal damage. HEK293T cells expressing FLAG (control) or FLAG-eIF2α were treated with 1 mM LLOMe for 30 min. Cell lysates were immunoprecipitated with anti-FLAG antibody and immunoblotted for indicated proteins. (E) (i) Quantification by HCM of G3BP1 puncta in U2OS cells transfected with either scrambled siRNA as control (SCR) or PACT siRNA for knockdown (PACTKD). Cells were treated with 2 mM LLOMe for 30 min. White masks, algorithm-defined cell boundaries; red masks, computer-identified G3BP1 puncta; (ii) Immunoblot analysis of phosphorylation of eIF2α (S51) and PKR (T446) in SCR or PACTKD cells; 2 mM LLOMe for 30 min. The level of phosphorylation of PKR (T446) was quantified based on three independent experiments. (F) Analysis of proteins associated with purified lysosomes (LysoIP; TMEM192-3xHA) from HEK293T cells treated with 1 mM LLOMe in the presence or absence of 210 nM imidazolo-oxindole C16 for 1 h. TMEM192-2xFLAG, control. The level of PKR, eIF2α and PACT in LysoIP was quantified based on three independent experiments shown in Fig. EV3B. (G) Schematic summary of the findings in Figs. 3 and EV3. NT, untreated cells. Data, means ± SEM (n = 3); HCM: n ≥ 3 (each experiment: 500 valid primary objects/cells per well, ≥5 wells/sample). †p ≥ 0.05 (not significant), **p < 0.01, ANOVA. See also Fig. EV3.  Source data are available online for this figure.
Figure 4
Figure 4. ALIX and ALG2 are required for stress granule formation by sensing calcium release from damaged lysosomes.
(A) Quantification by HCM of G3BP1 puncta in U2OS cells transfected with either scrambled siRNA as control (SCR) or ALIX siRNA for knockdown (ALIXKD). Cells were treated with 2 mM LLOMe for 30 min. White masks, algorithm-defined cell boundaries; green masks, computer-identified G3BP1 puncta. (B) Immunoblot analysis of phosphorylation of eIF2α (S51) and PKR (T446) in U2OS cells transfected with either scrambled siRNA as control (SCR) or ALIX siRNA for knockdown (ALIXKD). Cells were treated with 2 mM LLOMe for 30 min. The level of phosphorylation of eIF2α (S51) and PKR (T446) was quantified based on three independent experiments. (C) Quantification by HCM of G3BP1 puncta in U2OS cells transfected with scrambled siRNA as control (SCR), ALIX siRNA for knockdown (ALIXKD) or TSG101 siRNA for knockdown (TSG101KD). Cells were treated with 2 mM LLOMe for 30 min. White masks, algorithm-defined cell boundaries; red masks, computer-identified G3BP1 puncta. (D) Immunoblot analysis of phosphorylation of eIF2α (S51) in U2OS cells transfected with scrambled siRNA as control (SCR), ALIX siRNA for knockdown (ALIXKD) or TSG101 siRNA for knockdown (TSG101KD). Cells were treated with 2 mM LLOMe for 30 min. The level of phosphorylation of eIF2α (S51) was quantified based on three independent experiments. (E) (i) Quantification by HCM of G3BP1 puncta in U2OS cells pre-treated with 15 µM BAPTA-AM for 1 h, subjected to 2 mM LLOMe treatment for 30 min. White masks, algorithm-defined cell boundaries; red masks, computer-identified G3BP1 puncta. (ii) Immunoblot analysis of phosphorylation of eIF2α (S51) in U2OS cells as described in (i) and was quantified based on three independent experiments. (F) (i) Quantification by HCM of G3BP1 puncta in U2OS cells transfected with scrambled siRNA as control (SCR), or ALG2 siRNA for knockdown (ALG2KD). Cells were treated with 2 mM LLOMe for 30 min. White masks, algorithm-defined cell boundaries; red masks, computer-identified G3BP1 puncta. (ii) Immunoblot analysis of phosphorylation of eIF2α (S51) in U2OS cells as described in (i) and was quantified based on three independent experiments. (G) Schematic summary of the findings in Figs. 4 and EV4. NT, untreated cells. CTR, control. Data, means ± SEM (n = 3); HCM: n ≥ 3 (each experiment: 500 valid primary objects/cells per well, ≥5 wells/sample). †p ≥ 0.05 (not significant), **p < 0.01, ANOVA. See also Fig. EV4. Source data are available online for this figure.
Figure 5
Figure 5. ALIX promotes the association between PKR and its activator PACT on damaged lysosomes.
(A) Co-IP analysis of interactions among ALIX, PKR and PACT during lysosomal damage. HEK293T cells expressing FLAG (control) or FLAG-ALIX were treated with 1 mM LLOMe for 30 min. Cell lysates were immunoprecipitated with anti-FLAG antibody and immunoblotted for indicated proteins. Quantification of IP analysis based on three independent experiments. (B) (i) Schematic diagram of ALIX mutants used in this study. FL (full length); Bro1 (Bro1 domain); V domain; PRD (proline-rich domain). Numbers, residue positions. (ii) Schematic illustration of the Ca2+/ALG-2-induced open conformation of ALIX. (C) Co-IP analysis of interactions among ALIX mutants, PKR and PACT during lysosomal damage. HEK293T cells expressing FLAG tagged ALIX mutants and Myc-PKR were treated with 1 mM LLOMe for 30 min. Cell lysates were immunoprecipitated with anti-FLAG antibody and immunoblotted for indicated proteins. Quantification of IP analysis based on three independent experiments. (D) GST pulldown assay of in vitro translated His-tagged PKR and His-tagged PACT with GST, GST-tagged ALIX, with or without GST-tagged ALG2 in the presence of 10 μM CaCl2. Quantification of the GST pulldown (the corresponding protein relative to its input) was performed based on three independent experiments. (E) Co-IP analysis of interactions between FLAG-PKR and PACT in HEK293T cells transfected with scrambled siRNA as control (SCR), or ALIX siRNA for knockdown (ALIXKD) during lysosomal damage. Cells were treated with 1 mM LLOMe for 30 min. Cell lysates were immunoprecipitated with anti-FLAG antibody and immunoblotted for indicated proteins. Quantification of IP analysis based on three independent experiments. (F) Co-IP analysis of interactions between PKR and GFP-PACT in HEK293T cells transfected with FLAG, or FLAG-ALIX during lysosomal damage. Cells were treated with 1 mM LLOMe for 30 min. Cell lysates were immunoprecipitated with anti-GFP antibody and immunoblotted for indicated proteins. Quantification of IP analysis based on three independent experiments. (G) Analysis of proteins associated with purified lysosomes (LysoIP; TMEM192-3xHA) from HEK293T cells transfected with scrambled siRNA as control (SCR), or ALIX siRNA for knockdown (ALIXKD). Cells were treated with 1 mM LLOMe for 30 min. Quantification of LysoIP analysis based on three independent experiments. (H) Schematic summary of the findings in Figs. 5 and EV5. See also Fig. EV5. †p ≥ 0.05 (not significant), *p < 0.05, **p < 0.01, ANOVA. Source data are available online for this figure.
Figure 6
Figure 6. Galectin-3 inhibits stress granule formation by reducing the association between PKR and PACT during lysosomal damage.
(A) Quantification by HCM of G3BP1 puncta in U2OS cells transfected with scrambled siRNA as control (SCR), or galectin-3 (Gal3) siRNA for knockdown (Gal3KD). Cells were treated with 2 mM LLOMe for 30 min. White masks, algorithm-defined cell boundaries; green masks, computer-identified G3BP1 puncta. (B) Immunoblot analysis of phosphorylation of eIF2α (S51) and PKR (T446) in U2OS cells transfected with scrambled siRNA as control (SCR), or galectin-3 (Gal3) siRNA for knockdown (Gal3KD), subjected to 2 mM LLOMe treatment for 30 min. The level of phosphorylation of eIF2α (S51) and PKR (T446) was quantified based on three independent experiments. (C) Co-IP analysis of interactions among FLAG-Gal3, ALIX, PKR and PACT in HEK293T cells during lysosomal damage. Cells were treated with 1 mM LLOMe for 30 min. Cell lysates were immunoprecipitated with anti-FLAG antibody and immunoblotted for indicated proteins. Quantification of IP analysis for ALIX, PKR, and PACT based on three independent experiments. (D) Co-IP analysis of interactions between FLAG-PKR and PACT in HEK293T cells transfected with scrambled siRNA as control (SCR), or Gal3 siRNA for knockdown (Gal3KD) during lysosomal damage. Cells were treated with 1 mM LLOMe for 30 min. Cell lysates were immunoprecipitated with anti-FLAG antibody and immunoblotted for indicated proteins. Quantification of IP analysis based on three independent experiments. (E) Co-IP analysis of interactions between Myc-PACT and PKR in HEK293T cells transfected with FLAG, or FLAG-Gal3 during lysosomal damage. Cells were treated with 1 mM LLOMe for 30 min. Cell lysates were immunoprecipitated with anti-Myc antibody and immunoblotted for indicated proteins. Quantification of IP analysis based on three independent experiments. (F) Co-IP analysis of interactions among FLAG-ALIX, PKR and PACT in HEK293T cells transfected with GFP, GFP-Gal3 or GFP-Gal3R186S during lysosomal damage. Cells were treated with 1 mM LLOMe for 30 min. Cell lysates were immunoprecipitated with anti-FLAG antibody and immunoblotted for indicated proteins. Quantification of IP analysis based on three independent experiments. (G) Schematic summary of the findings in Fig. 6. NT, untreated cells. Data, means ± SEM (n = 3); HCM: n ≥ 3 (each experiment: 500 valid primary objects/cells per well, ≥5 wells/sample). **p < 0.01, ANOVA. Source data are available online for this figure.
Figure 7
Figure 7. Stress granule formation promotes cell survival in response to lysosomal damage during disease states.
(A) Quantification by HCM of G3BP1 puncta in U2OS cells infected with wild-type human adenovirus C2 (HAdV-C2WT) or C2 TS1 mutant (HAdV-C2TS1) at MOI = 10 for 1 h. White masks, algorithm-defined cell boundaries; red masks, computer-identified G3BP1 puncta. (B) Immunoblot analysis of phosphorylation of eIF2α (S51) and PKR (T446) in U2OS cells infected with wild type human adenovirus C2 (HAdV-C2WT) or C2 TS1 mutant (HAdV-C2TS1) at MOI = 10 for 1 h. (C) Quantification by HCM of cell death by a propidium iodide (PI) uptake assay in U2OS wild type (WT) and G3BP1&2 double knockout (ΔΔG3BP1/2) cells during adenovirus infection. Cells were infected with wild-type human adenovirus C2 (HAdV-C2WT) at MOI = 10 for 1 h, and then stained with propidium iodide PI (dead cells) and Hoechst-33342 (total cells). White masks, algorithm-defined cell boundaries; red masks, computer-identified PI+ nuclei. (D) Cell death analysis of supernatants of U2OS WT and ΔΔG3BP1/2 cells by a LDH release assay during SARS-Cov-2ORF3a expression. Cells were transfected with the GFP-SARS-Cov-2ORF3a construct overnight. (E) Cell death analysis of supernatants of human peripheral blood monocyte-derived macrophages (hMDM) by a LDH release assay during hemozoin exposure. Cells were treated with 10 µg/ml hemozoin for 4 h in the presence or absence of 1 μg/ml cycloheximide (CHX). (F) Quantification using AMNIS of cell death by Live/DeadTM stain kit in hMDM during silica treatment. Cells were treated with 200 µg/mL silica for 4 h in the presence or absence of 1 μg/ml cycloheximide (CHX), and then stained using Live/DeadTM stain kit (ThermoFisher). (G) Quantification using AMNIS of cell death by Live/DeadTM stain kit in hMDM during the treatment of tau oligomer. Cells were treated with 10 µg/mL tau oligomer for 4 h in the presence or absence of 1 μg/ml cycloheximide (CHX), and then stained using Live/DeadTM stain kit (ThermoFisher). CTR, control. Data, means ± SEM (n = 3); HCM: n ≥ 3 (each experiment: 500 valid primary objects/cells per well, ≥5 wells/sample). *p < 0.05, **p < 0.01, ANOVA. See also Appendix Fig. S1. Source data are available online for this figure.
Figure EV1
Figure EV1. Stress granule formation is important for cell survival during lysosomal damage.
(A) Immunoblot analysis of G3BP1 and G3BP2 in U2OS WT and ΔΔG3BP1/2 cells. (B) Quantification by high-content microscopy (HCM) of polyA RNA (Cy3-oligo[dT]) by FISH (i) and LAMP2 (ii) in U2OS WT and ΔΔG3BP1/2 cells. Cells were treated with 2 mM LLOMe for 30 min. White masks, algorithm-defined cell boundaries (primary objects); red masks, computer-identified polyA RNA or LAMP2 puncta respectively (target objects). (C) Quantification by HCM of G3BP1 puncta in U2OS cells. Cells were treated with 2 mM LLOMe in the presence or absence of 10 μg/ml cycloheximide (CHX) for 30 min. White masks, algorithm-defined cell boundaries; green masks, computer-identified G3BP1 puncta. (D) Cell death analysis of supernatants of U2OS cells by a LDH release assay. Cells were treated with 2 mM LLOMe in the presence or absence of 10 μg/ml CHX for 30 min. (E) Quantification by HCM of G3BP1 puncta in human monocytic THP-1 cells. Cells were treated with 1 mM LLOMe in the presence or absence of 200 nM ISRIB for 30 min. White masks, algorithm-defined cell boundaries; red masks, computer-identified G3BP1 puncta. (F) Immunoblot analysis of ATF4 in THP-1 cells treated with 1 mM LLOMe in the presence or absence of 200 nM ISRIB for 30 min. (G) Cell death analysis of supernatants of THP-1 cells by a LDH release assay. Cells were treated with 1 mM LLOMe in the presence or absence of 200 nM ISRIB for 30 min. (H) Quantification of cell death by HCM using a propidium iodide (PI) uptake assay in U2OS G3BP1&2 double knockout (ΔΔG3BP1/2) cells overexpressing either FLAG or FLAG-G3BP1 & FLAG-G3BP2. Cells were treated with 2 mM LLOMe for 30 min, and then stained with propidium iodide (PI) (dead cells) and Hoechst-33342 (total cells). White masks, algorithm-defined cell boundaries; red masks, computer-identified PI+ nuclei. (I) Immunoblot analysis of the protein level of G3BP1 and G3BP2 in hMDM transfected with scrambled siRNA as control (SCR) or G3BP1 and G3BP2 siRNA for double knockdown (DKD). CTR, control; NT, untreated cells. Data, means ± SEM (n = 3); HCM: n ≥ 3 (each experiment: 500 valid primary objects/cells per well, ≥5 wells/sample). †p ≥ 0.05 (not significant), **p < 0.01, ANOVA. See also Fig. 1.
Figure EV2
Figure EV2. PACT-PKR- eIF2α pathway controls stress granule formation in response to lysosomal damage.
(A) Immunoblot analysis of phosphorylation of eIF2α (S51), 4EBP1 (Ser65), S6K (Thr389), ULK1 (Ser757) and TFEB (Ser142) in U2OS cells treated with the indicated dose of LLOMe for 30 min. (B) Quantification by HCM of overlaps between mTOR and LAMP2 or G3BP1 puncta in U2OS cells. Cells were treated with EBSS, 2 mM LLOMe or 100 µM NaAsO2 for 30 min. White masks, algorithm-defined cell boundaries; green masks, computer-identified overlap between mTOR and LAMP2; red masks, computer-identified G3BP1 puncta. (C) Immunoblot analysis of phosphorylation of eIF2α (S51) and S6K1 (T389) in U2OS cells treated as in (B). (D) Immunoblot analysis of phosphorylation of eIF2α (S51) and cell death analysis by a LDH release assay in HEK293T cells expressing APEX2-eIF2α. Cells were treated with 1 mM LLOMe for the indicated durations. (E) Immunoblot analysis of phosphorylation of eIF2α (S51) in U2OS cells. Cells were treated with 2 mM LLOMe for the indicated durations. (F) Immunoblot analysis of phosphorylation of eIF2α (S51) in U2OS cells transfected with either scrambled siRNA as control (SCR) or MARK2 siRNA for knockdown (MARK2KD). Cells were treated with 2 mM LLOMe for 30 min. (G) Quantification by HCM of dsRNA puncta in U2OS cells. Cells were treated with 2 mM LLOMe or 100 ng/mL Poly (I:C) for 30 min. Green masks, computer-identified dsRNA puncta. (H) Immunoblot analysis of phosphorylation of PKR (T446) in U2OS cells transfected with either scrambled siRNA as control (SCR) or RNASET2 siRNA for knockdown (RNASET2KD). Cells were treated with 2 mM LLOMe for 30 min. The level of phosphorylation of PKR (T446) was quantified based on three independent experiments. (I) Immunoblot analysis of phosphorylation of PKR (T446) in PKRKO U2OS G3BP1-GFP cells, overexpressing GFP, GFP-PKR and GFP-PKRK60A&K150A. Cells were treated with 2 mM LLOMe for 30 min. The level of phosphorylation of PKR (T446) was quantified based on three independent experiments. (J) Immunoblot analysis of phosphorylation of PKR (T446) in U2OS PACT knockdown cells (PACTKD) overexpressing FLAG or FLAG-PACT. Cells were treated with 2 mM LLOMe for 30 min. The level of phosphorylation of PKR (T446) was quantified based on three independent experiments. CTR, control. Data, means ± SEM (n = 3); HCM: n ≥ 3 (each experiment: 500 valid primary objects/cells per well, ≥5 wells/sample). †p ≥ 0.05 (not significant), **p < 0.01, ANOVA. See also Figs. 2 and 3.
Figure EV3
Figure EV3. PKR, PACT and eIF2α are associated with damaged lysosomes.
(A) Summary of the literature on the detected peptide count of PKR, PACT and eIF2α in the proteomic analysis of lysosomes based on LysoIP LC/MS/MS analysis. (B) Quantification of Fig. 3F; the level of PKR, eIF2α and PACT in LysoIP was quantified based on three independent experiments. (C) Confocal microscopy imaging of GFP-PKR and LAMP2 in U2OS cells treated with 2 mM LLOMe for 30 min. Scale bar, 5 μm. (D) Confocal microscopy imaging of GFP-PACT and LAMP2 in U2OS cells treated with 2 mM LLOMe for 30 min. Scale bar, 5 μm. (E) Confocal microscopy imaging of GFP-eIF2α and LAMP2 in U2OS cells treated with 2 mM LLOMe for 30 min. Scale bar, 5 μm. *p < 0.05, **p < 0.01, ANOVA. See also Fig. 3.
Figure EV4
Figure EV4. ALIX regulates stress granule formation during lysosomal damage.
(A) Quantification by HCM of LAMP2 in U2OS cells transfected with scrambled siRNA as control (SCR), or ALIX siRNA for knockdown (ALIXKD). White masks, algorithm-defined cell boundaries; green masks, computer-identified LAMP2 puncta. (B) Quantification by HCM of G3BP1 puncta in U2OS cells transfected with scrambled siRNA as control (SCR), CHMP2B siRNA for knockdown (CHMP2BKD) or CHMP4B siRNA for knockdown (CHMP4BKD). Cells were treated with 2 mM LLOMe for 30 min. White masks, algorithm-defined cell boundaries; red masks, computer-identified G3BP1 puncta. (C) Immunoblot analysis of phosphorylation of eIF2α (S51) in U2OS transfected with scrambled siRNA as control (SCR), CHMP2B siRNA for knockdown (CHMP2BKD) or CHMP4B siRNA for knockdown (CHMP4BKD), subjected to 2 mM LLOMe treatment for 30 min. (D) Quantification by HCM of ALIX puncta in U2OS cells transfected with scrambled siRNA as control (SCR), or ALG2 siRNA for knockdown (ALG2KD), or pre-treated with 15 µM BAPTA-AM for 1 h. Cells were treated with 2 mM LLOMe for 30 min. White masks, algorithm-defined cell boundaries; green masks, computer-identified ALIX puncta. (E) (i) Quantification by HCM of G3BP1 puncta in U2OS ALIX knockdown cells (ALIXKD) overexpressing FLAG or FLAG-ALIX. Cells were treated with 2 mM LLOMe for 30 min. White masks, algorithm-defined cell boundaries; green masks, computer-identified G3BP1 puncta. (ii) Immunoblot analysis of phosphorylation of eIF2α (S51) in U2OS cells as described in (i). (F) (i) Quantification by HCM of G3BP1 puncta in U2OS ALG2 knockdown cells (ALG2KD) overexpressing FLAG or FLAG-ALG2. Cells were treated with 2 mM LLOMe for 30 min. White masks, algorithm-defined cell boundaries; green masks, computer-identified G3BP1 puncta. (ii) Immunoblot analysis of phosphorylation of eIF2α (S51) in U2OS cells as described in (i). NT, untreated cells. Data, means ± SEM (n = 3); HCM: n ≥ 3 (each experiment: 500 valid primary objects/cells per well, ≥5 wells/sample). †p ≥ 0.05 (not significant), **p < 0.01, ANOVA. See also Fig. 4.
Figure EV5
Figure EV5. PKR and PACT associate with ALIX during lysosomal damage.
(A) AlphaFold 2 predicted the interaction between PKR and ALIX, with the C-terminal PRD domain removed. (B) AlphaFold 2 predicted the interaction between PACT and ALIX, with the C-terminal PRD domain removed. (C) GST pulldown assay of in vitro translated His-tagged PKR with GST or GST-tagged ALIX (i) or ALG2 (ii) in the presence of 10 μM CaCl2. (D) GST pulldown assay of in vitro translated His-tagged PACT with GST or GST-tagged ALIX (i) or ALG2 (ii) in the presence of 10 μM CaCl2. (E) Confocal microscopy imaging of GFP-PKR/PACT and ALIX in U2OS cells treated with 2 mM LLOMe for 30 min. Scale bar, 5 μm. (F) Quantification by HCM of ALIX puncta in U2OS cells transfected with scrambled siRNA as control (SCR), PKR siRNA for knockdown (PKRKD), or PACT siRNA for knockdown (PACTKD). Cells were treated with 2 mM LLOMe for 30 min. White masks, algorithm-defined cell boundaries; green masks, computer-identified ALIX puncta. (G) Analysis of proteins associated with purified lysosomes (LysoIP; TMEM192-3xHA) from HEK293T ALIX knockdown cells (ALIXKD) overexpressing FLAG or FLAG-ALIX. Cells were treated with 1 mM LLOMe for 1 h. NT, untreated cells. Data, means ± SEM (n = 3); HCM: n ≥ 3 (each experiment: 500 valid primary objects/cells per well, ≥5 wells/sample). †p ≥ 0.05 (not significant), ANOVA. See also Fig. 5.

References

    1. Abu-Remaileh M, Wyant GA, Kim C, Laqtom NN, Abbasi M, Chan SH, Freinkman E, Sabatini DM (2017) Lysosomal metabolomics reveals V-ATPase- and mTOR-dependent regulation of amino acid efflux from lysosomes. Science 358(6364):807–813. 10.1126/science.aan6298 - PMC - PubMed
    1. Advani VM, Ivanov P (2020) Stress granule subtypes: an emerging link to neurodegeneration. Cell Mol Life Sci 77(23):4827–4845. 10.1007/s00018-020-03565-0 - PMC - PubMed
    1. Aits S, Jäättelä M (2013) Lysosomal cell death at a glance. J Cell Sci 126(9):1905–1912 - PubMed
    1. Aits S, Kricker J, Liu B, Ellegaard A-M, Hämälistö S, Tvingsholm S, Corcelle-Termeau E, Høgh S, Farkas T, Holm Jonassen A (2015) Sensitive detection of lysosomal membrane permeabilization by lysosomal galectin puncta assay. Autophagy 11(8):1408–1424 - PMC - PubMed
    1. Amaral O, Martins M, Oliveira AR, Duarte AJ, Mondragão-Rodrigues I, Macedo MF (2023) The biology of lysosomes: from order to disorder. Biomedicines 11(1):213 - PMC - PubMed