. 2025 Jan;26(1):131-145.
doi: 10.1038/s41590-024-02010-9. Epub 2024 Nov 12.

Disease-associated B cells and immune endotypes shape adaptive immune responses to SARS-CoV-2 mRNA vaccination in human SLE

Affiliations

Disease-associated B cells and immune endotypes shape adaptive immune responses to SARS-CoV-2 mRNA vaccination in human SLE

Caterina E Faliti et al. Nat Immunol. 2025 Jan.

Erratum in

Abstract

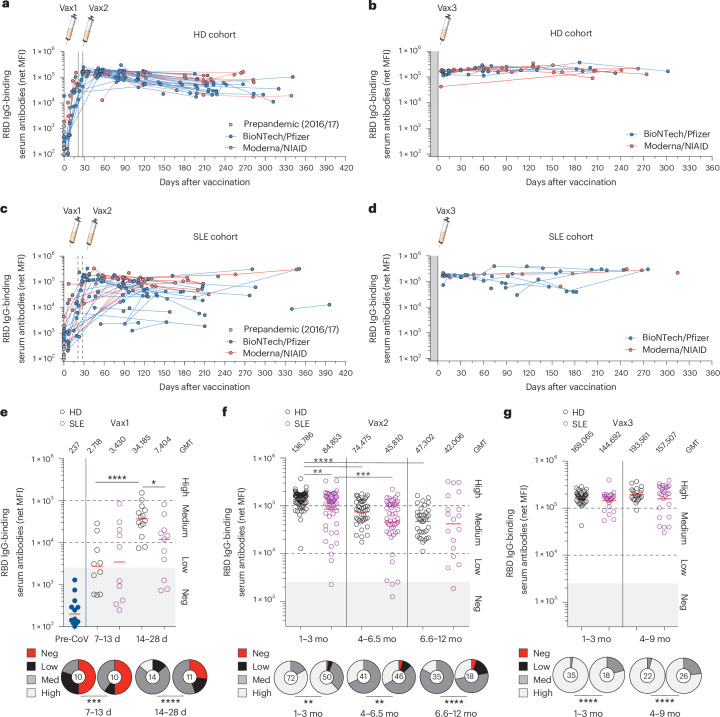
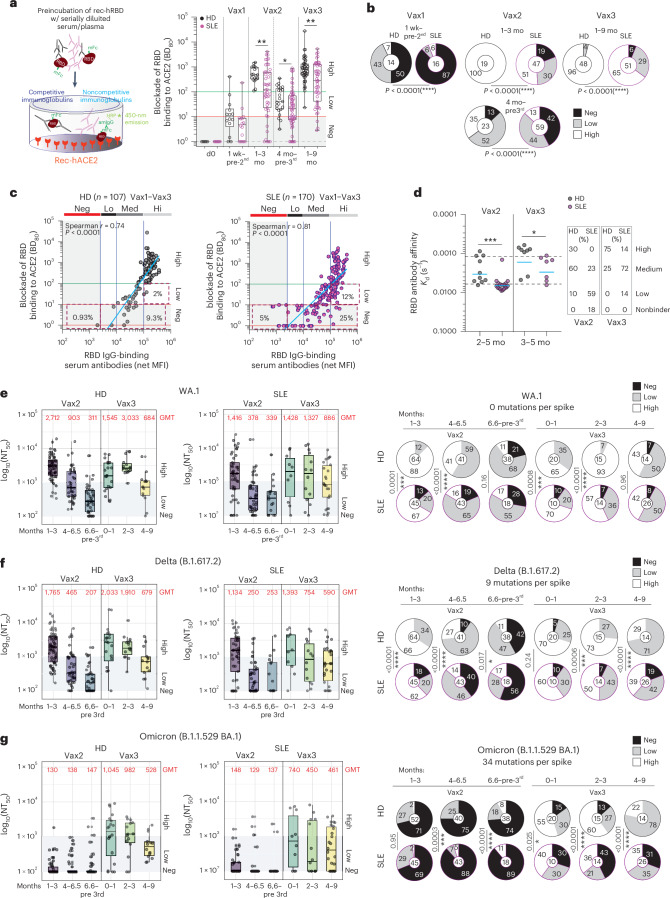
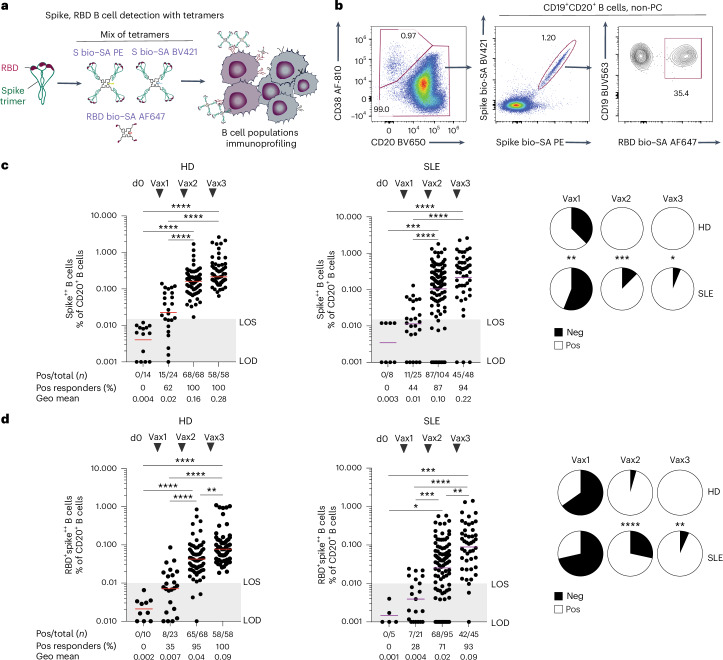
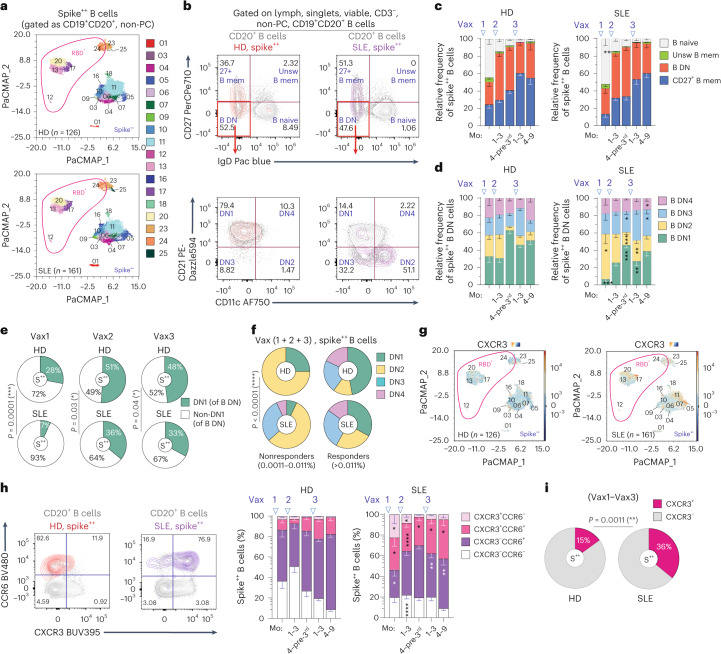
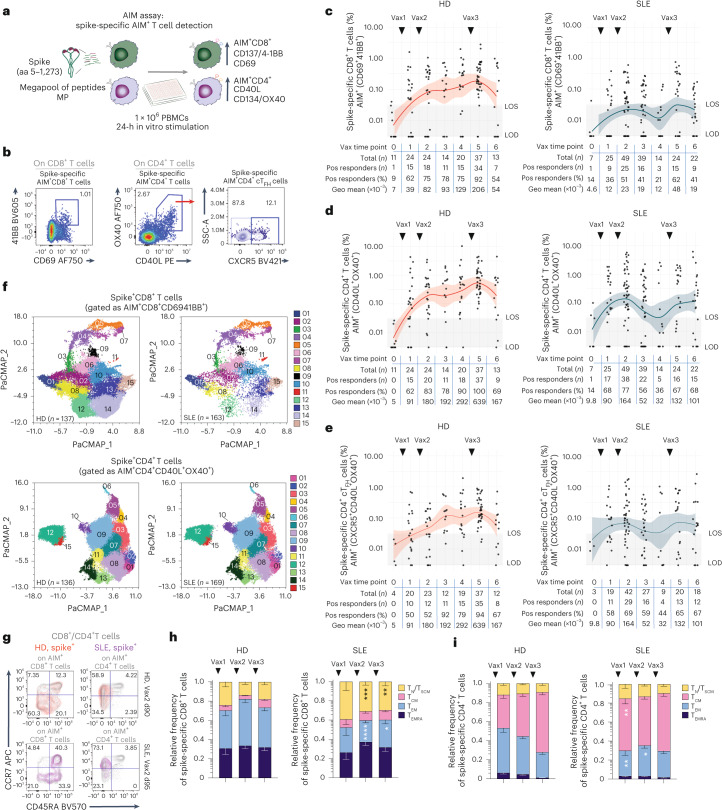
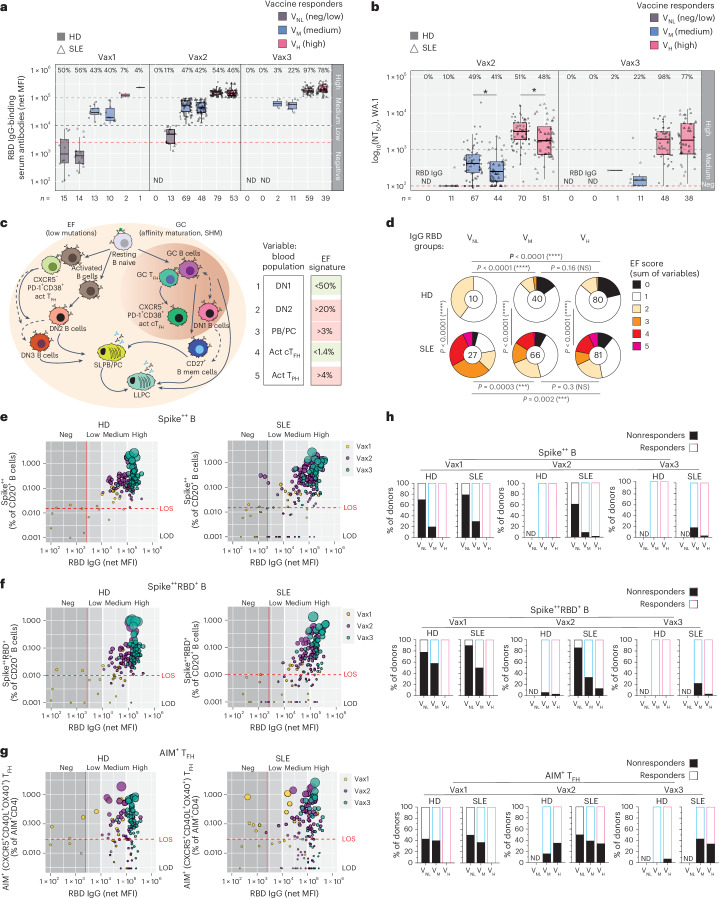
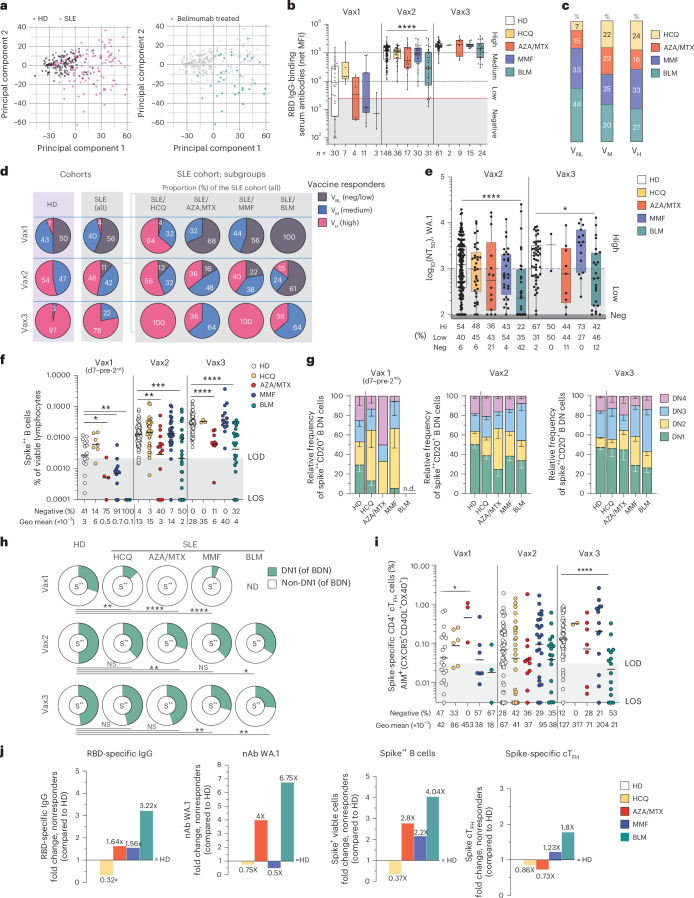
Severe acute respiratory syndrome coronavirus 2 mRNA vaccination has reduced effectiveness in certain immunocompromised individuals. However, the cellular mechanisms underlying these defects, as well as the contribution of disease-induced cellular abnormalities, remain largely unexplored. In this study, we conducted a comprehensive serological and cellular analysis of patients with autoimmune systemic lupus erythematosus (SLE) who received the Wuhan-Hu-1 monovalent mRNA coronavirus disease 2019 vaccine. Our findings revealed that patients with SLE exhibited reduced avidity of anti-receptor-binding domain antibodies, leading to decreased neutralization potency and breadth. We also observed a sustained anti-spike response in IgD-CD27- 'double-negative (DN)' DN2/DN3 B cell populations persisting during memory responses and with greater representation in the SLE cohort. Additionally, patients with SLE displayed compromised anti-spike T cell immunity. Notably, low vaccine efficacy strongly correlated with higher values of a newly developed extrafollicular B and T cell score, supporting the importance of distinct B cell endotypes. Finally, we found that anti-BAFF blockade through belimumab treatment was associated with poor vaccine immunogenicity due to inhibition of naive B cell priming and an unexpected impact on circulating T follicular helper cells.


Conflict of interest statement

Competing interests: F.E.-H.L. is the founder of MicroB-plex, Inc., and has research grants with Genentech. I.S. has research grants with Glaxo Smith Kline. The other authors declare no competing interests.

Figures

Fig. 1
Fig. 1. Serological evaluation of anti-spike vaccine-mediated antibody responses.
ad, Luminex-based detection of RBD IgG-binding serum antibodies (net MFI values) in the HD and SLE cohorts, shown for each vaccine administration. Each dot represents a sample. Connecting lines show longitudinal collections. Comparisons between mRNA vaccines (BioNTech/Pfizer (aqua) and Moderna/NIAID (salmon)) are shown for Vax1 + Vax2 in the HD (a) and SLE (c) cohorts and for Vax3 in the HD (b) and SLE (d) cohorts. eg, Clusters of IgG RBD titers based on binned time points for samples collected at Vax1 (e), Vax2 (f) and Vax3 (g). Statistical analysis was performed with a two-sided Mann–Whitney U test and indicated when significant. Pie charts show the distribution of seronegative (MFI 0–2,500) and seropositive (low MFI 2,500–10,000, medium MFI 10,000–100,000 and high MFI >100,000) values. The number of samples is indicated in the pies, and the percentage of responders was compared using a chi-square test. *P < 0.05; **P < 0.01; ***P < 0.001; ****P < 0.0001. MFI, mean fluorescence intensity; GMT, geometric mean titer; Pre-CoV, before the coronavirus pandemic; d, day(s); mo, month(s).
Fig. 2
Fig. 2. Reduced neutralization and breadth in the cohort of vaccinated patients with SLE.
a, ELISA determination of antibody-mediated inhibition of SARS-CoV-2 RBD binding to solid-phase ACE2. The graph shows the reciprocal plasma or serum dilution that blocks 80% binding (BD80) of RBD to human ACE2. log(BD80) values are shown as negative (0–1), low (1–2) and high (>2). Box plots represent the minimum to maximum values, showing all points as individual serum samples: HD (day 0, n = 5; 1 week pre-2nd, n = 14; Vax2 1–3 months, n = 19; Vax2 4 months–before Vax3, n = 23; Vax3, n = 48) and SLE (day 0, n = 8; 1 week pre-2nd, n = 16; Vax2 1–3 months, n = 47; Vax2 4 months–before Vax3, n = 59; Vax3, n = 51) Statistical analysis was performed using a two-sided Mann–Whitney U test. b, Pie graphs showing the frequency and statistical comparison of competitive immunoglobulins in the two cohorts. A chi-square with Fisher’s test was used for comparisons. The number in the circles indicates the total number of samples tested, whereas the numbers in the pies show the relative percentages of the negative (black), low (gray) and high (white) values. c, Graphs showing the linear correlation between the blocking of RBD binding to ACE2 (BD80) and the total RBD immunoglobulin-binding antibodies in the same sample, tested from vaccinated individuals from both the HD (left graph) and SLE (right graph) cohorts. d, Polyclonal antibody avidity (as measured by the dissociation off-rate per second) to the SARS-CoV-2 RBD protein at ~2–5 months after the second vaccination (Vax2) or ~3–5 months after the third mRNA vaccination (Vax3) for serum samples analyzed by SPR. Off-rate constants were determined from two independent SPR runs. The table shows the frequency of responders for each cohort and time point analyzed. An unpaired t test was applied. eg, Pseudoviral neutralization in vitro assay performed on plasma samples isolated from vaccinated individuals after Vax2 and Vax3. The graphs show the neutralizing titers inhibiting 50% of the viral growth (NT50) tested for the SARS-CoV-2 WA.1 wild-type (e), Delta (B.1.617.2) (f) and Omicron (B.1.1.529 BA.1) (g) strains. Each dot in the box plots represents an individual sample tested. Horizontal lines indicate the median. The pie charts show the comparison of negative, low and high neutralizers. Statistical comparison was performed using a chi-square with Fisher’s test. The number in the circles indicates the total number of individual samples tested, whereas the numbers in the pies show the relative percentages of the negative (black), low (gray) and high (white) values. Not significant, P > 0.05; *P < 0.05; **P < 0.01; ***P < 0.001; ****P < 0.0001. HRP, horseradish peroxidase; amIgG, anti-mouse IgG; mFc, monomeric Fc; rec-hRBD, recombinant human RBD; rec-hACE2, recombinant human ACE2; d0, day 0; wk, week(s); pre-2nd/3rd, before the second or third dose.
Fig. 3
Fig. 3. Lower magnitude of antigen-specific memory B cells in the vaccinated SLE cohort.
a, Cartoon showing the ex vivo tetramer-based detection of spike- and RBD-reactive B cells and high-dimensional flow immunoprofiling of B cells from PBMCs. b, Representative fluorescence-activated cell sorting (FACS) plots showing the gating strategy applied to characterize the total CD19+CD20+ B cells (excluding the CD20CD38hi plasma cells) binding to dual-tetrameric spike probes and tetrameric RBD probes. c,d, Quantification of the total spike-specific (c) and RBD-specific (d) B cells shown as the frequency of CD20+ B cells in the HD and SLE cohorts. Each dot represents an individual sample tested at baseline (day 0) and after receiving one (Vax1), two (Vax2) or three (Vax3) vaccine doses. Differences among groups were analyzed using multiple-group comparisons by nonparametric Kruskal–Wallis statistical testing using Dunn’s post hoc analysis in GraphPad Prism. Comparisons using pie charts and a chi-square with Fisher’s test are shown. *P < 0.05; **P < 0.01; ***P < 0.001; ****P < 0.0001. S, spike; bio–SA, biotin–streptavidin; PC, plasma cell.
Fig. 4
Fig. 4. Greater DN2 expansion in the vaccinated SLE cohort.
a, PaCMAP and FlowSOM representations of spike++CD20+ B cells from HDs (n = 126) and SLE donors (n = 161). Samples were combined from Vax1 + Vax2 + Vax3. b, Representative FACS plots showing the characterization of spike-reactive CD20+ B cell subsets based on the expression of IgD and CD27. CD21 and CD11c markers are used to define the DN subsets further. Individual samples from the HD (Vax1, n = 23; Vax2 1–3 months, n = 22; Vax2 >3 months, n = 34; Vax3 1–3 months, n = 37; Vax3 >3 months, n = 13) and SLE (Vax1, n = 20; Vax2 1–3 months, n = 45; Vax2 >3 months, n = 51; Vax3 1–3 months, n = 24; Vax3 >3 months, n = 20) cohorts. c, Bar graphs showing the relative frequency of spike++ B cell subsets based on IgD and CD27 expression in the HD and SLE cohorts. Vertical lines indicate the s.e.m. A two-sided Mann–Whitney U test was used to calculate the significance of the SLE group compared to the HD group. d, Relative frequency of spike++ B DN cell subsets in vaccinees from the HD and SLE groups. Vertical lines indicate the s.e.m. A two-sided Mann–Whitney U test was used to calculate the significance of the SLE group compared to the HD group. e, Pie charts showing comparisons of the average sum for DN1 versus non-DN1 (DN2 + DN3 + DN4) spike++ B DN cells. A chi-square with Fisher’s test was used for significance testing. f, Reactivity of DN subsets among nonresponders and responders. A chi-square test was used for statistical comparisons. The LOS was based on median values of baseline + 2 × s.d. g, PaCMAP and FlowSOM data representing the level of expression of CXCR3 on clusters of spike++CD20+ B cells as in a. h, Dot plots representative of the CCR6 and CXCR3 expression of the total and spike++ B cells. The bar graphs show the distribution of CCR6- and CXCR3-expressing spike-reactive B cells of the HD and SLE cohorts. Individual samples from the HD (Vax1, n = 23; Vax2 1–3 months, n = 22; Vax2 >3 months, n = 34; Vax3 1–3 months, n = 37; Vax3 >3 months, n = 13) and SLE (Vax1, n = 20; Vax2 1–3 months, n = 45; Vax2 >3 months, n = 51; Vax3 1–3 months, n = 24; Vax3 >3 months, n = 20) cohorts. Vertical lines indicate the s.e.m. A two-sided Mann–Whitney U test was used to calculate the statistical significance of the B cell subset populations in the SLE cohort compared to HD frequencies, as shown in the SLE graphs. i, Pie charts showing the comparison of the total CXCR3+spike++ and CXCR3spike++ B cells, as well as relative frequencies. A chi-square with Fisher’s test was used for comparisons. When indicated, the LOD was set to logarithmic 0.001 for B cells and 0.003 for T cells. The LOS was based on median values of baseline + 2 × s.d. *P < 0.05; **P < 0.01; ***P < 0.001; ****P < 0.0001. Pac blue, Pacific blue; Unsw, unswitched; B mem, B memory.
Fig. 5
Fig. 5. Lower T cell reactivity in patients with SLE receiving SARS-CoV-2 mRNA vaccines.
a, Schematic showing the 24-h AIM assay-based detection of antigen-reactive T cells upon incubation of PBMCs with a megapool of spike-derived peptides and the flow cytometric analysis of surface-expressed markers of activation and immune profiling. b, Representative FACS plots showing the gating strategy applied to characterize the AIM+ spike-reactive CD8+ (41BB+CD69+) T cells or AIM+ spike-reactive CD4+ (OX40+CD40L+) T cells and AIM+ spike-reactive cTFH (CXCR5+ of AIM+CD4+) cells among the CD3+ T cells. ce, Scatter plots showing the frequency of spike-specific AIM+ T cells quantified at each indicated time point in the HD and SLE cohorts for AIM+CD8+ T cells (c), AIM+CD4+ T cells (d) and AIM+CD4+ cTFH (e) cells. The vaccination time points in ce indicate the following binned time points (T), as indicated in Extended Data Fig. 1a: 0 (T0, baseline), 1 (T1–T3), 2 (T4–T5), 3 (T6–T7), 4 (T8–T9), 5 (B1–B5) and 6 (B6–B9). The number of samples is indicated as ‘Total (n)’. f, PaCMAP and FlowSOM representations of AIM+CD8+ T cells (HD, n = 137; SLE, n = 163) and AIM+CD4+ T cells (HD, n = 136; SLE, n = 169) from the HD (n = 126) and SLE (n = 161) cohorts from combined Vax1 + Vax2 + Vax3. A total of 15 clusters are indicated in the plots, and the relative marker expression and classification of the clusters are shown in Extended Data Fig. 7f,g. g, Representative dot plots showing the differentiation of AIM+ T cells using CD45RA and CCR7 expression. h, Bar plots showing the distribution of the four subsets (TN/TSCM, TCM, TEM and TEMRA) of AIM+CD8+ T cells. Individual samples from the HD (Vax1, n = 17; Vax2, n = 47; Vax3, n = 43) and SLE (Vax1, n = 12; Vax2, n = 65, Vax3, n = 38) cohorts. i, Bar plots showing the distribution of the four subsets (TN/TSCM, TCM, TEM and TEMRA) of AIM+CD4+ T cells. Individual samples from the HD (Vax1, n = 19; Vax2, n = 54; Vax3, n = 48) and SLE (Vax1, n = 20; Vax2, n = 81, Vax3, n = 45) cohorts. A two-sided Mann–Whitney U test was applied to compare each subset of T cells between the SLE and HD groups, and significance is shown in the SLE bars. When indicated, the LOD was set to logarithmic 0.001 for B cells and 0.003 for T cells. The LOS was based on median values of baseline + 2 × s.d. Vertical lines indicate the s.e.m. *P < 0.05; **P < 0.01; ***P < 0.001; ****P < 0.0001. MP, megapool; TN, naive T cells; TSCM, stem cell-like memory T cells; TCM, central memory T cells; TEMRA, TEM cells reexpressing CD45RA.
Fig. 6
Fig. 6. Characterization of our cohort of vaccinees based on vaccine responsiveness and the associated extrafollicular-like signature.
a, Mean values of RBD IgG titers based on the classification of three groups: VNL (MFI 0–10,000), VM (MFI 10,000–100,000) and VH (MFI >100,000); the proportion of responders is shown for each group (HD: filled squares, SLE: empty triangles) and vaccination time point. The number of samples analyzed (n) is shown at the bottom of the plots. b, Plasma log10(NT50) values detected for the pseudoviral neutralization of the WA.1 strain and based on the three groups of vaccine reactiveness as in a, at the Vax2 and Vax3 time points. The red lines in the plots indicate the LOS. The range of response (negative, low, medium, high) is indicated in the graphs. Each dot in the box plots represents an individual sample tested. Horizontal lines indicate the median. The proportion of positive responders is shown as the frequency indicated for each group and compared between groups of responders and time points (a two-sided Mann–Whitney U test was applied to compare the groups in the HD and SLE cohorts). c, Simple model showing the proposed B cell differentiation alongside the extrafollicular or GC pathways. Cell population frequencies were used to mimic a circulating B and T cell extrafollicular-derived signature based on reduced frequency of CD21+CD11c DN1 cells (<50%) and act cTFH (CXCR5+PD-1+CD38+) cells (<1.4%) and increased frequency of CD21CD11c+ DN2 cells (>20%), CD20CD38hi plasmablasts/plasma cells (>3%) and act TPH (CXCR5PD-1+CD38+) cells (>4%). d, Variables related to the extrafollicular signature were scored and summed in each sample tested for the VNL, VM and VH groups in the HD and SLE cohorts. Intracohort and intercohort statistical comparisons were performed with a chi-square test. eg, Bubble plots showing the correlation of cellular immune responses and RBD IgG titers. The red lines in the plots indicate the LOS. The frequencies of spike++ B cells (e), spike++RBD+ B cells (f) and AIM+ cTFH cells (g) are shown. h, Bar graphs related to eg showing the quantitation of nonresponders (black filled bars, based on the LOS) and responders (white filled bars) separated for each vaccination time point and group (VNL: black line, VM: light blue line, VH: pink line). A chi-square test was used for statistical comparisons. The LOS was based on median values of baseline + 2 × s.d. Not significant, P > 0.05; *P < 0.05; ***P < 0.001; ****P < 0.0001. SHM, somatic hypermutation; EF, extrafollicular; SLPB, short-lived plasmablast; LLPC, long-lived plasma cell; ND, not determined; NS, not significant.
Fig. 7
Fig. 7. Impact of SLE treatment on vaccine-mediated responses and enrichment of poor responders in patients receiving belimumab.
a, Unsupervised PCA analysis showing separation of the HD and SLE cohorts based on immunophenotypic variables. b, Luminex-based detection of RBD IgG-binding serum antibodies (net MFI values) in the HD cohort and subgroups of patients with SLE based on their treatment. The number of samples analyzed (n) is shown at the bottom of the plots. c, Proportion of patients with SLE based on their treatment among the three groups (VNL, VM and VH) of vaccine responders. d, Table with pie charts showing the percentage of VNL, VM and VH in the HD and SLE groups, as well as the relative proportion of each SLE subgroup/treatment responsiveness of the total SLE cohort. e, Neutralizing titers based on the SLE treatment group for the WA.1 strain and distribution of responders shown as a frequency of the total samples for each column. f, Cellular analysis of spike reactivity for spike++ B cells, calculated as the frequency of viable cells. g, Relative frequency of spike-reactive DN B cell populations for the HD cohort and SLE subgroups. Vertical lines indicate the s.e.m. h, Pie charts showing comparisons of the average sum for DN1 (green) versus non-DN1 (DN2 + DN3 + DN4) (white) spike++ B DN cells; the relative frequencies are shown for all vaccinated samples combined from the HD cohort and SLE subgroups. A chi-square with Fisher’s test was used for significance testing. i, AIM+ cTFH cells shown for each vaccine group and SLE subgroup. Each dot represents an individual sample. Statistical comparisons in b, e, f, h and i were performed with an unpaired, two-sided Mann–Whitney U test. When indicated, the LOD was set to logarithmic 0.001 for B cells and 0.003 for T cells. The LOS was based on median values of baseline + 2 × s.d. Not significant, P > 0.05; *P < 0.05; **P < 0.01; ***P < 0.001; ****P < 0.0001. j, Distribution of nonresponders calculated as the fold change of the cumulative percentage of nonresponders (negative values) for each of the indicated categories tested at Vax1–Vax3 (RBD-specific IgG, spike++ B cells and cTFH cells) and Vax2–Vax3 (WA.1 nAb). For boxplots in (b) and (c), dots represent individual samples tested; horizontal lines indicate the median. HCQ, hydroxychloroquine; AZA, azathioprine; MTX, methotrexate; MMF, mycophenolate mofetil; BLM, belimumab.
Extended Data Fig. 1
Extended Data Fig. 1. Study cohorts’ samples and timeline of samples’ collection.
a, Study design, vaccine administration scheme, and time points collected after SARS-CoV-2 mRNA vaccination for healthy controls and patients with SLE. b, Diagrams showing the longitudinal collection of blood draws from HD and SLE enrolled in the study (circles) and pre-pandemic controls (Pre-CoV, squares). The SLE cohort is grouped for the main treatment by colored circles: Untreated (none, black), Hydroxychloroquine (HCQ, yellow), Azathioprine (AZA, red), Methotrexate (MTX, dark red), Mycophenolate Mofetil (MMF, dark blue), Belimumab (BLM, turquoise).
Extended Data Fig. 2
Extended Data Fig. 2. High-dimensional flow cytometry characterization of B and T cells.
a, Representative gating strategy for the quantification of CD19+ B cells, their subsets, and tetramer-based reactivity detection for spike and RBD by flow cytometry. b, Representative gating strategy for quantification of CD3+ T cells, and their CD4s and CD8s populations and subsets by flow cytometry.
Extended Data Fig. 3
Extended Data Fig. 3. Detection of circulating antigen-specific Igs antibodies upon vaccination.
a, Cartoon showing the Luminex bead-based assay. b, Nucleocapsid IgG threshold used to define SARS-CoV-2 negative samples. Each dot represents a sample tested. Boxplots represent min to max and show all points. Statistics was calculated with non-parametric Kruskal-Wallis with Dunn’s multiple comparisons c, IgM and d, IgA reactivity to the SARS-CoV-2 proteins NTD, S2, S1 and RBD and percentage of responders in HD and SLE. Each dot represents a sample tested. Negative values are based on MFI values of time 0 (T0) from pre-pandemic and vaccine baseline samples, and are indicated below the gray area. Percentage of positive responders above the gray area is shown as a numberical value above each tested time-point e, Kinetics analyses for IgG binding to S1, RBD, S2, and NTD proteins by Luminex assay. Overlay of geometric mean and pie charts showing the proportion of negative, low, medium, or high values. Statistics of the geomean between HD and SLE were performed with two-sided U Mann Whitney for comparison of each indicated time. Pie chart comparison statistics performed with Chi-square with Fisher test analysis. f, ELISA detection of IgG reactive to beta-common cold coronaviruses (beta-CoV) HKU-1 and OC43 and alpha-common cold coronaviruses (alpha-CoV) NL63 and 229E, tested with sera from pre-vaccinated (baseline) donors enrolled in the study. Boxplots represent median with interquartile range, and whiskers indicate range. Each dot represents a tested sera sample from n = 8 HD and n = 9 SLE at baseline. Statistical comparison was performed with unpaired t-test. Not significant, ns p > 0.05; *p < 0.05; **p < 0.01; ***p < 0.001; ****p < 0.0001.
Extended Data Fig. 4
Extended Data Fig. 4. Detection of circulating neutralizing Igs upon vaccination and quantitation of anti-spike B cells.
a, Cartoon showing the steps of pseudoviral in vitro neutralization assay. b, NT50 values detected from HD and SLE plasma and comparison of all viral strains for each sample. Fold changes show the difference between Delta and Omicron compared to the WT values. c, Circulating CD19+ B cells frequency comparison in our cohorts. d, Correlation of CD19+ frequency and spike reactive B cells in HD and SLE for each vaccine time point. Blue lines show the range observed in the HD. Pearson analysis was performed for each comparison. Quantification of total (e) spike-specific and (f) RBD-specific B cells shown as the frequency of viable lymphocytes in the HD and SLE cohorts. Each dot represents an individual sample tested at baseline (d0) and after receiving one (Vax 1), two (Vax 2), or three (Vax 3) vaccine doses. Pie charts comparisons and Chi-square with Fisher’s test are shown. When indicated, LOD=limit of detection set to logarithmic 0.001 for B cells and 0.003 for T cells. LOS=limit of sensitivity, based on median values of baseline + 2 x SD. *p < 0.05; **p < 0.01; ***p < 0.001; ****p < 0.0001.
Extended Data Fig. 5
Extended Data Fig. 5. Immunity to the four seasonal CCCs.
a, Representative gating strategy to score the frequency of Spike-reactive B cells and their binding to the four CCCs Spikes and cross-reactivity with WA.1 Spike by flow cytometry. b, Quantitation of CCCs cross-reactive memory B cells with WA.1 reactive Spike B cells from PBMC samples collected during mRNA vaccination (Vax 1 + 2 + 3). c, Quantitation of CCCs cross-reactive memory B cells with WA.1 reactive Spike CD27+ Bmem cells from PBMC samples collected during mRNA vaccination (Vax 1 + 2 + 3). SLE patients treated with Belimumab (SLE/BLM) are shown in teal color. Each dot represents an individual sample. Statistical comparison performed with unpaired, two-sided Mann-Whitney U test. Not significant, ns p > 0.05; *p < 0.05.
Extended Data Fig. 6
Extended Data Fig. 6. Unsupervised PacMap and FlowSOM analysis of anti-Spike B and quantitation of surface IgM, IgA and IgG expression.
a, Spike++ B cells, EdgeR comparison and significance of low vs high represented clusters in SLE vs HD. b, Frequency of DN2 (left graph) and Spike++ DN2 B cells (right graph) from all subjects enrolled in the study, divided by race (AA/Black vs others). Each dot represents an individual sample. For the DN2, horizontal lines are means and statistics was calculated with Kruskal-Wallis with Dunn’s multiple comparisons. For the Spike++ DN2, horizontal lines are medians and statistics was calculated with Unpaired T test. c, Representative flow detection of Ig surface expression on B cells. d, Distribution of IgM, IgG and IgA and Chi-square (Fisher) comparison. Frequency of membrane-bound e, IgM, f, IgA and g, IgG in HD and SLE spike+ B cells showed for each vaccine time point as shown in (d). Each dot represents an individual sample. The overlay of the median signals for HD and SLE is shown for each Ig tested. One-way ANOVA test is shown within the HD or SLE groups. Not significant, ns p > 0.05; *p < 0.05; **p < 0.01; ***p < 0.001; ****p < 0.0001.
Extended Data Fig. 7
Extended Data Fig. 7. Unsupervised PacMap and FlowSOM analysis of anti-Spike T cells and AIM assay.
a, Cartoon showing the AIM assay. b, Representative flow plots and gating strategies used to define AIM+ T cells and their differentiation. c-e Overlay graphs showing the geometric mean values of the groups are shown for c, AIM+ CD8, d, AIM+ CD4 and e, AIM+ Tfh. Below each graph, the pie charts represent the proportion of negative and positive responders at each indicated time-point. Vax time points in the figures (c-e) indicate the following binned Time-Points (T) and as indicated in the Extended Data Fig. 1a: 0 (T0, baseline), 1 (T1-3), 2 (T4-5), 3 (T6-7), 4 (T8-9), 5 (B1-5) and 6 (B6-9). The Chi-Square test was performed to define significance in c, d and e. f, Spike++ AIM+ CD8 T cells, EdgeR comparison and significance of low vs high represented clusters in SLE vs HD. g, Spike++ AIM+ CD4 T cells, EdgeR comparison and significance of low vs high represented clusters in SLE vs HD. EdgeR comparisons and significance (expressed as FDR) was generated with ‘omiq.ai’. All cluster’s names were compiled by using the surface markers’ expression as indicated in the relative heatmap. Not significant, ns p > 0.05; *p < 0.05; **p < 0.01; ***p < 0.001; ****p < 0.0001.
Extended Data Fig. 8
Extended Data Fig. 8. Analysis of antigen-specific T cell responses to spike and HA proteins.
a, Frequency of AIM+ cTfh17 upon Vax1, 2 or 3. Each dot represents an individual sample collected at the indicated time-points. Boxplots represent min to max and show all points. Sample from HD (Vax1, n = 18; Vax2, n = 49; Vax3, n = 47) and SLE (Vax1, n = 18; Vax2, n = 67;Vax3, n = 34). b, Reactivity towards the HA MP for all tested samples, and comparison of HD and SLE. c, Differentiation of AIM+ HA T cells based on CD45RA and CCR7 expression. Not significant, ns p > 0.05; *p < 0.05; **p < 0.01; ***p < 0.001; ****p < 0.0001.
Extended Data Fig. 9
Extended Data Fig. 9. Clinical, demographics, and immunological features characterizing our two cohorts of vaccinated HD and SLE.
a, Frequency of DN1, DN2, PB/PC, act cTfh and act Tph used to create the EF score and unpaired, Mann-Whitney U test shown for significance between HD and SLE cohorts. b, Age and race showing the distribution in HD and SLE based on vaccine responsiveness (negative/low VNL, medium VM, or high VH). c, Distribution of females (F) and males (M) in our cohorts, based on vaccine responsiveness (negative/low VNL, medium VM, or high VH). d, Number of subjects within each group based on age and vaccine responses clustered by age (18-50, >50 years old, yo). Each dot represents an individual sample collected at the indicated time-points. Numbers of samples tested (n = ) are indicated in the figure. Boxplots represent min to max and show all points. e, Vaccine responsiveness based on sex (M/F) in our two cohorts. f, AIM+ CD8 and g, AIM+ CD8 frequencies and percentage of non-responders identified for each vaccine group of VNL, VM, and VH. When indicated, LOD = limit of detection set to logarithmic 0.003 for T cells. LOS = limit of sensitivity, based on median values of baseline + 2 x SD. ****p < 0.0001.
Extended Data Fig. 10
Extended Data Fig. 10. Immunophenotype of vaccinated SLE categorized by treatment.
a, Variance plot driving the PCA analyses. b, Simple cartoon showing lupus-associated drugs targeting B cells and table showing the main group of SLE divided by treatment as analyzed in this study. c-h, Representative high-dimensional flow cytometry characterization of B cell in HD and SLE groups showing the comparison of c, CD19+ d, Naïve B cells, activated Naïve (aN) B cell, Transitional B cells (Btr) and CD21lo Btr. e, CD27+ conventional memory. f, DN B cells and subsets; ratio of DN2:DN1 expressed as log2 value. g, IgD- ASC and CD20CD38hi PC. h, cTfh. SLE sub-group frequency of each population is compared to the HD group for statistical significance. When indicated in the graph, the gray line is a threshold for normal range below (that is, CD19, DN1, cTfh) or above (that is, DN2, ASC, PC) the HD calculated average ranges. i, SELENA-SLEDAI score, comparison of sub-group of SLE by treatments. Statistical comparisons performed with unpaired, two-sided Mann-Whitney U test. j, NT50 values for Delta and Omicron neutralization observed in HD and sub-groups of SLE. k, Relative frequency of spike reactive B cell populations for all subjects from HD and SLE sub-groups based on CD27 and IgD expression. l, Symbol (one per column) with geometric mean values with 95% CI shown for spike reactive CD8 and CD4 within all the SLE sub-groups and HD enrolled in the study. Boxplots represent mean and whiskers indicate range. Statistical comparison between HD and SLE sub-groups per each vaccine dose performed with unpaired, Mann-Whitney U test. Not significant, ns p > 0.05; *p < 0.05; **p < 0.01; ***p < 0.001; ****p < 0.0001.

References

    1. Baden, L. R. et al. Efficacy and safety of the mRNA-1273 SARS-CoV-2 vaccine. N. Engl. J. Med.384, 403–416 (2021). - PMC - PubMed
    1. Polack, F. P. et al. Safety and efficacy of the BNT162b2 mRNA Covid-19 vaccine. N. Engl. J. Med.383, 2603–2615 (2020). - PMC - PubMed
    1. Thompson, M. G. et al. Effectiveness of Covid-19 vaccines in ambulatory and inpatient care settings. N. Engl. J. Med.385, 1355–1371 (2021). - PMC - PubMed
    1. Kim, W. et al. Germinal centre-driven maturation of B cell response to mRNA vaccination. Nature604, 141–145 (2022). - PMC - PubMed
    1. Röltgen, K. et al. Immune imprinting, breadth of variant recognition, and germinal center response in human SARS-CoV-2 infection and vaccination. Cell185, 1025–1040 (2022). - PMC - PubMed

MeSH terms