

The voice of depression: speech features as biomarkers for major depressive disorder
- PMID: 39533239
- PMCID: PMC11559157
- DOI: 10.1186/s12888-024-06253-6
The voice of depression: speech features as biomarkers for major depressive disorder
Abstract
Background: Psychiatry faces a challenge due to the lack of objective biomarkers, as current assessments are based on subjective evaluations. Automated speech analysis shows promise in detecting symptom severity in depressed patients. This project aimed to identify discriminating speech features between patients with major depressive disorder (MDD) and healthy controls (HCs) by examining associations with symptom severity measures.
Methods: Forty-four MDD patients from the Psychiatry Department, University Hospital Aachen, Germany and fifty-two HCs were recruited. Participants described positive and negative life events, which were recorded for analysis. The Beck Depression Inventory (BDI-II) and the Hamilton Rating Scale for Depression gauged depression severity. Transcribed audio recordings underwent feature extraction, including acoustics, speech rate, and content. Machine learning models including speech features and neuropsychological assessments, were used to differentiate between the MDD patients and HCs.
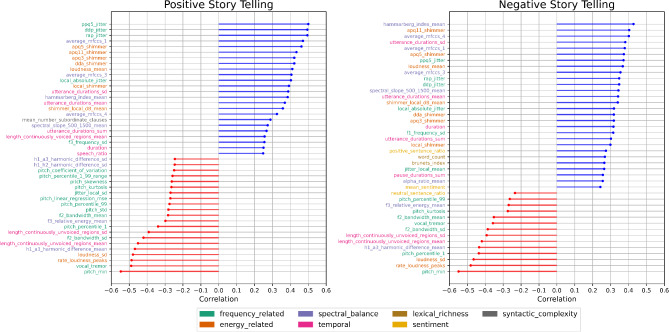
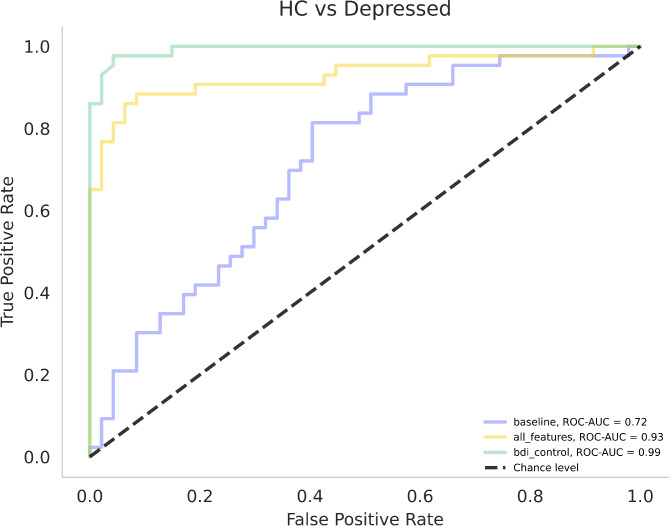
Results: Acoustic variables such as pitch and loudness differed significantly between the MDD patients and HCs (effect sizes 𝜼2 between 0.183 and 0.3, p < 0.001). Furthermore, variables pertaining to temporality, lexical richness, and speech sentiment displayed moderate to high effect sizes (𝜼2 between 0.062 and 0.143, p < 0.02). A support vector machine (SVM) model based on 10 acoustic features showed a high performance (AUC = 0.93) in differentiating between HCs and patients with MDD, comparable to an SVM based on the BDI-II (AUC = 0.99, p = 0.01).
Conclusions: This study identified robust speech features associated with MDD. A machine learning model based on speech features yielded similar results to an established pen-and-paper depression assessment. In the future, these findings may shape voice-based biomarkers, enhancing clinical diagnosis and MDD monitoring.
Keywords: Depression; Machine learning; Precision psychiatry; Speech biomarkers.
© 2024. The Author(s).
Conflict of interest statement
Figures
References
-
- Iancu SC, Wong YM, Rhebergen D, van Balkom AJLM, Batelaan NM. Long-term disability in major depressive disorder: a 6-year follow-up study. Psychol Med. 2020;50(10):1644–52. - PubMed
-
- Marx W, Penninx BWJH, Solmi M, Furukawa TA, Firth J, Carvalho AF, et al. Major depressive disorder. Nat Rev Dis Primer. 2023;9(1):1–21. - PubMed
MeSH terms
Substances
Grants and funding
LinkOut - more resources
Full Text Sources
