. 2024 Nov 12;55(1):149.
doi: 10.1186/s13567-024-01407-6.

TRIM28 regulates the coagulation cascade inhibited by p72 of African swine fever virus

Affiliations

TRIM28 regulates the coagulation cascade inhibited by p72 of African swine fever virus

Xuejiao Zhu et al. Vet Res. .

Abstract

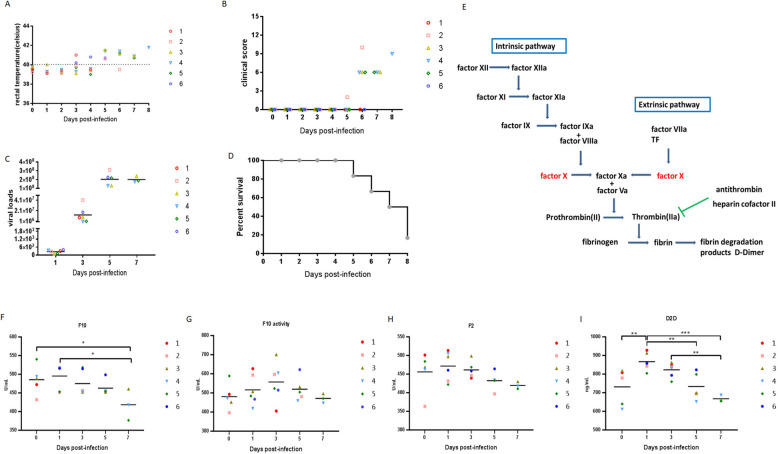
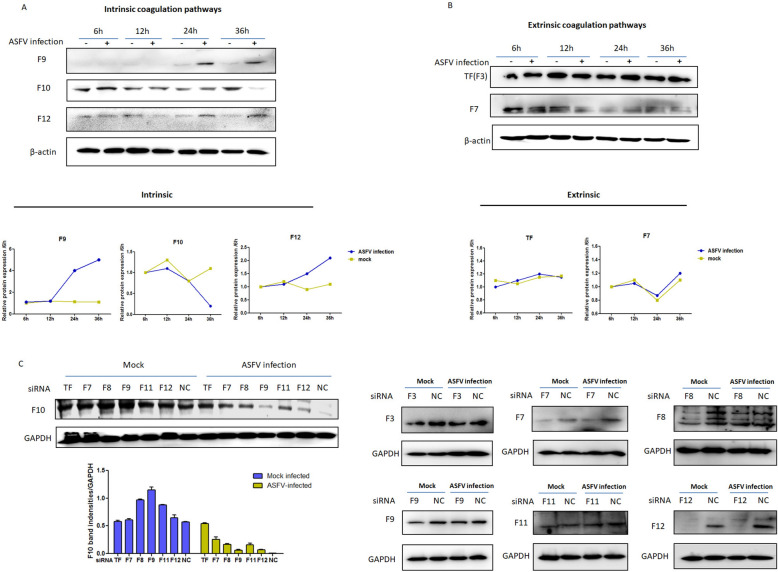
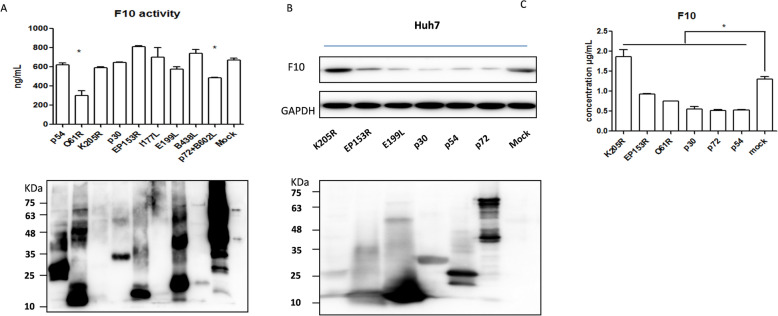
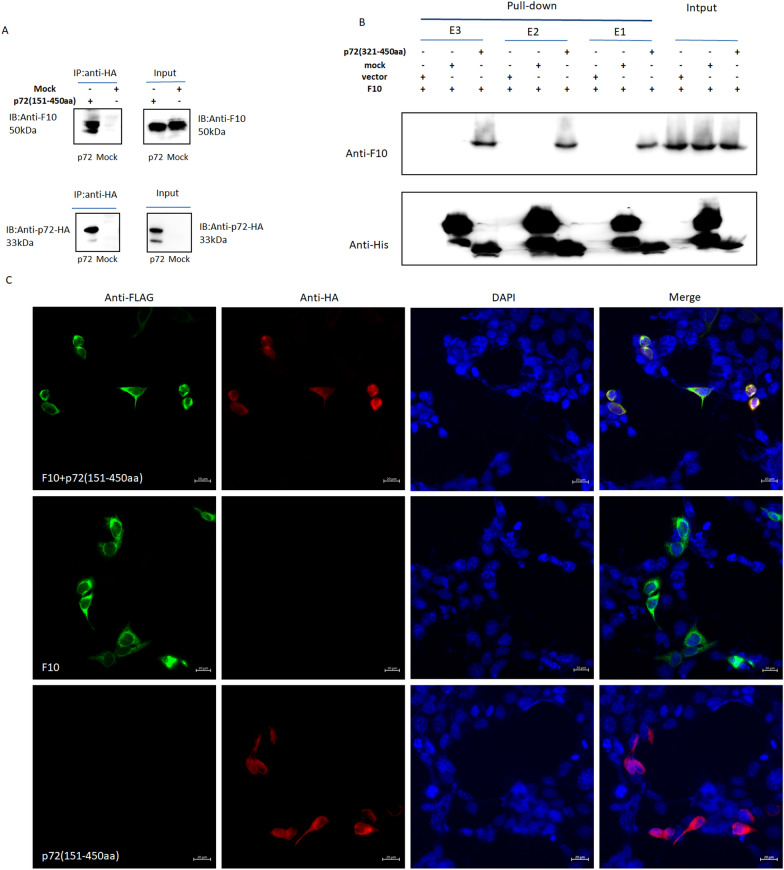
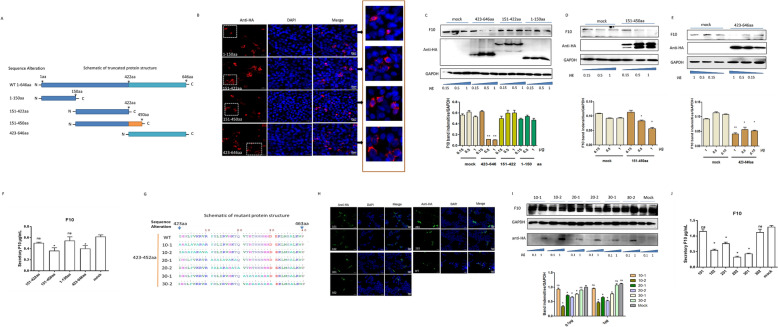
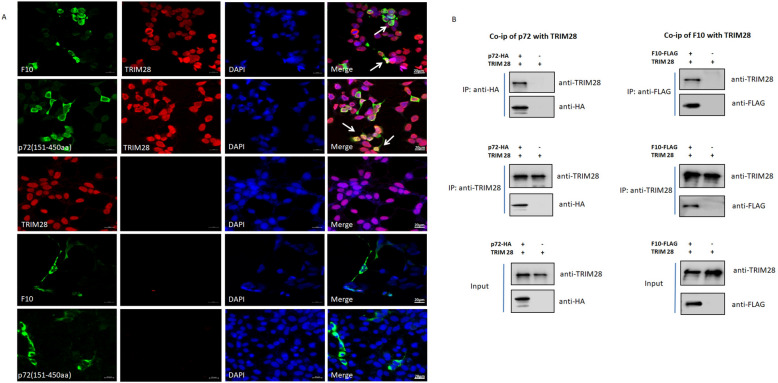
In 2018, African swine fever virus (ASFV) emerged in China, causing extremely serious economic losses to the domestic pig industry. Infection with ASFV can cause disseminated coagulation, leading to the consumption of platelets and coagulation factors and severe bleeding. However, the mechanism of virus-induced coagulation has yet to be established. In our study, ASFV downregulated the coagulation process, as detected by D-dimer (D2D) and Factor X (F10) expression in pigs challenged with ASFV HLJ/18. In vitro, ASFV infection increased Factor IX (F9) and Factor XII (F12) expression while downregulating F10 expression in porcine alveolar macrophages (PAMs). African swine fever virus induced both intrinsic and extrinsic coagulation cascades. In addition, several encoded proteins affect the expression of the crucial coagulation protein F10, and among the encoded proteins, p72 inhibits the activity and expression of F10. Proteomic analysis also revealed that p72 is involved in the coagulation cascade. p72 can interact with F10, and its inhibitory functional domains include amino acids 423-432 and amino acids 443-452. Finally, we found that F10 and p72 interact with tripartite motif-containing protein 28 (TRIM28). TRIM28 knockdown resulted in a decrease in F10 expression. Importantly, TRIM28 contributes to the reduction in F10 protein expression regulated by p72. Our findings revealed an inhibitory effect of the viral protein p72 on the ASFV infection-induced coagulation cascade and revealed a role of TRIM28 in reducing F10 expression, revealing a molecular mechanism of ASFV-associated coagulation.

Keywords: ASFV; P72; TRIM28; coagulation cascade; factor 10.


Conflict of interest statement

Declarations Ethics approval and consent to participate All animal experiments were performed according to animal protocols approved by the Subcommittee on Research Animal Care at the HVRI (231008–02-GJ) and carried out in strict accordance with the recommendations in the Guide for the Care and Use of Laboratory Animals of the Ministry of Science and Technology of the People’s Republic of China. Competing interests The authors declare that they have no competing interests.

Figures

Figure 1
Figure 1
ASFV infection regulated coagulation and related factors in vivo. A Evolution of rectal temperature, B clinical score in animals (6 animals) IM infected with 102.5 HAD50 of ASFV HLJ/18. C viremia, viremia values are expressed as copies/mL, sensitivity of virus detection: > 1000 copies/mL, and D mortality. Dpi: days post-infection. E Sketch of the coagulation activation process. F ASFV-positive serum samples from each pig at the indicated time points were collected for detection of F10 and G F10 activity. H ASFV-positive serum samples from each pig at the indicated time points were collected for detection of F2 and I D2D by ELISA. Statistical data were analysed by t test analysis of variance (*p < 0.05, **p < 0.01, and ***p < 0.001). All the data are expressed as the mean ± SD.
Figure 2
Figure 2
ASFV infection regulated coagulation and related factors in vitro. PAM cells were infected with 0.1 MOI ASFV for 6, 12, 24, or 36 h. A Intrinsic coagulation factors (F12 and F9), crucial coagulation factor F10, and B extrinsic coagulation factors (TF and F7) were detected by western blotting. The coagulation factor band intensities normalized to those of β-actin were scanned and analysed by ImageJ software and are shown in a line chart. C RNA interference was performed via the transfection of 1 μg of siRNA fragments encoding coagulation factors F1-F12 and control siRNA. siRNA-1 from each fragment was transfected into PAMs, which were then infected with 0.1 MOI ASFV or not, and at 36 hpi, the cells were lysed for western blot analysis of F10 expression and coagulation factor expression.
Figure 3
Figure 3
ASFV-encoded proteins regulated F10 expression and activity. A Several encoded proteins expressed in the baculovirus expression system were added to Huh7 cells at the same concentration for 24 h prior to supernatant and cell lysate collection. The mixtures were detected for F10 activity. B Huh7 cells were transfected with plasmids expressing ASFV-encoded proteins, including pK205R, pE199L, pEP153R, p30, p54, and p72, and then, the cells and supernatants were collected for detection of F10 expression by western blotting, C and secretory F10 expression by ELISA. For all figures, the experiments were repeated at least three times with similar results. The data are presented as the mean ± SD from one single experiment. Statistical significance was determined by Student’s t test (*p < 0.05).
Figure 4
Figure 4
Proteomic analysis of p72-interacting proteins. A GO term analysis. Distribution of GO terms into three groups: biological process, molecular function, and cellular component. The upper coordinate represents the number of proteins; the right vertical coordinate represents the percentage of proteins. B Distribution of the top 20 enriched KEGG pathways. KEGG pathways of the p72-related proteins involved in coagulation and the complement cascade.
Figure 5
Figure 5
p72 interacted with F10. A 293-T cells were separately transfected with 1 μg of pcDNA3.1-p72-HA (151–450 aa) or mock plasmid for 24 h. The immune complexes were precipitated with anti-HA antibodies and subjected to western blot analysis. B Pull-down assay. p72 (321–450 aa) was secreted into E. coli and purified with Ni+ purification resin. The target and irrelevant proteins used as mock controls were mixed separately with the F10 protein. The mixtures were slowly shaken overnight at 4 °C, pulled down with Ni+ resin, wand anti-F10 primary antibodies were used to probe the target proteins. C Confocal microscopy. 293-T cells were transfected with 1 μg of pcDNA3.1-p72-HA, pcDNA3.1-F10-FLAG, or mock plasmid in 24-well culture plates for 24 h. At 24 h post-transfection, the cells were processed for confocal microscopy. The primary antibodies used were anti-HA and anti-FLAG, followed by incubation with Alexa Fluor 555-conjugated goat anti-rabbit IgG and Alexa Fluor 488-conjugated goat anti-mouse IgG (at a 1:400 dilution). The cell nuclei were stained with DAPI (blue). The co-expression of p72 (red) and F10 (green) or their independent expression levels were determined via confocal microscopy.
Figure 6
Figure 6
Functional domain of p72. A Schematic of truncated p72 expression. B Confocal microscopy of truncated proteins in Huh7 cells; the target proteins are stained red. DAPI was used to stain the sections blue. Bar, 20 μm. C Truncated plasmids containing amino acids 1–150, 151–422, and 423–646, D 151–450, E and 423–646 of p72 with an HA tag at the C-terminus were transfected (0.5, 1, or 2 μg) into Huh7 cells. At 24 h post-transfection, the cell lysate was collected and subjected to western blot analysis, and the F cell supernatant was collected for detection of secretory F10 expression via ELISA. G Mutant plasmid construction schematic. The sequences of the six p72 mutants ranged from 423–450 aa, and every 10 amino acids were randomly mutated to alanine, which were named 101, 102 (423–432 aa), 201, 202 (433–442 aa), 301, and 302 (443–452 aa). H Confocal microscopy of mutant proteins in Huh7 cells. The target proteins are stained green. DAPI was used to stain the sections blue. Bar, 20 μm. I The mutant plasmids were transfected into Huh7 cells at increasing doses (0.5, 1, and 2 μg). At 24 h post-transfection, the cells were lysed with lysis buffer, and 15 μg of each sample was subjected to western blotting. The band intensities were normalized to those of GAPDH via ImageJ software. The data are expressed as the mean intensity ratio ± SD of F10 to GAPDH. The experiment was performed in triplicate, and images from three independent experiments were plotted. J The cell supernatant was also collected for detection of secretory F10 expression via ELISA. Statistical data were analysed by t test variance (*p < 0.05, ns represents nonsignificant p > 0.05).
Figure 7
Figure 7
TRIM28 interacts with p72 and F10. A Co-localization of TRIM28 with p72 and F10. 293-T cells were co-transfected with p72 and F10-expressing plasmids or their respective plasmids, after which the transfected cells were immunostained. The cells were fixed and visualized by confocal microscopy. p72-HA and F10-FLAG were stained green, and TRIM28 was stained red. Scale bars, 20 μm. B Co-IP of TRIM28 with p72 and F10. Anti-p72-HA antibody affinity purification and anti-TRIM28 antibody affinity purification with lysates from replicon cells are indicated. The bands were quantified and normalized to the input; anti-F10-FLAG antibody affinity purification and anti-TRIM28 antibody affinity purification with lysates from the replicon cells are indicated. The bands were quantified and normalized to the input.
Figure 8
Figure 8
TRIM28 is involved in F10 degradation regulated by p72. A MG132 is an inhibitor of the ubiquitin‒proteasome system and was pretreated with MG132 at concentrations of 10, 50, and 100 nM for 4 h prior to p72 truncation (151–450 aa) transfection. At 24 h post-transfection, the cells were collected for western blot analysis for F10 expression. B siRNAs targeting TRIM28 and the NC were transfected into Huh7 cells at different concentrations (10, 50, and 75 nM). At 12 h post-transfection, the supernatant was removed, the medium was replaced with fresh medium, and the cells were then transfected with p72 truncations or mock controls (1 μg). At 24 h post-transfection with p72 truncations, the cell lysates were collected and subjected to western blot analysis. C siRNAs targeting TRIM28 and the NC were transfected into Huh7 cells (50 nM). At 12 h post-transfection, the supernatant was removed, replaced with fresh media, and then co-transfected with the pGL-F10 promoter plasmid (1 μg) or pRL-TK (0.1 μg) with or without p72 (151–450 aa) (1 μg). At 24 h post-transfection with the promoters, the cell lysates were collected and subjected to western blot and luciferase activity analyses. For all figures, the experiments were repeated at least three times with similar results. The data are presented as the mean ± SD from one single experiment. Statistical significance was determined by Student’s t test (*p < 0.05; **p < 0.01).

Similar articles

References

    1. Dixon LK, Sun H, Roberts H (2019) African swine fever. Antiviral Res 165:34–41 - PubMed
    1. Ge S, Li J, Fan X, Liu F, Li L, Wang Q, Ren W, Bao J, Liu C, Wang H, Liu Y, Zhang Y, Xu T, Wu X, Wang Z (2018) Molecular characterization of African swine fever virus, China, 2018. Emerg Infect Dis 24:2131–2133 - PMC - PubMed
    1. Zhou X, Li N, Luo Y, Liu Y, Miao F, Chen T, Zhang S, Cao P, Li X, Tian K, Qiu HJ, Hu R (2018) Emergence of African swine fever in China, 2018. Transbound Emerg Dis 65:1482–1484 - PubMed
    1. You SB, Liu TY, Zhang M, Zhao X, Dong YZ, Wu B, Wang YZ, Li J, Wei XJ, Shi BF (2021) African swine fever outbreaks in China led to gross domestic product and economic losses. Nat Food 2:802–808 - PubMed
    1. Salas ML, Andres G (2013) African swine fever virus morphogenesis. Virus Res 173:29–41 - PubMed

LinkOut - more resources