. 2024 Nov 12;22(1):1021.
doi: 10.1186/s12967-024-05850-z.

Immunoglobulin-coating patterns reveal altered humoral responses to gut bacteria in pediatric cow milk allergies

Affiliations

Immunoglobulin-coating patterns reveal altered humoral responses to gut bacteria in pediatric cow milk allergies

Tracy Augustine et al. J Transl Med. .

Abstract

Background: Pediatric cow milk allergies (CMA) can occur in immunoglobulin (Ig) E and non-IgE-mediated forms. Unlike IgE-mediated allergies, the mechanisms of disease pathogenesis in non-IgE-mediated food allergy and an association with microbiome has not been well established. Previous studies have identified the presence of altered humoral responses to gut bacteria in IgE mediated allergies. Here, we analyzed IgA, IgE and IgG responses to gut bacteria in subjects with either IgE or non-IgE mediated CMA to identify relative proportions of Ig-coated bacteria and characterize unique disease specific microbial signatures.

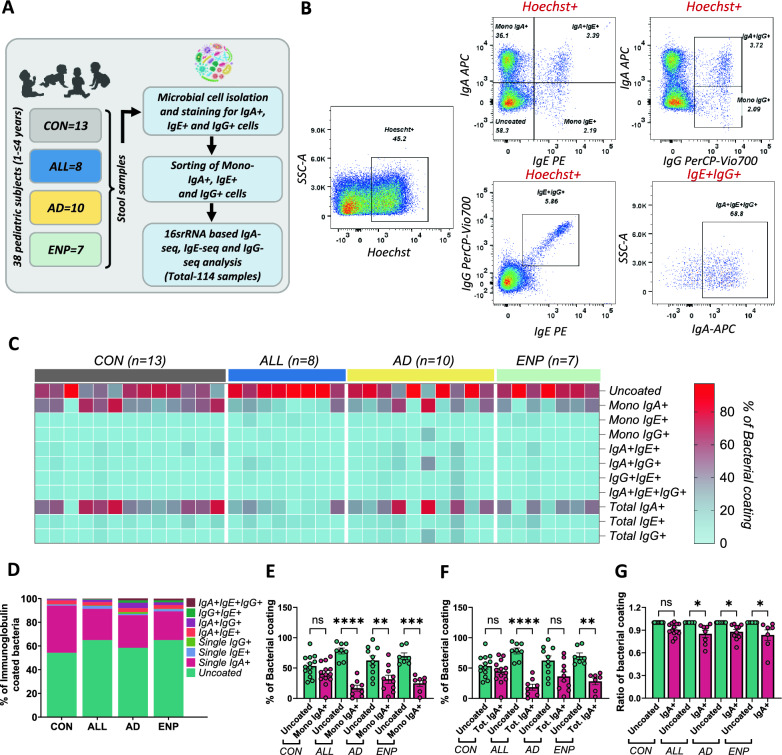
Methods: Multi-parametric flow cytometry analysis was used to identify IgA, IgE and IgG responses to gut bacteria in CMA patients. Cell sorting of Ig coated gut bacteria was subsequently performed followed by high throughput 16S rRNA gene sequencing and specific patterns of humoral responses to gut bacteria assessed in each study group.

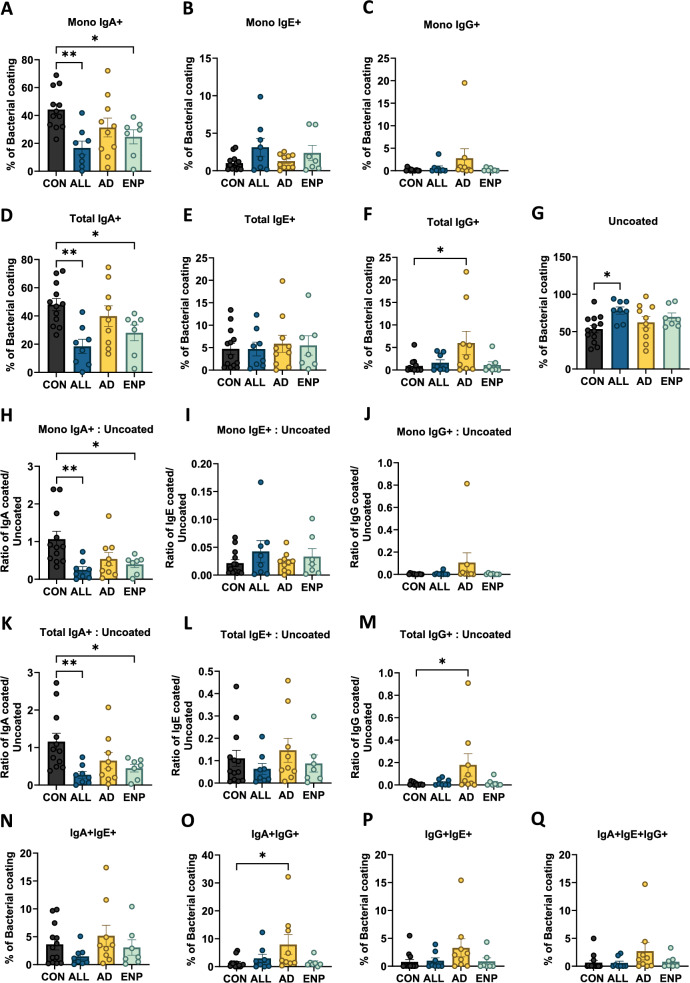
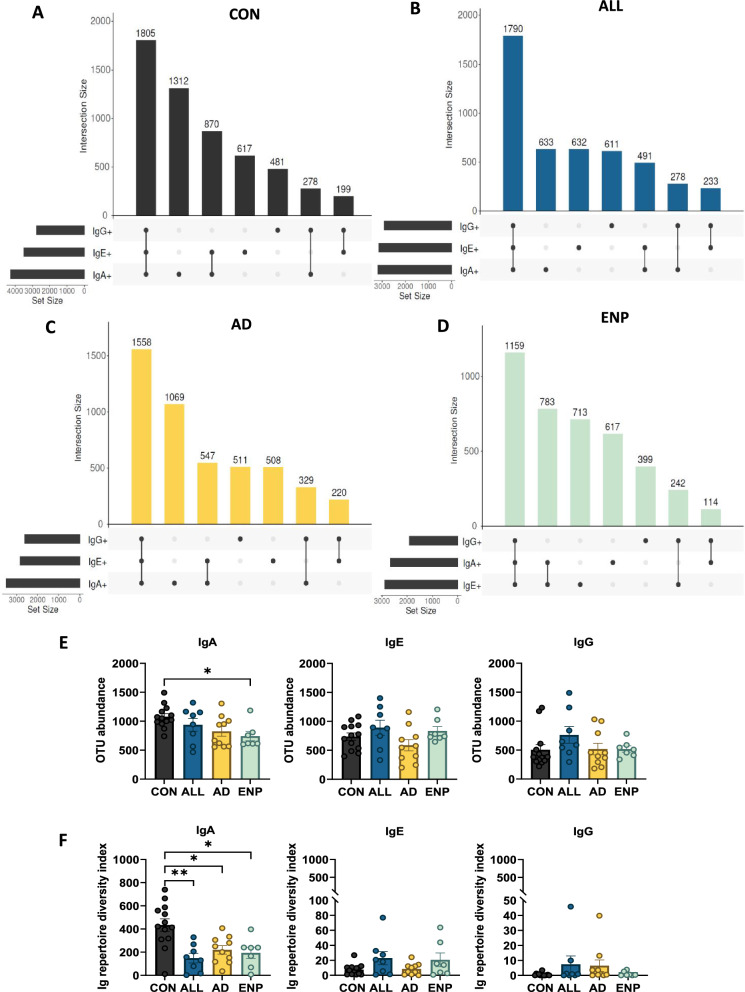
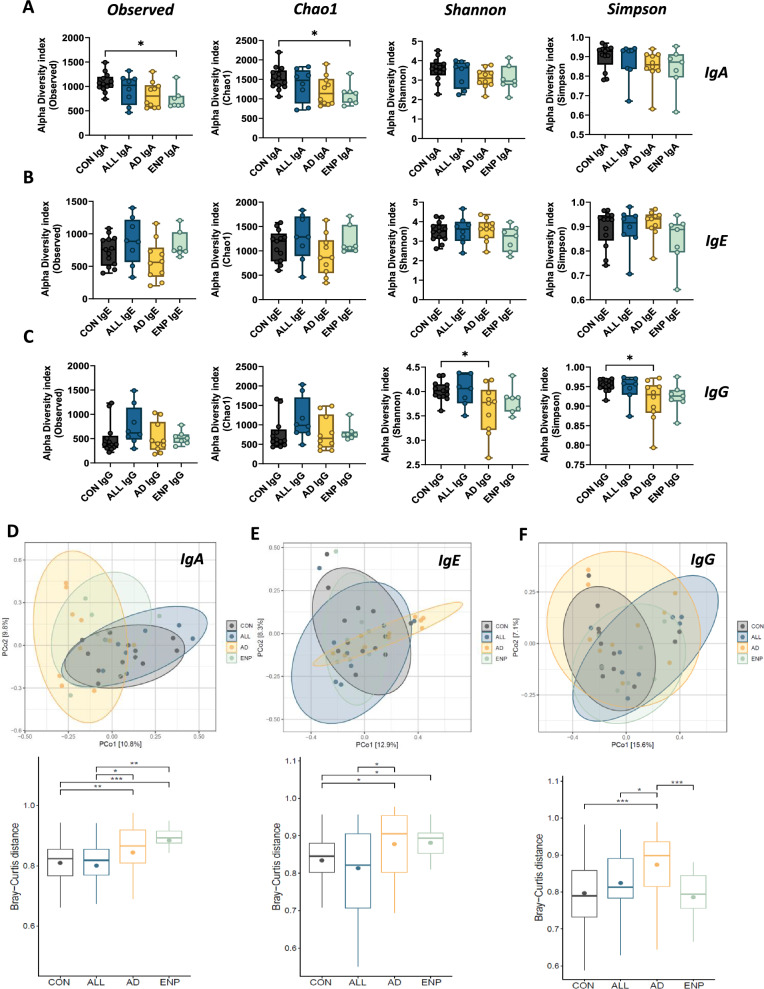
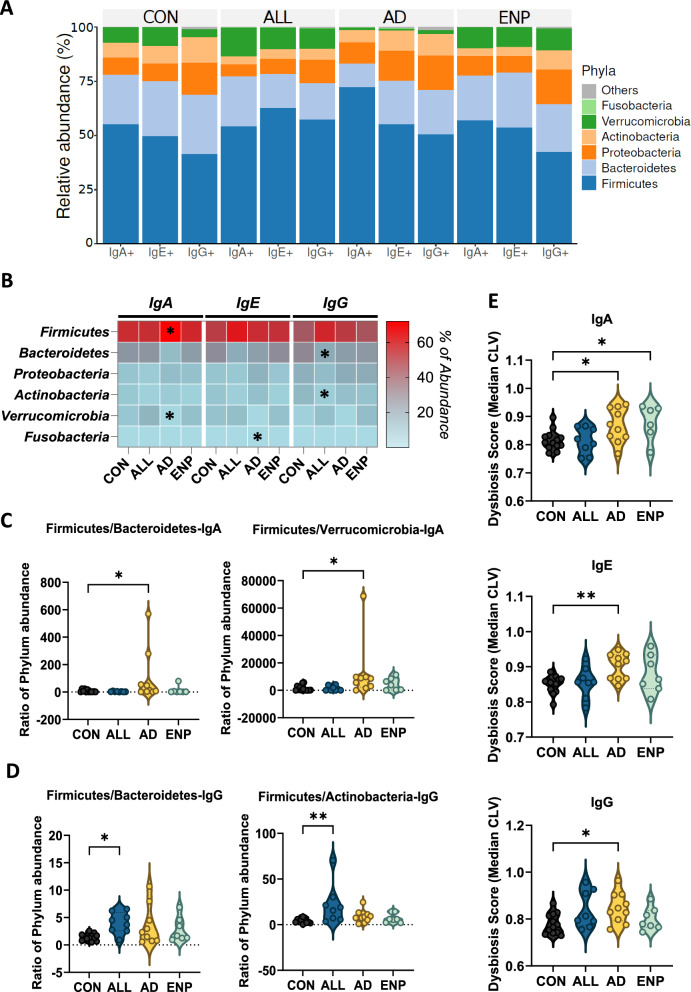
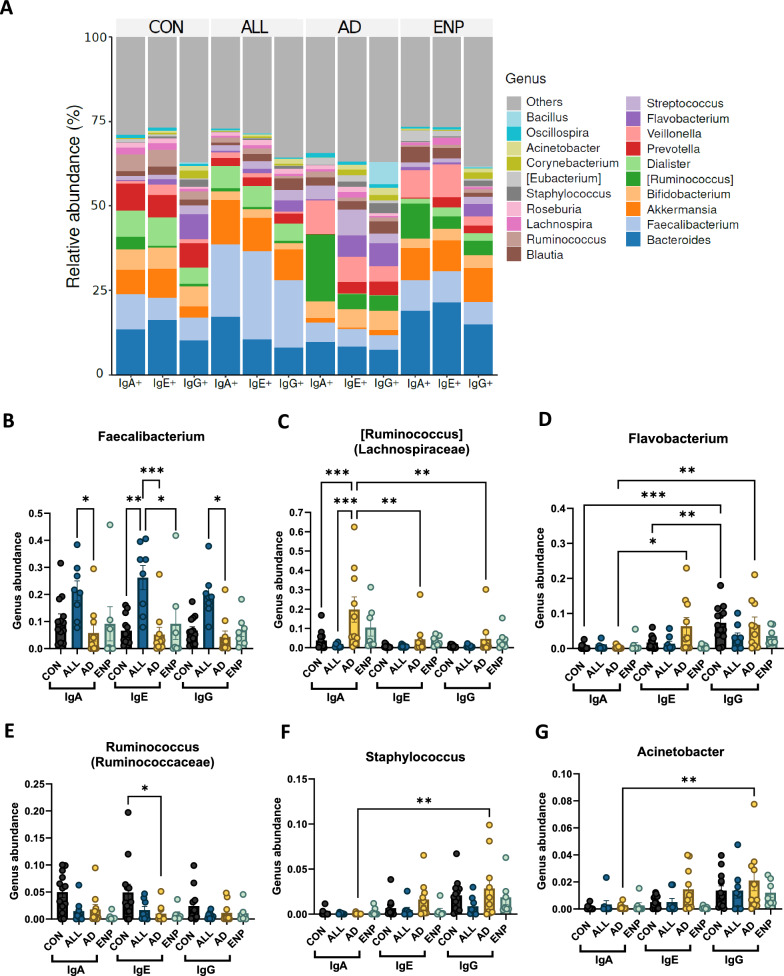
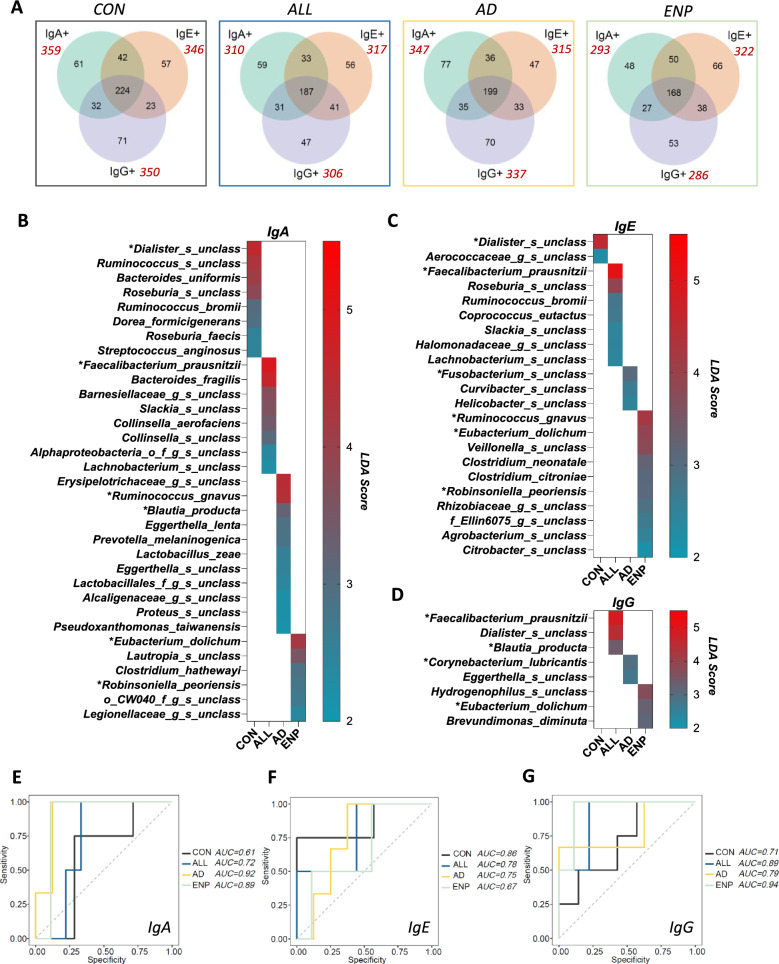
Results: We identified significant alterations in IgA and IgG gut bacterial coating patterns in CMA subjects. Proportions of IgA-coated bacteria were decreased in IgE mediated CMA subjects without atopic dermatitis (ALL) and non-IgE mediated CMA subjects (ENP), compared to healthy controls (CON). In comparison, IgG-coated bacteria was significantly elevated in CMA subjects with atopic dermatitis (AD). Alpha and beta diversities displayed significant differences in IgA-, IgE-, and IgG-coated bacteria in AD and ENP groups. Significant differences in bacteria coated by IgA, IgE and IgG were detected at Phyla, Genus and Species levels and associated bacterial dysbiosis in IgE and non-IgE mediated allergies were identified. Linear discriminant analysis (LDA) effect size (LEFse) revealed unique disease associated bacterial signatures, including several pathogenic bacteria namely Bacteroides fragilis, Ruminococcus gnavus, Eubacterium dolichum, Fusobacterium, Clostridium neonatale and Robinsoniella peoriensis. Receiver operating characteristic curve analysis confirmed the efficiency of using the bacterial signatures identified as biomarkers for disease.

Conclusions: Altered IgA and IgG responses to gut bacteria were identified in CMA subjects. The disease-specific responses were associated with alterations in bacterial diversity and concomitant dysbiosis of Ig-coated bacteria in IgE-mediated and non-IgE-mediated CMA pediatric subjects. The identification of pathogenic bacteria uniquely associated with different classes of allergic disease indicates a role of these bacteria in driving disease-specific pathological phenotypes.

Keywords: Cow milk allergy; Gut bacteria; IgA; IgE; IgG; Immunoglobulin-coating; Microbial dysbiosis.


Conflict of interest statement

Declarations Ethics approval and consent to participate The study obtained written parental consent from all participants before enrollment. The study protocol (1500751) was approved by the Institutional Review Board (IRB) at Sidra Medicine, Doha, Qatar Consent for publication Not applicable. Competing interests The authors declare no competing financial or non-financial interests.

Figures

Fig. 1
Fig. 1
Altered IgA coating in cow milk allergic subjects. A Study outline. B Gating strategy used for identifying bacterial coating in the study subjects. C Heat-map showing the differential coating of bacterial populations in the study subjects. D Stacked plot for differential bacterial coating among the study groups. E and F Quantitative analysis of differential distribution of IgA + (E) and total IgA + (F) alongside uncoated bacteria within the study groups. G Quantitative analysis of the ratio of mono-IgA + to total IgA + coated bacteria compared to the normalised level of uncoated bacteria within the study groups. Quantitative variables were compared using one-way ANOVA and Tukey post-hoc analysis. Statistical significance is defined as *p < 0.05, **p < 0.01 and ***p < 0.001. Data are represented as mean ± SEM. See also Supplementary Figure S1 for fluorescence minus one and background staining controls
Fig. 2
Fig. 2
Differential bacterial coating of IgA, IgE and IgG in cow milk allergic subjects. A, B Comparative analysis of mono-Ig coated and total Ig coated bacterial populations with respect to control subjects. C Quantification of uncoated bacteria across the study subjects. D and E Comparative analysis of the ratio of mono-Ig coated (D) and total Ig coated (E) bacteria to uncoated bacteria in the study subjects. F Comparison analysis of dual IgA + IgE +, IgA + IgG + and IgE + IgG + coated bacteria across the study groups. F Quantification of triple coated (IgA + IgE + IgG +) bacteria across the study subjects. Quantitative variables were compared using one-way ANOVA and Dunnet post-hoc analysis. Statistical significance is defined as *p < 0.05, **p < 0.01 and ***p < 0.001. Data are represented as mean ± SEM
Fig. 3
Fig. 3
Immunoglobulin coating reveals alterations in levels of coated fecal bacterial OTUs. A–D Upset plots showing bacterial taxa across differentially coated subsets within A CON B ALL, C AD and D ENP groups. E Comparative analysis of total detected bacterial OTUs in the study groups. F Ig repertoire diversity index analysis as a measure of the percentage of mono-Ig bound bacteria together with that of the total OTU counts individually for IgA, IgE and IgG coated bacteria [Ig repertoire diversity index = (% of Mono-Ig coating) × (OTU abundance)]. Quantitative variables were compared using Kruskal–Wallis and Dunn’s post-hoc analysis. Statistical significance is defined as *p < 0.05 and **p < 0.01. Data are represented as mean ± SEM
Fig. 4
Fig. 4
Alpha and beta diversity in cow milk allergic pediatric subjects. A Comparison of alpha diversity in IgA, IgE and IgG groups using Observed, Chao1, Shannon and Simpson indices. B, C, D Principal co-ordinate analysis plots of IgA (B), IgE (C) and IgG (D) coated bacteria (above) and box plots for the same (below). Quantitative variables were compared using one-way ANOVA and Dunnet post-hoc analysis for alpha diversity and Wilcoxon test for beta diversity. Statistical significance is defined as *p < 0.05, **p < 0.01 and ***p < 0.001. Data are represented as mean ± SEM
Fig. 5
Fig. 5
Dysbiosis is associated with differential bacterial Ig coating in CMA subjects. A Most abundant phyla among the mono- IgA, IgE and IgG coated bacteria. B Heat-map showing the significant differential distribution of phyla recognition patterns in IgA, IgE and IgG subsets. Each subset has been compared with the control group in the respective subsets. C, D Quantitative analysis of dysbiosis at phyla level analyzing Firmicutes/Bacteroidetes and Firmicutes/Verrucomicrobia in IgA coated (C) and Firmicutes/Bacteroidetes and Firmicutes/Actinobacteria in IgG coated bacteria (D). E Quantitative analysis of dysbiosis using Median CLV dysbiosis score in IgA, IgE and IgG coated bacteria. Quantitative variables were compared using Kruskal–Wallis and Dunn’s post-hoc analysis for panels BD and one-way ANOVA and Dunnet post-hoc analysis for panel E. Statistical significance is defined as *p < 0.05, **p < 0.01. See also Additional file 1, Supplementary Figure S2. Data are represented as mean ± SEM
Fig. 6
Fig. 6
Preferential bacterial coating of most abundant bacteria in CMA subjects. A Top 25 most abundant bacterial genera across mono- IgA, IgE and IgG coated bacteria. BG Quantitative analysis of differential abundance of IgA, IgE and IgG coated B Faecalibacterium, C Ruminococcus from Lachnospiraceae D Flavobacterium E Ruminococcus from Ruminococcaceae F Staphylococcus and G Acinetobacter. Quantitative variables were compared using two-way ANOVA and Tukey post-hoc analysis. Statistical significance is defined as *p < 0.05, **p < 0.01 and ***p < 0.001. Data are represented as mean ± SEM. (See also Supplementary Figure S3 and Supplementary Figure S4)
Fig. 7
Fig. 7
Identification of uniquely dominant bacterial targets of Ig response in CMA groups. A Unique and common bacterial species present in IgA, IgE and IgG subsets among the study groups. Total number of bacterial species bound by each Ig subset in the different study groups are shown in red. BD LEFse analysis showing uniquely abundant bacteria with LDA score above 2 within B IgA, C IgE and D IgG coated bacteria. EG ROC curve analysis showing the AUC analysis for E IgA, F IgE and G IgG coated bacteria

Similar articles

References

    1. Savage J, Johns CB. Food allergy: epidemiology and natural history. Immunol Allergy Clin North Am. 2015;35(1):45–59. - PMC - PubMed
    1. Flom JD, Sicherer SH. Epidemiology of cow’s milk allergy. Nutrients. 2019;11(5):1051. - PMC - PubMed
    1. Elizur A, et al. Natural course and risk factors for persistence of IgE-mediated cow’s milk allergy. J Pediatr. 2012;161(3):482–7. - PubMed
    1. Santos A, Dias A, Pinheiro JA. Predictive factors for the persistence of cow’s milk allergy. Pediatr Allergy Immunol. 2010;21(8):1127–34. - PubMed
    1. Gupta RS, et al. Prevalence and severity of food allergies among US adults. JAMA Netw Open. 2019;2(1): e185630. - PMC - PubMed

MeSH terms

Grants and funding

LinkOut - more resources